
Remember me


Pregabalin shows polymorphism as it can exist in different polymorphs; amorphous, hemihydrate form, Form I, II, III & IV and alpha form [50]. Form-I was utilized in this study and it has a melting range of 194–197 °C [51]. The current result showed endothermic melting peak of the pure pregabalin at 197 °C (Fig. 2 − 1). Figure 2–2 showed endothermic peak at 63 °C belongs to beeswax and non-significant shift for peak of pregabalin to 202 °C. Figures 2 and 3 showed an endothermic peak at 50 °C that belongs to cetyl alcohol and minor shift for pregabalin peak to 202 °C. Figures 2, 3 and 4 showed endothermic peak at 70 °C that corresponds to glyceryl monostearate and minor shift for pregabalin peak to 202 °C. Figures 2–5 demonstrated an endothermic peak at 55 °C of stearic acid and pregabalin at 200 °C. Figures 2–6 and Figs. 2–8 showed flat wide curve that belongs to cellulosic materials (HPMC and MCC) and minor shift for pregabalin peak to 202 °C. Figures 2–7 showed endothermic water loss peak at 150 °C belongs to lactose and minor shift for pregabalin peak to 202 °C. The DSC thermograms did not show significant indication for pregabalin/excipient interaction. The shift of the peak of pregabalin was non-significant as observed and discussed in earlier studies [52].
Fig. 2
DSC thermograms for (1) pure pregabalin, (2) pregabalin/bees wax, (3) pregabalin/cetyl alcohol, (4) pregabalin/GMS, (5) pregabalin/stearic acid, (6) pregabalin/HPMC, (7) pregabalin/lactose and (8) pregabalin/AVICEL
FTIR AnalysisFT-IR spectrum of pregabalin showed characteristic functional groups such as amine group (NH2) stretching bond at 3581 and 2872 cm− 1, hydroxyl group (OH) stretching bond at 3744 cm− 1, carbonyl group (C = O) stretching at 1163 cm− 1, (C-H) stretching bond at 2960, 2935, 2902 cm− 1 and bending at 1388 cm− 1 [53]. The FT-IR results demonstrated no significant changes in the functional groups with all utilized excipients except lactose where the amine group (NH2) peak shifted from 3581 to 2955 cm− 1 and the peak of carbonyl group (C = O) shifted from 1163 to 1389 cm− 1 as summarized in Fig. 3.
Fig. 3
FTIR spectra of for (A) pregabalin, (B) pregabalin/beeswax, (C) pregabalin/cetyl alcohol, (D) pregabalin/GMS, (E) pregabalin/lactose, (F) pregabalin/magnesium stearate, (G) pregabalin/stearic acid and (G, H) pregabalin/HPMC
Micromeritics of the GranulesCarr’s IndexResults of bulk density, tapped density, Carr’s index and angle of repose are summarized in Table 6. The results demonstrated that the minimum value obtained of Carr’s index was 18% for formulation 1 which indicates good compressibility according to [36] while the maximum value was 38.9% for formulation 6 which indicates very poor compressibility. Most trials showed Carr’s index from 25 to 35% indicating fair to poor compressibility due to the presence of HPMC as an extra-granular blend with poor compressibility. Statistical analysis using analysis of variance ANOVA showed that all factors were statistically non-significant (P > 0.05) while filler type and type of lipid material were the highly ranking factors. Mixtures containing lactose DC showed higher bulk density than those containing AVICEL regardless of the lipid material incorporated in the formulation. Moreover, granules prepared with stearic acid showed the lowest bulk density while those prepared with cetyl alcohol displayed the highest density.
Table 6 Micromeritics characters for pregabalin granulesbulk density, tapped density, carr’s index and angle of repose for the granulesAngle of ReposeResults of angle of repose showed that the minimum obtained value was 11.57° for formulation 12 indicating an excellent flowability [36], while the maximum value was 32° for formulation 6 indicating good flowability. Most trials showed an angle of repose values from 16–29° indicating excellent to fair flowability. ANOVA showed that all factors were statistically non-significant (P > 0.05) while hydrophilic matrix amount and lipid material type were the high-ranking factors. Granules prepared with GMS displayed the lowest angle of repose while granules prepared with cetyl alcohol showed the highest values. The effect of lipophilic binder quantity was directly proportional in the range from 20 to 60 mg then inversely proportional after 60 mg. Addition of Methocel E50 LV as an extra-granular matrix displayed the highest angle of repose while addition of Methocel K15M showed the lowest value. The effect of extra-granular matrix quantity was directly proportional on flow characters [54, 55]. The effect of filler type showed a minor advantage for using AVICEL over the lactose DC grade.
Characterization of Pregabalin ER TabletsResults of hardness, friability, thickness, assay and dissolution are summarized in Table 7.
Table 7 Characterizations of pregabalin ER tabletsTablet HardnessThe hardness of the compressed tablets was highly variable among the different formulations indicating a considerable capability of the design to create a wider range of hardness, with a minimum value of 19 N (formulation 4) and a maximum value of 95 N (formulation 14), as shown in Table 7, with SD values less than 3.5% in all formulations indicating consistent results within the same formulation.
ANOVA results showed that the lipid material type, the lipid material quantity and the filler type were the significant factors (p ˂ 0.05) while other factors were non-significant (p ˃ 0.05) (Supplementary Materials, Figure S1-A). The ranking of factors was as follows: lipid material type (rank 1), lipid material quantity (rank 2), filler type (rank 3), hydrophilic matrix quantity (rank 4), hydrophilic matrix type (rank 5) and finally compression force (rank 6) (Supplementary Materials, Figure S1-B). The regression equation for the continuous factors is shown in Supplementary Materials, Figure S1-C.
The interaction effect of the first and second ranked factors, lipid material type and quantity respectively, was summarized in Fig. 4.
Fig. 4
Effect of lipid type and quantity on tablet hardness
Figure 4 illustrated that tablets prepared with 60 mg lipid binder showed the highest hardness values with the following descending order: stearic acid > cetyl alcohol > GMS > beeswax.
FriabilityThe results showed that the friability values of most formulations were below 0.5% while only two formulations (4 and 7) demonstrated friability of more than 1% and failed to pass the test as shown in Table 7. The ANOVA results showed that all factors were non-significant (p ˃ 0.05) (Supplementary Materials, Fig. S2-A) with high ranking for hydrophilic matrix (rank-1) and lipid material qty (rank-2) (Supplementary Materials, Fig. S2-B). The regression equation for the continuous factors is demonstrated in Fig. S2-C. The interaction effect of the hydrophilic matrix and lipid material qty was summarized in Fig. 5.
Fig. 5
Effect of hydrophilic matrix type and lipid quantity on friability
Figure 5 illustrated that tablets prepared with Methocel K15M, K100M and K100LV showed friability below 0.5% with no significant differences between them while those prepared with Methocel E50LV showed friability values of more than 1.0% while the tablets prepared with 60 or 80 mg lipid showed friability below 0.5% with no significant differences between them while those prepared utilizing 20 or 40 mg showed friability values of more than 1.0% and failed in the test.
Tablet ThicknessThe thickness of the tablets ranged from 3.12 ± 0.24 to 3.98 ± 0.28 mm as shown in Table 7. The values were related to the hardness of tablets and were accepted to allow smooth packaging of the tablets either in bottles or blisters.
Drug ContentAs shown in Table 7, the results of drug content for all formulations were within the accepted specifications (90.0–110.0%). The minimum value was 93.54% and the maximum was 105.84%. Assay results confirmed that pregabalin is a thermo-stable molecule and no significant loss occurred during the whole process.
Determination of Dissolution ProfileDissolution results of the free pregabalin and the tested formulations were summarized in Table 8. The free drug demonstrated rapid and complete dissolution within the first hour. Most of the tested formulations showed a slower dissolution profile as compared to the free pregabalin indicating that the design can create the ER action. The variability in the dissolution profiles among the different formulations indicated that the utilized parameters have a substantial impact on the drug release rate. While formulations 1, 7, 8, 11, 12, and 14 demonstrated a relatively fast initial release, formulations 3, 4, 5, 6, 9, 10, 13, 15, and 16 showed a much slower initial release profile.
Table 8 Dissolution results of pregabalin ER formulationsThe statistical analysis of the release study at the studied time intervals is discussed as follows:
Dissolution after 1 hANOVA results showed that the effect of all factors, except for the compression force, was significant (p ˂ 0.05) as demonstrated in Fig. S3-A (Supplementary materials). The ranking of the studied factors was as follows: hydrophilic matrix quantity (rank 1), lipid material quantity (rank 2), hydrophilic matrix type (rank 3), lipid material type (rank 4), filler type (rank 5) and compression force (rank 6) as illustrated in Fig. S3-B (Supplementary materials) and the regression equation for the continuous factors is demonstrated in Fig. S3-C. The two highest ranked factors were selected for studying the interaction effect on the dissolution after 1 h and illustrated in Fig. 6A. The results showed that at zero-level quantity of hydrophilic matrix, dissolution was above 80% at all levels of lipid materials while at the highest level of hydrophilic matrix (100 mg), the dissolution was ca. 30% regardless of the quantity of lipid materials.
Dissolution after 2 hANOVA results showed that the factors studied had non-significant effects (p ˃ 0.05) as demonstrated in Fig. S4-A (Supplementary Materials). The ranking of the factors was: hydrophilic matrix quantity (rank 1), lipid material quantity (rank 2), hydrophilic matrix type (rank 3), lipid material type (rank 4), filler type (rank 5) and compression force (rank 6) as illustrated in Fig. S4-B (Supplementary Materials) and regression equation for the continuous factors as shown in Fig. S4-C. The interaction effect of the highest ranked factors, hydrophilic matrix quantity and lipid material quantity, on the dissolution after 2 h is shown in Fig. 6B. At zero-level hydrophilic matrix, high mean dissolution was demonstrated (˃ 75%) using any level of lipids. At the level of 25 and 50 mg, increasing the quantity of lipid material led to a significant decrease in the dissolution. At the highest level of hydrophilic matrix (100 mg), the quantity of lipid material showed non-significant effect, and most values were below 30%.
Fig. 6
(A) Effect of hydrophilic matrix and lipid quantities on the dissolution after 1 h, (B) Effect of hydrophilic matrix and lipid quantities on the dissolution after 2 h, (C) Effect of hydrophilic matrix and lipid quantities on the dissolution after 4 h, (D) Effect of hydrophilic matrix type and lipid quantity on dissolution after 8 h
Dissolution after 4 hANOVA results showed that the factors studied had non-significant effects (p ˃ 0.05) as demonstrated in Fig. S5-A (Supplementary Materials). The factors studied were ranked as follows: hydrophilic matrix quantity (rank 1), lipid material quantity (rank 2), hydrophilic matrix type (rank 3), compression force (rank 4), compression force (rank 5) and filler type (rank 6) as shown in Fig. S5-B (Supplementary Materials) and regression equation for the continuous factors is shown in Fig. S5-C. The interaction effect of the highest ranked factors, hydrophilic matrix quantity and lipid material quantity, on the dissolution after 4 h illustrated that at low levels of hydrophilic matrix (0 and 25 mg), high dissolution was observed (˃ 90%) at all lipid levels used except for 80 mg lipid which demonstrated mean dissolution value of 55%. At the higher hydrophilic matrix levels (50 & 100 mg), increasing the quantity of lipid material led to significant decrease in dissolution (40–50%) (Fig. 6C).
Dissolution after 8 hANOVA results demonstrated non-significant effects for all the factors studied (p ˃ 0.05) (Supplementary Materials, Fig. S6-A). The factors studied were ranked as follows: lipid material quantity (rank 1), hydrophilic matrix type (rank 2), lipid material type (rank 3), filler type (rank 4), hydrophilic matrix quantity (rank 5) and compression force (rank 6) (Supplementary Materials, Fig. S6-B). The regression equation for the continuous factors is shown in Fig. S6-C. The interaction effect of the highest ranked factors, lipid material quantity and hydrophilic matrix type, on the dissolution after 8 h demonstrated that only tablets prepared by Methocel K15M and K100M were able to maintain dissolution below 90%.
Evaluation of the dissolution results using the probability plots as demonstrated in Fig. 7 revealed varying degrees of normality across the different time points. At 1 h, the data showed slight deviations from the expected normal distribution, particularly at the lower end, with several points falling outside the 95% confidence interval. The corresponding p-value of 0.032, being below the significance level of 0.05, indicates that the data are not normally distributed. Similarly, at 2 h, deviations were observed at both the lower and upper ends of the plot, and some points lay just outside the confidence interval. The p-value was 0.032, indicating non-normal distribution. The results demonstrated at 4 h were more closely aligned with the straight line, and most points fell within the 95% confidence interval, with a p-value of 0.051 slightly exceeded the 0.05 threshold, suggesting that the data at this time point can be considered approximately normally distributed. At 8 h, the data appeared to closely fit with the straight line, with most points well within the confidence interval. The p-value of 0.019 indicates that the dissolution data at 8 h showed almost normal distribution.
Fig. 7
Probability plot for dissolution results at the intervals of 1, 2, 4 and 8 h
Release KineticsThe release kinetics were summarized in Table 9. The results showed that none of the trials followed the zero-order model. Most formulations prepared using Methocel with LV grade (E50 LV and K100 LV) followed Hixon-Crowell model while formulations prepared using other grades (K15M and K100M) followed first-order model. Formulation 8 followed Korsmeyer-Peppas model. The kinetic models are assuming almost diffusion mechanisms as a result from combination of hydrophilic / lipophilic matrices [56, 57].
Table 9 Calculated (r2) for different release modelsOptimization StepOptimization step was performed based on the desirability function for each factor according to the required QTPP and CQA’s and evaluated data. The target values were established using the response optimizer tool in Minitab® 18 software. Tablet hardness was targeted to be maximum, friability to be minimum, dissolution after 1 h to be 10%, dissolution after 2 h to be 20%, dissolution after 4 h to be 40% and dissolution after 8 h to be 80% as illustrated in Fig. 8.
Fig. 8
Recommended optimized formulation for pregabalin ER tablets
According to the recommended values in Fig. 8, the optimized formulation was prepared and evaluated as summarized in Table 10.
Table 10 The composition and evaluation of the optimized formulationThe design space for dissolution was demonstrated using contour plots at 1, 2, and 4 h intervals, plotted against two of the three continuous factors, as illustrated in Fig. 9A-C. The plot revealed a narrow region (dark blue area) representing the desired dissolution value (below 20%), while the surrounding areas may be considered potential failure zones (Fig. 9A). In Fig. 9B, the contour plot identified a suitable region (light yellow area) corresponding to the target dissolution range of 20–40%, with other regions potentially considered failure modes. Similarly, Fig. 9C showed an appropriate space (light yellow area) for the desired dissolution range of 40–60%, while other areas were also considered as failure mode.
Fig. 9
Contour plot for dissolution after (A) 1 h, (B) 2 h, and (C) 4 h
Figure 10A and B illustrates the DSC thermograms and FTIR spectra of the optimized formulation with and without pregabalin. The DSC thermogram illustrates the incorporation of the drug within the optimized formulation as evidenced by the appearance of the pregabalin peak that was further confirmed by the FTIR analysis.
Fig. 10
(A) DSC thermograms and (B) FTIR spectra of the (1) optimized formulation with pregabalin, (2) optimized formulation without pregabalin, and (3) free pregabalin
In Vivo StudyComparative Dissolution StudyThe comparative dissolution was done in the basic FDA medium 0.06 M HCl and in phosphate buffer pH 6.8, acetate buffer pH 4.5 and 0.1 N HCl as the general recommended FDA media. The results were calculated as an average of 12 units from each product; the reference product (Ref) and the optimized formulation (Test). The similarity factor f2 and difference factor f1 were calculated using an excel sheet. The results showed accepted similarity (f2 more than 50) in all media as summarized in Fig. 11.
Fig. 11
Comparative dissolution profile of the optimized formulation against the reference product (Lyrica® CR) in four FDA media
Analytical Validation and Chromatographic ConditionsThe LC-MS system showed pregabalin peak at a retention time of about 3.9 min which was suitable for the large number of samples in the in vivo study as shown in Fig. 12 (upper panel). The established calibration curve showed a regression model with R2 = 0.9988 which was statistically accepted as illustrated in Fig. 12 (lower panel).
Fig. 12
Chromatographic peak of pregabalin using LC-MS (upper panel) and calibration curve of pregabalin using LC-MS (lower panel)
The rest of validation parameters were done according to the ICH guidelines for bioanalytical method validation [58]. It showed accepted values for all parameters, especially the stability of the solution due to its importance in the cross-over studies as summarized in Table 11.
Table 11 Parameters for analytical method validation of pregabalin in plasmaPharmacokinetic StudyIn vivo study results were calculated using WINNONLIN (8.1.0.3530) software. Statistical analysis of all primary pharmacokinetic parameters was performed based on a parametric random ANOVA model except Tmax which was analyzed using nonparametric test (Wilcoxon test). The ANOVA model used in calculation was fixed factors: sequence, subject (sequence), period, treatment.
The criteria for bioequivalence were two one-sided 90% confidence interval (CI) of the ratio of geometric means (Test/Reference) obtained from the Ln-transformed pharmacokinetic parameters, and the 90% CI limit should lie between 80 and 125%. The results were summarized in Table 12.
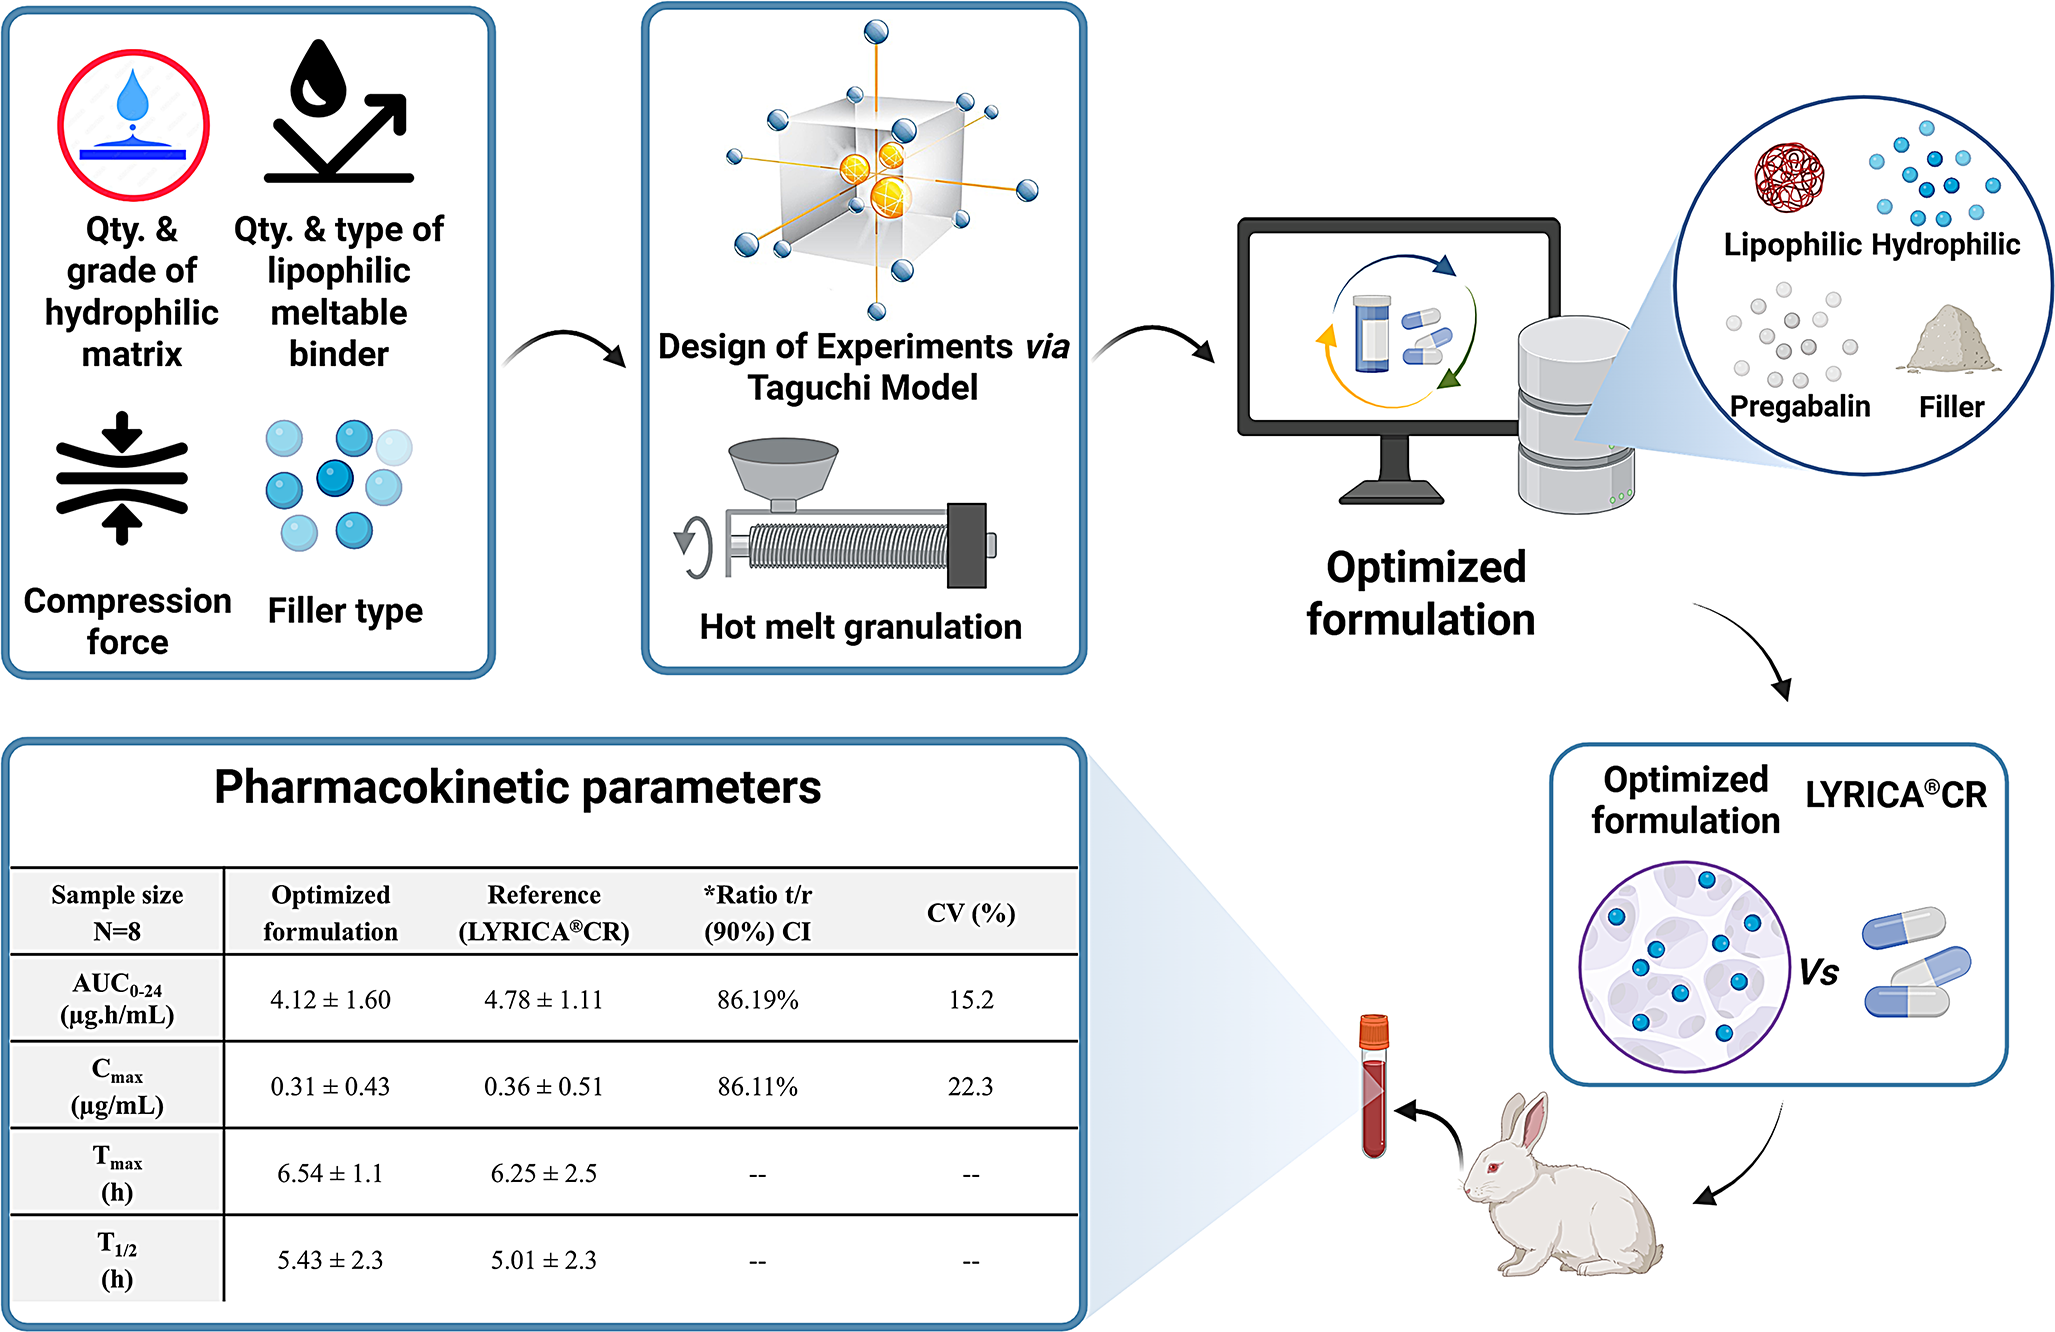
Table 12 Summary of pregabalin pharmacokinetic parameters and statistical analysis parametersThe results showed that the optimized formulation and the reference product have Tmax of 6.54 and 6.25 h, respectively, which were in agreement with several pregabalin controlled release formulations (i.e., Tmax of 5.86 h) [59]. The delay in Tmax of the optimized formulation compared to the reference product may be attributed to the combination of hydrophilic/hydrophobic matrices rather than hydrophilic matrix used in Lyrica® CR as discussed and observed in different studies [60, 61].
Results of Cmax for the optimized formulation were comparable to the reference product (i.e., 0.31 and 0.36 µg/mL), respectively, which indicates almost the same absorption profile. The total drug exposure was also comparable since the area under the curve (AUC) for the optimized formulation and the reference product was 4.12 and 4.78 µg.h/mL, respectively.
Both the Cmax and AUC showed comparable pharmacokinetics with the reference product since the ratio of the test/reference was almost 86% for both. Elimination rate also was comparable to the reference products as the results of the T½ were 5.43 and 5.01 h respectively. The results confirmed the previous studies and reported data regarding the linear pharmacokinetics of controlled release pregabalin formulation [62, 63].
Comments (0)