
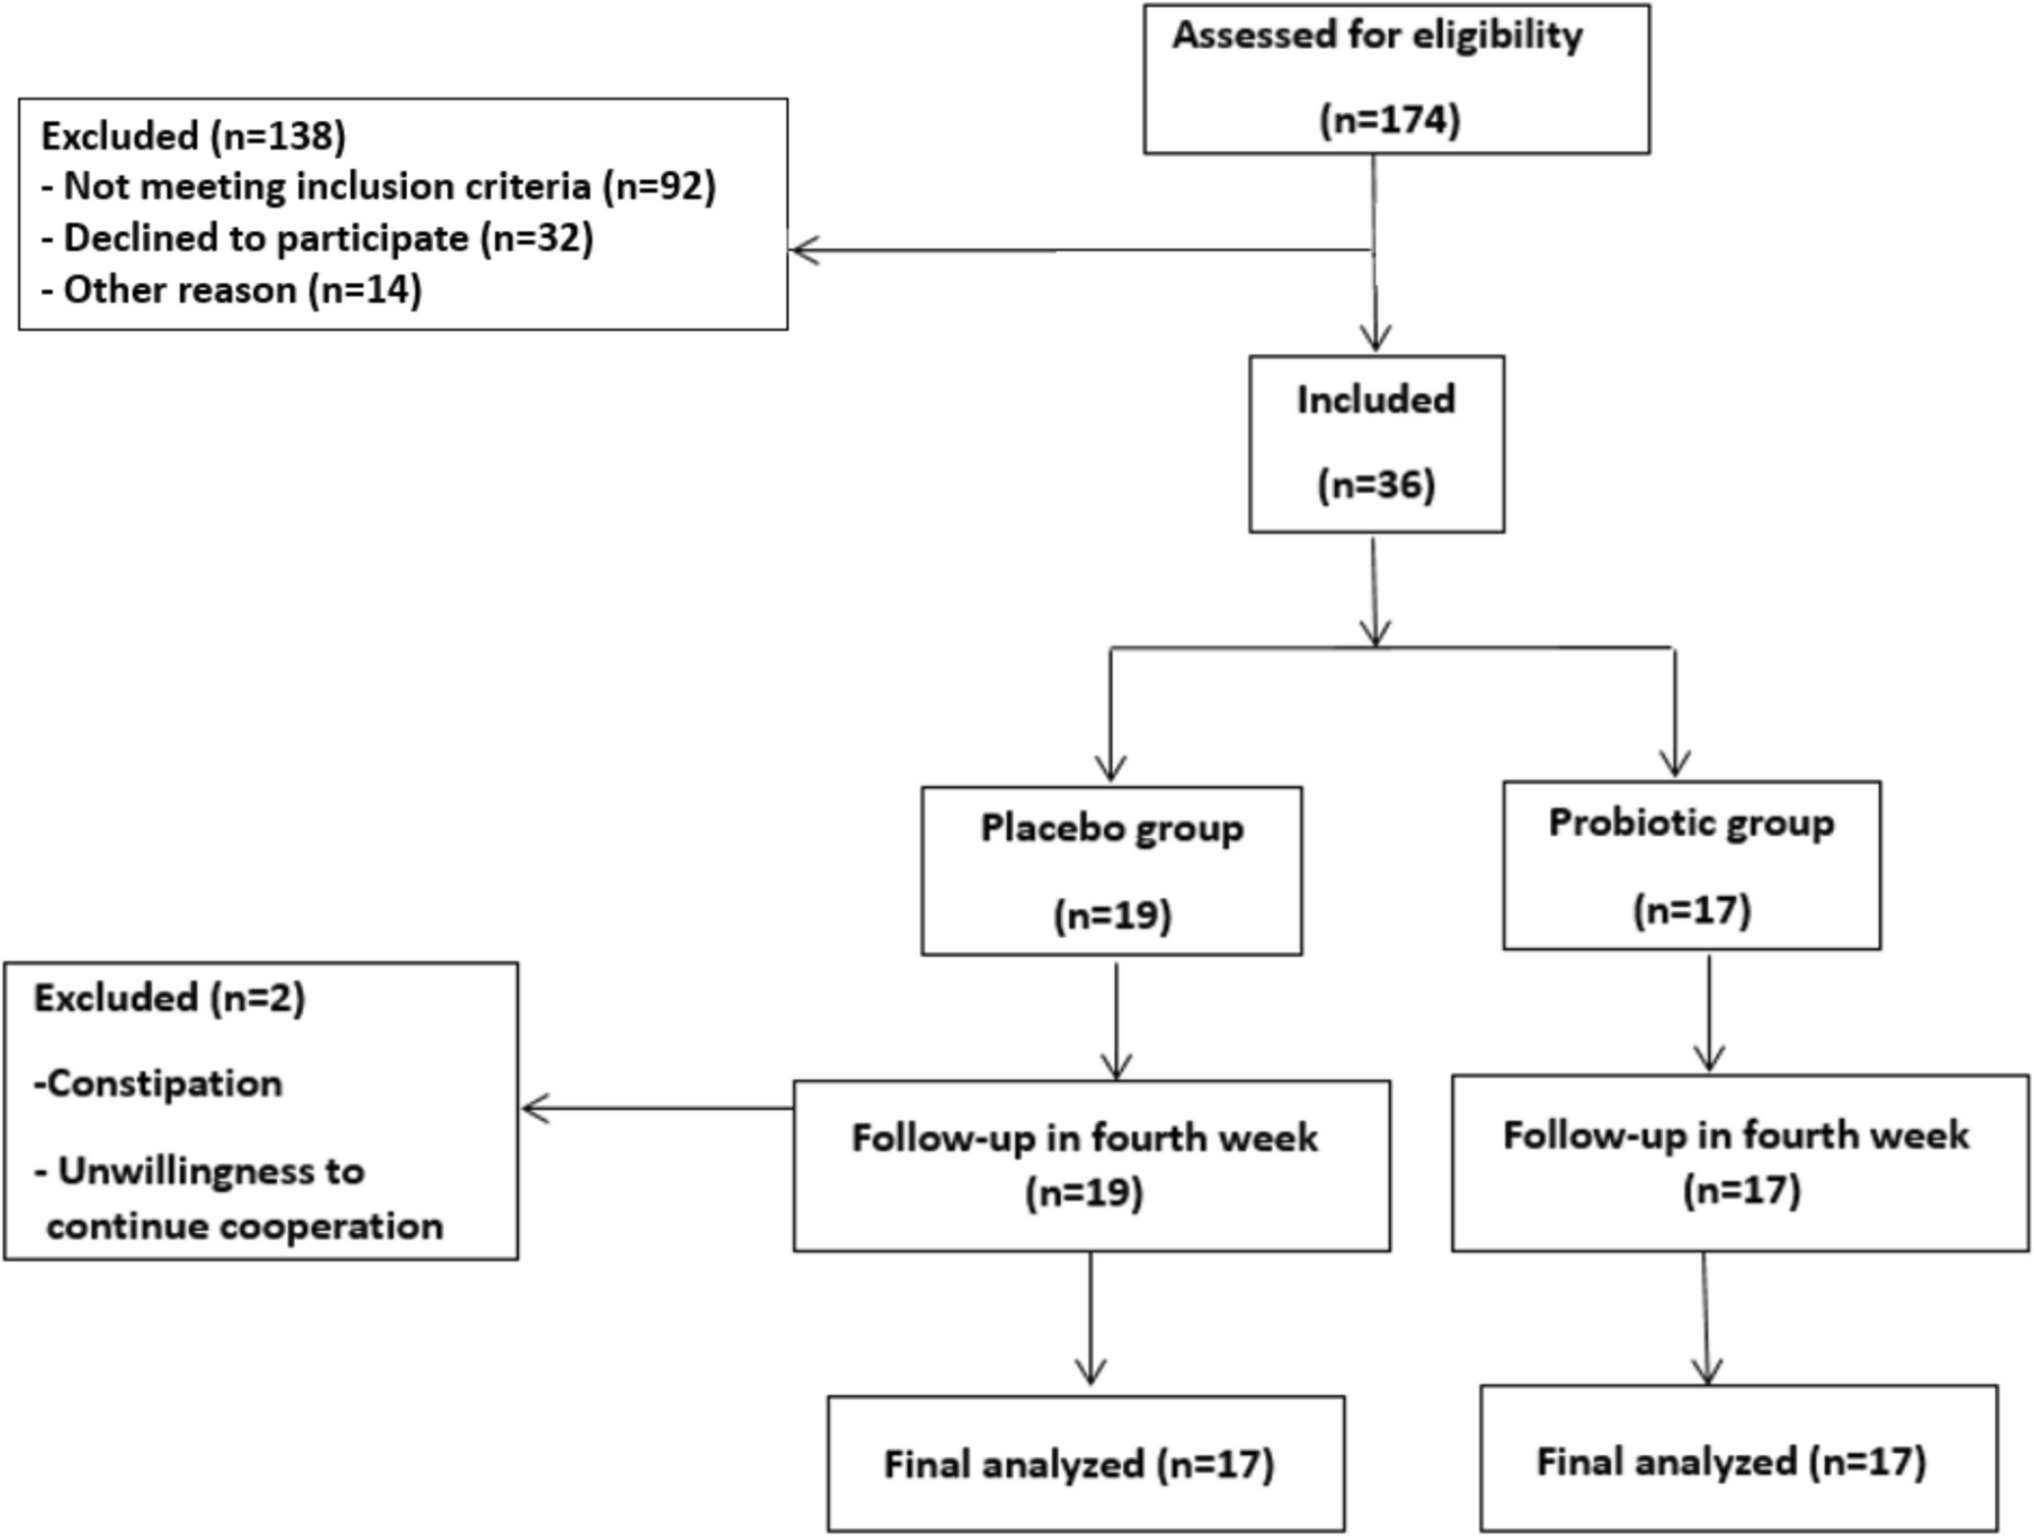
Remember me


The development of a robust analytical method for Domiphen bromide was challenging because of its polar quaternary ammonium structure, which often causes peak asymmetry and poor retention in reversed-phase systems. These issues were systematically addressed through optimization of the stationary phase and mobile phase composition.
Stationary Phase SelectionSeveral reversed-phase columns (C8, C18, and phenyl) were screened to optimize the retention and peak shape of domiphen bromide, a compound known for its polar quaternary ammonium structure and tendency to exhibit peak tailing. An Inertsil ODS-3 column (3 × 250 mm, 5 μm), which features an end-capped octadecylsilyl (C18) stationary phase, was selected because of its superior chromatographic performance. The end-capping of the ODS-3 column effectively reduced the residual silanol activity, resulting in improved peak symmetry and minimized tailing while providing adequate retention for Domiphen bromide. This combination of properties made the Inertsil ODS-3 column the optimal choice for reliable and reproducible analysis in this study.
Mobile Phase OptimizationDifferent combinations of acetonitrile or methanol with aqueous phases (neutral water, phosphate buffer [pH 2.5–7.0], acetate buffer [pH 4.0–5.5], and perchloric acid solution [0.0116 M]) were evaluated. Neutral water caused severe peak tailing due to unmitigated silanol interactions. The engineered systems showed partial improvement but Yielded suboptimal peak symmetry. The addition of 0.0116 M perchloric acid (yielding pH ∼2.0 in the aqueous phase) significantly improved peak shape by suppressing residual silanol activity and maintaining a consistent ionization state of Domiphen bromide for reproducible analysis. The ratios of the ACN: aqueous phase (60:40 to 80:20, v/v) were systematically optimized to balance multiple critical chromatographic parameters, including resolution, peak symmetry, and runtime. The 70:30 ratio provided optimal balance, delivering a suitable retention time (4.38 min) ensuring adequate separation while maintaining practical analysis time, excellent peak symmetry (tailing factor: 1.12) crucial for accurate quantification of this polar quaternary ammonium compound, and critical resolution (> 5.6) necessary to separate DB from degradation products, ensuring the specificity of the stability-indicating method. Higher ACN ratios (e.g., 80:20) compromised the resolution between the analyte and degradation products, whereas lower ratios (e.g., 60:40) unnecessarily prolonged the analysis time without improving the separation quality.
Although rounded acid concentrations (e.g., 0.020 M) were not explicitly tested, a robustness evaluation (Table 5) confirmed that ± 2% absolute variation in the ACN: acid ratio (68:32 and 72:28)—proportionally altering the effective acid concentration—had a negligible effect on the retention time (%RSD 0.48–0.54%) and peak area (%RSD 0.78–0.82%). The 0.0116 M concentration represents the minimal effective level to achieve the target pH (∼2.0) and optimal performance, aligning with green chemistry principles by using the lowest necessary reagent concentration. This low concentration mitigates environmental hazards compared with stronger acids (e.g., 0.1 M phosphate buffers), reducing both corrosion risk and perchlorate waste generation. The acidic pH (∼2.0) of the aqueous phase is critical for suppressing residual silanol activity in the stationary phase and preventing peak tailing of the quaternary ammonium compound, as evidenced by the dramatic improvement compared with neutral water conditions. Methanol-based mobile phases were abandoned because of broader peaks and prolonged retention times. The environmental impact of solvent selection was carefully weighed against the analytical performance. While acetonitrile (ACN) constitutes 70% of the mobile phase, its use enables a short 6-min runtime, reducing total solvent consumption per analysis (~ 8.4 mL/sample) compared with methanol alternatives (> 15 mL/sample). This efficiency offsets higher ACN concentrations through reduced energy consumption and waste volume. ACN classification as flammable or toxic (LD₅₀ 2,460 mg/kg) necessitates careful handling, but its complete recyclability via distillation minimizes its long-term environmental impact. The use of perchloric acid in the mobile phase was carefully considered during method development. While strong acids such as perchloric acid may reduce the column lifespan due to their corrosive nature, several factors in the present method mitigate this risk. First, the concentration of perchloric acid used (0.0116 M) was relatively low, minimizing its impact on stationary phase stability. Second, all chromatographic runs were conducted at a moderate column temperature of 25 °C, further reducing the likelihood of accelerated column degradation. Third, this acid replaces more environmentally problematic ion-pair reagents, such as alkyl sulfonates, which exhibit greater persistence and complex waste management requirements. Importantly, the inclusion of perchloric acid at this concentration was essential to achieve the optimal peak shape and resolution for domiphen bromide, a highly polar quaternary ammonium compound that otherwise exhibited significant peak tailing. Throughout method validation and robustness testing, no deterioration in column performance was observed, supporting the suitability of the selected conditions for routine analysis. Therefore, the use of perchloric acid in this context is justified by the analytical benefits it provides, while the operational parameters employed ensure both method robustness and acceptable column longevity.
Optimization of the Detection ParametersSpectral analysis of domiphen bromide via an Agilent 1260 Infinity II diode array detector (200–400 nm scan range) revealed maximum UV absorption at 275 nm. The selection of 275 nm for UV detection enhances the method’s sensitivity and specificity, as this wavelength is particularly well suited to the electronic structure of DB, allowing for enhanced signal detection and lower limits of quantification than other wavelengths tested across the 200–400 nm range. The wavelength optimization demonstrated that 275 nm provided the most robust detection for DB, offering strong, clear absorbance with minimal interference from the matrix, as shown in Figure S1.
A selectivity assessment was conducted through comparative scans of placebo solutions (Maalox® without DB), confirming negligible absorbance at 275 nm and ensuring no interference from matrix components. Flow rate optimization (1.5–2.5 mL/min in 0.2 mL/min increments) revealed that 2.0 mL/min optimally balanced separation efficiency with practical analysis requirements, delivering stable retention times (RSD = 0.3%), acceptable backpressure (~ 180 bar), and critical resolution (Rs 5.6). The lower rates (≤ 1.8 mL/min) increased the analysis time by 40% without resolution gains, whereas the higher rates (≥ 2.2 mL/min) caused significant peak broadening (asymmetry > 1.3) and resolution loss (Rs < 2.0).
Method ValidationSystem Suitability AssessmentThe performance of the chromatographic system was evaluated via established suitability parameters. As demonstrated in Table 1, all the measured parameters consistently fell within the acceptance criteria, confirming the reliability of the analytical system for the intended application.
LinearityThe analytical method demonstrated excellent linearity across the expanded concentration range of 1.132–1000 µg/mL, encompassing the LOQ. Regression analysis yielded the equation y = 11.978x + 2.489, with a determination coefficient (R²) of 0.9997, indicating strong proportionality between the analyte concentration and detector response across the entire range. This expansion validates the method’s quantitative capability at trace levels and supports accurate determination starting from the LOQ. The comprehensive linearity parameters are presented in Table 1. The method’s actual detection sensitivity is evidenced by the calculated LOD (0.373 µg/mL) and LOQ (1.132 µg/mL). Table S1A summarizes the calibration data, including the mean peak area, standard deviation, and %RSD across all concentrations. The strong linear relationship, even at the lowest levels, confirms the method’s suitability for both routine analysis and stability studies of pharmaceutical formulations containing domiphen bromide Fig. 2.
Fig. 2
Linearity plot of Domiphen bromide showing the correlation between concentration (1.132–1000 µg/mL) and peak area (mAU). The linear regression equation, determination coefficient (R²), and sensitivity parameters (LOD and LOQ) are included. The data points represent the means of three replicates at each concentration
Precision EvaluationThe method’s precision was evaluated through repeatability (intraday), intermediate precision (interday), and ruggedness (interanalyst variation). The results are expressed as relative standard deviation percentages and are summarized in Table 1. The consistently low % RSD values (all below 2%) across all concentration levels demonstrate the exceptional precision characteristics of the developed methodology.
Accuracy AssessmentMethod accuracy was determined through the %RE at three different concentrations. The observed mean recoveries ranged between 98.8% and 99.76%, with RSD values consistently below 2%, demonstrating exceptional accuracy. The detailed recovery data are presented in Table S1C and summarized in Table 1.
SpecificityThe specificity of the analytical method was established through comparative chromatographic analysis of blank matrices (diluent and mobile phases), placebo preparations and standard solutions. The absence of interfering signals at the retention time corresponding to Domiphen bromide in the blank and placebo chromatograms confirms the method’s specificity for the target analyte in the presence of formulation components, as illustrated in Fig. 3.
Fig. 3
Overlay chromatogram demonstrating method specificity for Domiphen bromide analysis. The chromatogram shows four conditions: diluent (purple), mobile phase (green), placebo sample (red), and standard solution (blue)
Detection and Quantitation LimitsThe method’s sensitivity was characterized through calculation of the detection and quantitation limits on the basis of the standard deviation of the calibration curve y-intercept and slope (as detailed in the Sensitivity Parameters section of Table 1). The obtained LOD (0.373 µg/mL) and LOQ (1.132 µg/mL) demonstrated excellent analytical sensitivity, fully supporting trace-level quantification. These values fall well below the lower end of the validated linearity range (1.132–1000 µg/mL), confirming the method’s suitability for low-level detection and quantification. This sensitivity Aligns with the needs of quality control analysis of pharmaceutical formulations, where Domiphen bromide concentrations typically range from 100 to 1000 µg/mL after sample preparation, and supports stability studies and impurity profiling. Even under forced degradation conditions, where the highest observed degradation was 26.72% (under basic conditions), the remaining parent compound levels remained well above the LOQ, validating the method’s ability as a stability-indicating assay. Notably, the method achieves this performance via conventional UV detection at 275 nm (λmax for Domiphen), offering a cost-effective alternative to more complex techniques such as mass spectrometry.
Robustness EvaluationMethod robustness was assessed by intentionally introducing controlled variations in critical chromatographic parameters, including mobile phase composition, flow rate, column temperature, pH of the aqueous phase (perchloric acid buffer), and perchloric acid concentration. The results, expressed as relative standard deviations (%RSD) of the peak area (reflecting the measured concentration) and retention time, are presented in Table 1. Minor changes in the mobile phase composition (± 2%), flow rate (± 0.2 mL/min), column temperature (± 2 °C), buffer pH (2.0 ± 0.2), and perchloric acid concentration (0.0116 M ± 10%) produced only slight variations in the retention time and peak area, with all %RSD values remaining well below 1%. The method consistently yielded sharp, symmetrical peaks and maintained system suitability criteria under all tested conditions. These findings confirm that the method is robust and reliable for routine analysis and stability assessment of Domiphen bromide in pharmaceutical formulations.
Table 1 Summary of method validation parameters for Domiphen bromide by RP-HPLCQuality by Design-Based Method OptimizationTo ensure the method’s reliability and suitability for stability studies, a quality by design (QbD) framework was employed during method development. This approach allowed for a systematic assessment of key chromatographic variables and their interactions, ensuring the method’s capacity to detect degradation products under varying conditions, which is an essential requirement for stability-indicating methods.
On the basis of the quality target product profile (QTPP), critical quality attributes (CQAs) were established to define method performance: retention time reproducibility (%RSD ≤ 1.0%), resolution (Rs ≥ 2.0 between domiphen bromide and its nearest degradant), peak symmetry (tailing factor ≤ 1.2), column efficiency (theoretical plates ≥ 4000), and quantification precision (peak area %RSD ≤ 2.0%).
A full factorial 2³ design of experiments (DoE) was used to evaluate the influence of three critical parameters: the acetonitrile ratio in the mobile phase (68–72%), the flow rate (1.8–2.2 mL/min), and the column temperature (23–27 °C). Table S3 details the experimental matrix and resulting system suitability data. Statistical analysis (ANOVA) revealed significant main and interaction effects (p < 0.05) on all CQAs, as shown in Tables S3 and S4. The acetonitrile content strongly influences both the retention time and resolution, whereas the flow rate and temperature affect the plate count and peak symmetry.
The center point condition (70% acetonitrile, 2.0 mL/min, 25 °C) Yielded optimal results, with a retention time of 4.38 min, resolution of 2.41, tailing factor of 1.12, and theoretical plate count of 8956. These results confirmed that all the CQAs were met and that the method performed consistently within the defined design space.
By adopting a QbD approach, this study ensured that all critical factors affecting method performance (particularly those relevant to stability testing) were identified, statistically evaluated, and controlled. Thus, the final method was selected on the basis of data-driven optimization, making it inherently robust, reproducible, and stable.
Forced Degradation StudiesStress testing was performed to evaluate the stability-indicating capabilities of the developed HPLC protocol and to characterize potential degradation pathways of domiphen bromide under various environmental stressors. All forced degradation studies were conducted with Domiphen bromide at a concentration of 100 µg/mL, which represents the standard analytical concentration used for method validation and routine analysis. The degradation profile results are summarized in Table 2, with representative chromatograms presented in Figs. 4A-F. Successful mass balance recovery (95–105% total recovery for all stress conditions, mentioned in Sect. 2.4.8) further confirms the integrity of the experimental setup, including the suitability of the glassware and procedures used during thermal stress, as no significant loss indicative of container failure was observed.
Table 2 Forced degradation results of Domiphen bromide under various stress conditionsThe mass balance recovery was calculated as follows:
$$\begin \:Mass\:balance\:recovery\:\left(\%\right)\\=\frac^}concentration\:of\:degradation\:products}\\\times\:100 \end$$
The values within 95–105% confirm the method accuracy and sample integrity during stress testing.
Fig. 4
Overlay chromatograms showing forced degradation profiles of domiphen bromide under different stress conditions, including acidic (1 N HCl), basic (0.5 N NaOH), oxidative (30% H₂O₂), thermal, photolytic, and neutral hydrolysis conditions
Influence of Formulation Excipients on Degradation ProfileThe potential catalytic or protective effects of Maalox® excipients on DB degradation were investigated through comparative forced degradation (Table 3). Degradation was nearly identical between pure DB (26.72%) and DB in Maalox® (25.83%; Δ = −0.89%) during base hydrolysis (0.5 N NaOH, 80 °C, 1 h). However, minimal differences in oxidative stress (30% H₂O₂, RT, 6 h) were observed (pure DB: 15.23%; Maalox®: 15.90%; Δ = +0.67%). Consistent degradation (pure DB: 18.45%; Maalox®: 17.60%; Δ = −0.85%) was observed during acid hydrolysis (1 N HCl, 80 °C, 2 h). Negligible variation (pure DB: 8.64%; Maalox®: 8.71%; Δ = +0.07%) was observed during thermal stress (80 °C, 24 h). The placebo controls confirmed that no excipient-derived peaks coeluted with DB or its degradation products across all the conditions. The aluminum/magnesium ions in Maalox® had no catalytic effect on hydrolysis. Statistical analysis confirmed no significant difference (p > 0.05, t test) between the degradation rates of pure DB and formulated DB across all the stressors. These results demonstrate that Maalox® excipients do not meaningfully alter DB degradation pathways or kinetics, validating the extrapolation of pure drug degradation behavior to commercial formulations.
Table 3 Comparative degradation of pure DB vs. DB in Maalox® oral suspensionAnalysis of Commercial ProductsThe validated HPLC method was applied to quantify the Domiphen bromide (DB) content in Maalox® oral suspensions across three commercial batches. The results were calculated on the basis of the ratio of sample area to standard peak area and expressed as a percentage of the labeled claim. Statistical analysis via one-way ANOVA revealed no significant variation in DB content among batches (F (2,6) = 0.82, p = 0.480), indicating batch-to-batch consistency, as shown in Table 4a. The individual assay values and means ± SDs are summarized in Table 4b.
Table 4 [Note: This data is mandatory. Please provide]These results demonstrate that the Domiphen bromide content in Maalox® oral suspensions is consistent across different production batches, further validating the applicability and robustness of the developed method for commercial quality control.
Solution StabilityBoth the standard and sample solutions were stable for 24 h at 25 °C (recovery: 98.5–101.2%) and 48 h at 4 °C (recovery: 98.8–101.0%). No significant degradation or peak alterations were observed (Table 5). This confirms that the prepared solutions can be used within 24 h at room temperature or after 48 h of refrigeration.
Table 5 Solution stability of Domiphen bromideInterpretation of Degradation Pathways and Product ImplicationsTo evaluate the stability-indicating capability of the developed method and gain mechanistic insight, forced degradation studies were conducted under various stress conditions. Stressor concentrations and durations were optimized through preliminary kinetic studies to achieve 10–30% degradation while preventing secondary degradation: base hydrolysis required milder conditions (0.5 N NaOH, 1 h) to avoid > 30% degradation (vs. 42.1% with 1 N NaOH in preliminary trials; Supplementary Table S8), whereas acid hydrolysis needed harsher treatment (1 N HCl, 2 h) to compensate for slower kinetics (9.3% degradation with 0.5 N HCl). Room-temperature hydrolysis was excluded because of negligible degradation (< 2% over 72 h; Supplementary Table S9). This condition optimization aligns with QbD principles from chromatographic development (Supplementary Tables S2-S4). Domiphen bromide exhibited the highest degradation under basic (26.72%), acidic (18.45%), and oxidative (15.23%) conditions but demonstrated greater stability under thermal (8.64%), photolytic (5.38%), and neutral (0.15%) conditions, as summarized in Table 6.
Table 6 Proposed degradation pathways and structural vulnerabilities of Domiphen bromideThese observations in Table 6 align with the structural features of Domiphen bromide. The ester group, located in the side chain, is highly susceptible to hydrolysis, particularly under alkaline conditions, due to nucleophilic attack by hydroxide ions. Acid-catalyzed hydrolysis follows a similar mechanism but proceeds more slowly. Oxidative degradation likely results from radical-mediated attack on the electron-rich aromatic ring, forming hydroxylated or quinonoid intermediates. Minimal degradation under thermal and photolytic conditions suggests relative stability of the core structure, although minor decomposition may involve bond cleavage in side chains or photooxidation of the chromophore.
The method effectively resolved Domiphen bromide from its degradation products under all the tested conditions, confirming its specificity and stability-indicating power. While this study did not confirm the degradation product structures, the proposed pathways are consistent with known reactivity patterns of ester-containing quaternary ammonium compounds. Future studies employing LC‒MS or NMR are recommended to characterize the degradants definitively.
While this study confirms chromatographic resolution of degradation products through distinct retention times (e.g., Rt 3.12 min under oxidative stress), structural identification of key DPs such as p-bromodomiphen [21] requires advanced hyphenated techniques. Planned LC‒MS/MS studies characterize m/z profiles and fragmentation patterns, while in silico toxicity assessment, including hERG inhibition risk via molecular docking, can be used to evaluate the cardiotoxicity potential. These investigations, following methodologies demonstrated for structurally similar compounds [39], will complete the stability profile of DB and guide formulation safeguards against high-risk degradants. From a formulation perspective, these findings underscore the importance of pH control (targeting ≤ 6.0) to limit ester hydrolysis, the incorporation of antioxidants to reduce oxidative degradation, and the use of protective packaging, including amber glass and airtight containers, to prevent photolytic and oxidative damage. These insights inform not only analytical development but also the design and storage of Domiphen bromide-containing pharmaceutical products.
Assessment of the Greenness and Whiteness of the RP-HPLC MethodGreen chemistry aims to design chemical processes and products that minimize environmental impact by reducing the use of hazardous substances, decreasing waste, conserving energy, and improving overall sustainability. These principles extend to analytical chemistry through green analytical chemistry (GAC) and white analytical chemistry (WAC), which integrate environmental friendliness (greenness), analytical performance (blueness), and practical functionality (whiteness) [30]. To evaluate the environmental and analytical merits of the developed RP-HPLC method, several modern and validated assessment tools, including NEMI, AGREEprep, MoGAPI, BAGI, and RGB12, were employed. These models provide a comprehensive and quantitative evaluation of the method’s sustainability profile. The solvent sustainability trade-offs were explicitly considered in the greenness evaluation. Acetonitrile (ACN), although classified as flammable (GHS02) or toxic (GHS07), scored positively in NEMI because of its pH compatibility and non-PBT (persistent, bioaccumulative, and toxic) status. The hydrochloric acid (HClO₄) used at a low concentration (0.0116 M) did not meet the threshold for classification as a hazardous reagent in NEMI but still allowed effective ion-pair-free analysis. A major improvement was the replacement of chloroform/hexane with an ethanol-water (1:1) diluent, leading to the elimination of approximately 3.2 L/year of halogenated solvent waste. Additionally, the optimized 6-minute runtime significantly reduced energy consumption by 60% compared with conventional methods exceeding 15 min, further enhancing the method’s overall sustainability.
NEMI (National Environmental Methods Index)Among the earliest GAC metrics is the NEMI metric [40,41,42]. It is utilized to evaluate how our analytical approach can affect the environment and eco-systems. As one of the first greenness metric systems, NEMI offers many advantages, as this study successfully developed and validated it. Its pictogram is a circle with four segments, each of which represents a distinct criterion. When the criterion value is satisfied, the corresponding field of the NEMI pictogram is labeled with the color green (Fig. 5). For this method, all four quadrants are green because the mobile phase pH (approximately 4.1 after mixing) falls within the acceptable range of 2–12. Additionally, no persistent, bioaccumulative, or toxic (PBT) chemicals are used, perchloric acid is present at a concentration below 1% w/v, and no metal-containing reagents are involved. The complete NEMI scoring matrix, along with detailed justifications for each criterion, is provided in Supplementary Table S5.
Fig. 5
The environmentally friendly metric NEMI grade for the novel approach
AGREEprep (Analytical GREEnness metric for Sample PREParation)In accordance with the GSP principles, AGREEprep thoroughly evaluates the greenness of sample preparation procedures [43]. The aspects of sample preparation include the sample preparation site, safety of solvents, sustainability of materials, waste minimization, integration and automation of steps, reduction in sample volume, maximization of sample throughput, reduction in energy consumption, selection of environmentally friendly configurations for sample postpreparation, and operator safety. Figure 6 shows a pictogram of AGREEprep. The 10 principles of GSP are converted into a 0.00–1.00 scale. Moreover, the final score of this GAC metric is calculated (0.66) on the basis of the evaluation of all 10 GSP principles.
Fig. 6
The environmentally friendly metric AGREEprep. grade for the novel approach
MoGAPI (Modular Green analytical procedure index)The MoGAPI method [44] is used to quantify and assess the environmental impact of our method. The analytical process, including sample preparation, volume, health risks associated with solvents and reagents, instrumentation, waste quantity, handling, etc.,etc., is evaluated. Green indicates minimal environmental impact, whereas yellow and red indicate medium and heavy environmental impacts, respectively [45,46,47]. The MoGAPI program combines the accurate overall score of the analytical Eco Scale with the benefits of GAPI’s visual effect (Fig. 7).
Fig. 7
The environmentally friendly metric MoGAPI grade for the novel approach
BAGI (Bioanalytical Greenness Index)To assess the blueness of our suggested method, we used the BAGI tool in our study [48] Ten useful criteria, such as evaluation type, total number of analytes, equipment demands, sample efficiency, prepared sample needs, analysis percentage, reagents/materials used, preliminary concentration needs, automation perspective, and sample volume, can be quantitatively evaluated for blueness via the BAGI tool. The approximate mean of these scores is used to calculate the composite BAGI index. As shown in Fig. 8, our method achieved remarkable BAGI rankings of 70.0, demonstrating its exceptional practical applicability and high capabilities, as shown in Supplementary Table S6, which shows the complete BAGI scoring matrix.
Fig. 8
The environmentally friendly metric BAGI grade for the novel approach
RGB12 Model (White Analytical Chemistry Assessment)The RGB12 algorithm is used to combine the scores for each of the three color groups to estimate the whiteness value, which indicates how closely the procedure adheres to the guidelines of White Analytical Chemistry (WAC) [49,50,51]. Figure 9 demonstrated that the recommended procedures resulted in a whiteness value of 73.0 for the proposed approach. The detailed RGB12 scoring matrix, including all greenness, blueness, and whiteness criteria, is provided in Supplementary Table S7.
Fig. 9
The environmentally friendly metric RGB12 grade for the novel approach
Comparative Methodological AdvancementsA comprehensive comparison against literature (Table 7) demonstrates this method’s unique advantages in terms of stability-indicating capability, sustainability, and practicality for pharmaceutical quality control.
Table 7 Analytical advancements over existing literature
Comments (0)