
Remember me


The synthesis scheme and 1H-NMR spectra of compounds (3), (4) and (5) are in Scheme 1 and Fig. 1. The spectrum of compound (3) exhibits a singlet at 8.76 ppm, characteristic of the proton from the imino group (proton 8), and two singlets at 12.94 and 9.14 ppm corresponding to the hydroxyl groups (protons 10 and 9, respectively). At 4.98 ppm, a broad signal is observed, attributed to the protons of the amino group (protons 11). In the aromatic region, various protons show. The compound (4) spectrum exhibits five broad signals in the aromatic region, corresponding to protons 1–7. The width of the signals is due to the presence of the Ru3⁺ ion. No signals are observed for the hydroxyl or amino groups.
Fig. 1
1H-NMR of compounds (3) red, (4) green and (5) blue
The compound (5) spectrum shows a singlet at 5.55 ppm, characteristic of the methylene group (protons 12). In the aromatic region, the protons are observed, while no signals appear for the hydroxyl groups. The protons of the hydroxyl and amino groups in compounds (4) and (5) are not observed due to coordination with the metals Ru3+ and La3+, which facilitates exchange with deuterium. In the section on quantum mechanical calculations, various structures for compound (5) are explored, concluding that these species correspond to the most stable.
The structures shown in Fig. 1 for compounds (4) and (5) are based on the coordination modes commonly reported for compounds derived from benzimidazoles, where the imine nitrogen is the primary coordination site. The synthesis techniques of the benzimidazolic coordination compounds shown in Table require heating under reflux for two to ten hours in ethanol as a solvent in many cases, yielding substituted benzimidazoles at position 1 in all cases. Table 1 presents the reported structures for benzimidazoles coordinated to Ru2+, Ru3+, Zn2+, and La3+. These compounds are mainly used for biological applications, such as anticancer agents. The metal complexes bind to one or two benzimidazoles, depending on the molar ratio [23,24,25,26,27,28,29,30,31,32,33]. Considering the classical synthesis methods, the synthesis method employed in this work, using a Monowave for 10 min, is particularly appealing.
Table 1 The coordination modes commonly reported for compounds derived from benzimidazoles [23,24,25,26,27,28,29,30,31,32,33]Some reported and proposed structures for Ru3+, Ru2+, Zn2+, and La3+ compounds. Compounds containing Ru3+ are notable for coordinating with a single benzimidazole and a solvent molecule from the medium to achieve an octahedral geometry. For lanthanum, the reported compounds exhibit a coordination number of eight.
3.2 FTIR analysisThe infrared spectra of compounds (3), (4), and (5) are in Fig. S1.
The spectrum of (3) shows characteristic vibrations of functional groups such as NH2 3393 cm−1 (symmetric) and 3314 cm−1 (antisymmetric), aromatic C-H 3035 cm−1, the signal in 1615 cm−1 corresponds to N–H (bending), those in the range of 1600–1570 cm−1 correspond to C = N, that from 1485 to 1457 cm−1 correspond to the C-N groups, finally, the bands observed from 1068 to 733 cm−1 correspond to C-H groups. The N–H (NH2) band at 1615 cm−1 is an intense band indicating the presence of the primary amine.
Compound (4) shows signals in the range of 3540–2800 cm−1 assigned to the N–H group, the vibrations of C = N and C-N are in the range of 1625–1590 cm−1 and 1470–1450 cm−1, respectively, the bands from 1300 to 1050 cm−1 and 886–746 cm−1 corresponding to the C-H vibrations. The band for primary amines is not present.
Compound (5) does not show signals corresponding to N–H groups, thus suggesting the absence of these functional groups due to the formation of disubstituted benzimidazole; the band in the 3372 cm−1 (stretching) corresponds to the tertiary nitrogen of benzimidazole ring [31], the vibration of C = N appears in the range of 1618–1590 cm−1, the vibration of C-N it appears in 1469–1452 cm−1, the bands in the range of 1292-1173 cm−1 and 876–742 cm−1 corresponding to the C-H groups.
3.3 UV–vis absorption, emission and excitation spectroscopyWe recorded the absorption (diffuse reflectance UV–Vis), emission, and excitation spectra of the three synthesised compounds at room temperature. All compounds absorbed electromagnetic radiation from 200 to 900 nm (Fig. 2). The absorption intensity was highest for compounds (3) and (5) in the 200 nm to 500 nm range, while compound (4) exhibited nearly uniform absorption across the entire spectrum from 200 to 900 nm. We conducted emission experiments irradiating at λex 250 nm, revealing emission maxima between 550 and 630 nm and an intense band at 825 nm observable in all three compounds. Excitation experiments at an emission wavelength of λem 825 nm showed excitation bands ranging from 200 to 500 nm, with the highest intensity at 200 nm.
Fig. 2
UV–Vis Absorption (lines), Excitation λem 825 nm (lines and points) and Emission λex 250 nm (solid) spectra by diffuse reflectance for compounds (3) red, (4) green, and (5) blue. + , the emission intensity increases and corresponds to metal-to-ligand transfer (M→L), -, the emission intensity decreases and corresponds to ligand-to-metal transfer (L→M), and = no changes, without transfer
In the 200 nm to 500 nm region, electronic transitions of the type n → π* and π → π* occur primarily, including the OH, NH2, NH, C = N, and C = C groups; hence, the observed emissions mainly correspond to the π* → n and π* → π transitions.
The absorption and emission spectra overlap from 500 to 850 nm, indicating the presence of Förster Resonance Energy Transfer (FRET), a phenomenon observed in organic semiconductors [32]. It is possible to observe energy transfer from metal-to-ligand (M → L) and ligand-to-metal (L → M) when comparing the emission spectra of compounds (4) and (5) with that of compound (3). An increase in the intensity of an emission band indicates an M → L energy transfer, whereas a decrease suggests an L → M transfer. Figure 3 shows the leading bands exhibiting this phenomenon. The " + " symbol indicates an intensity emission increase and, therefore, M → L transfer. The "-" symbol indicates a decrease in emission intensity and an L → M transfer. The symbol " = " indicates no changes in emission intensity and, consequently, no energy transfer.
Fig. 3
Schematic representation of the antenna effect. NRT (Non-Radiative-Transfer), EnT (Energy-Transfer)
Compound (4), containing d5 Ru3+, shows an increase in the band's intensity located around 556 nm, indicating an M → L energy transfer. The intensity decrease of the band at 620 nm suggests an L → M transfer. Additionally, the intensities of the three bands at 739, 757, and 810 nm increase, thus corresponding to M → L transfers. Under the experimental conditions, the expected d-d electronic transitions for the Ru3+ d5 do not show [33].
Compound (5), containing La3+ d0, shows a decrease in the intensity of bands observed at 556, 566, 588, 620, 629, 739, 757 and 810 nm, indicating that the metal ion quenches the ligand's emission. These energy transfers are of the L → M nature. The La3+ ion does not possess valence electrons to share with the organic moiety, so the energy transferred is always from the organic part to the metal. In contrast to the Ru3+ d5 species, which can donate and accept electrons, the La3+ d0 ion can only receive.
The emission band intensity depends on the probability that the electron may remain in the excited state or be transferred to the metal-d-orbitals and then decay to the ground state. In Fig. 2, the change in signal intensity is particularly evident in the emission spectra of the studied compounds, showing increases in intensity for the Ru3+ species and decreases for the La3+ species. It is possible to explain this observation by a proposed Jablonski diagram (Fig. 3). For compound (3), the ground states E0 and excited states E1 are represented; upon irradiation, electrons in E0 transition to E1, from where they are emitted at different wavelengths of varying intensities. Compound (4) undergoes M → L and L → M transfers, which are depicted in the diagram, increasing or decreasing the probability of emissions originating from the ligand. Compound (5) exclusively undergoes L → M transfers because the La3+ species (d⁰) has no valence electrons, reducing the likelihood of observing emissions from the organic species since the electrons move to the La3+ orbitals. Furthermore, the d-d transitions resulting from the L → M transfer may occur at such low energy levels that they dissipate as heat. Energy transfer from ligand to metal is known as the antenna effect and is characteristic of π-conjugated organic systems coupled with d or f-block metals [34, 35].
3.4 Estimation of the band gap using the tauc methodWe utilised the absorption spectra of compounds (3), (4), and (5) to estimate the optical band gap using the Tauc method for direct transitions (Fig. 4). The estimated values indicate the semiconductor nature of the three compounds.
Fig. 4
Tauc Plots compounds (3) red, (4) green, and (5) blue, Tauc Segment (TS), Base Line (BL), Principal Absorption (PA), Secondary Absorption (SA), Tauc Line (TL)
Amorphous materials or those with multiple phases can exhibit various band gap energy (Eg) values, therefore, it is a challenge to estimate the primary Eg value since there is no defined absorption band. In such cases, it is possible to determine each value by identifying the Tauc segment (TS), the baseline (BL), the principal absorption (PA), and the secondary absorption (SA). The intersection between TS and LB corresponds to the main Tauc line (TL), whose value corresponds to the Eg by direct extrapolation. The intersection between PA and SA corresponds to a secondary Eg value [36]. The estimated Eg value for compound (3) was 2.740 eV, obtained from the intersection between the TS and BL lines. Compounds (4) and (5) exhibit two Eg values derived from the TS-BL and PA-SA intersections. The Eg value obtained from TS-BL is 2.753 eV in both cases, indicating a slight increase in the primary Eg value. The Eg values obtained from PA-SA are 2.690 and 2.686 eV, respectively, suggesting that the presence of metals can produce secondary Eg values with lower energy.
3.5 EPR spectroscopyAll EPR spectra were obtained at room temperature (22 °C) in the solid state. Compound (3), being of an organic nature, exhibited no signals. The compound (4) spectrum displayed a broad anisotropic signal with a g-value of 2.292, characteristic of the Ru3+ d5 species due to its significant spin–orbit coupling [37]. A lower intensity signal was also observed at a g-value of 2.0028 (ΔBp-p = 10 G), indicating an organic radical without any observable splitting.
Furthermore, the spectrum of compound (5), containing the diamagnetic La3+ d0 species, exhibited a signal at a g-value of 2.0026 (ΔBp-p = 14 G), typical of an organic radical with slight hyperfine coupling. This finding aligns with existing literature concerning the lanthanum ion's ability to stabilise radicals [16].
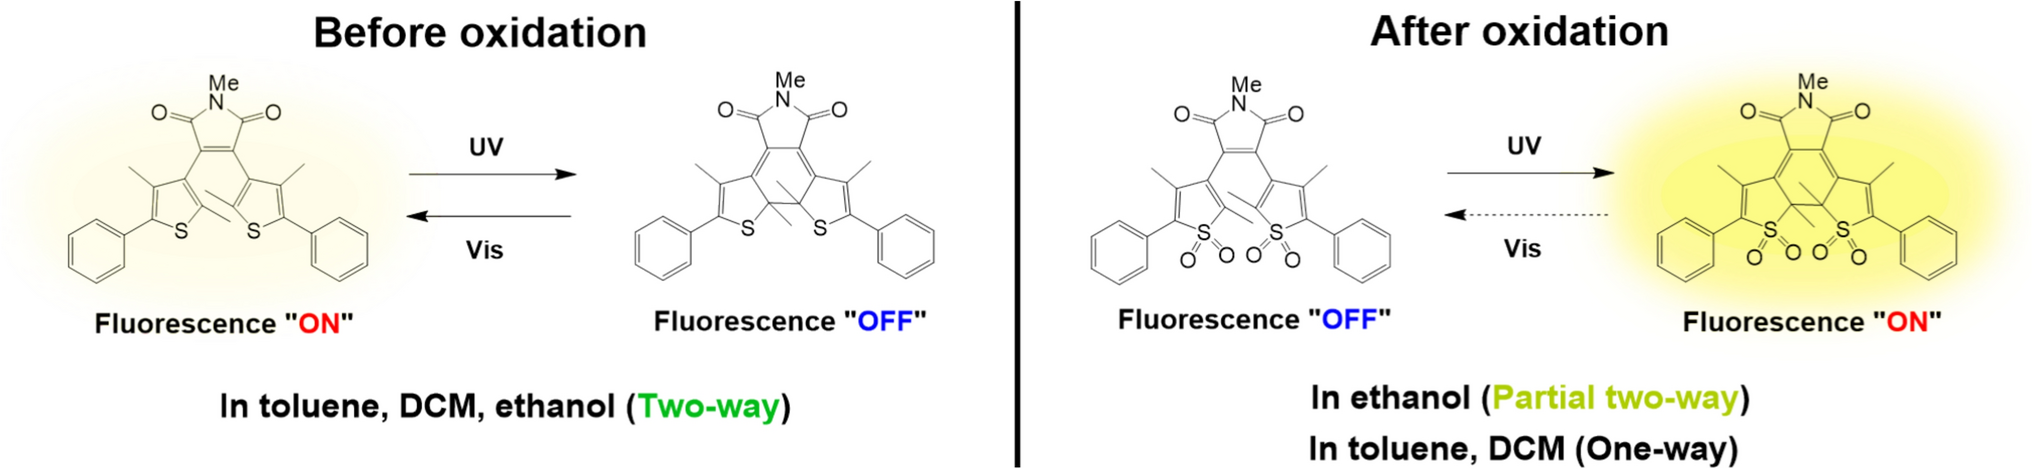
As depicted in Fig. 5, compound (3) did not display any signal until its subsequent conversion to the benzimidazole, coupled with the presence of the metal ions Ru3+ and La3+, which facilitated the stabilisation of an organic radical in compounds (4) and (5). Although there is evidence of photoinduced radical formation [38], no changes were observed in the experiments conducted by directly irradiating the samples with a white light source (40 W).
Fig. 5
Solid-state EPR Spectra of (3) red, (4) green and (5) blue
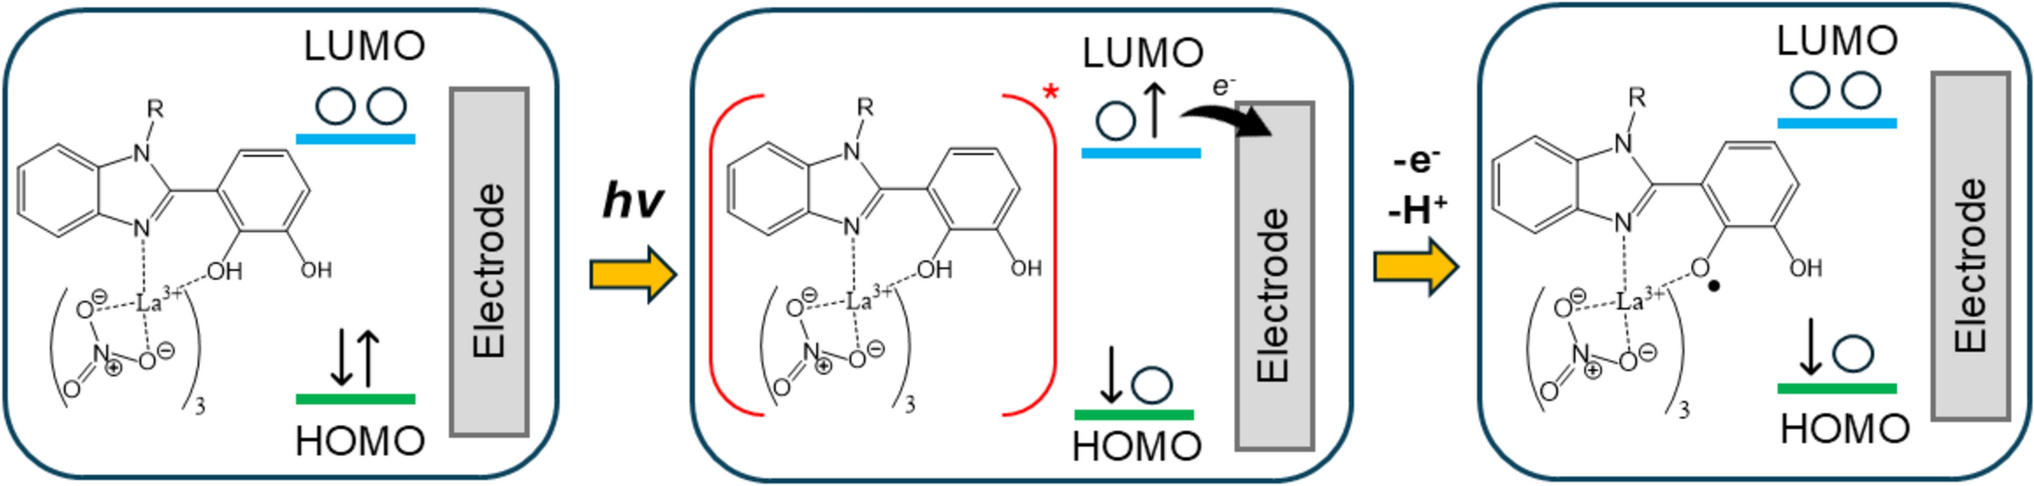
3.6 Photocatalytic activity by electrochemistryAll experiments were conducted at room temperature in a 10 mL electrochemical cell using 5 mL of analyte solutions. The analytes were dissolved in DMF at a concentration of 1 × 10⁻¹ M, with 1 × 10⁻² M PTBA as a supporting electrolyte [39]. The scan rate was set at 500 mV/min, and measurements were performed under dark and illuminated (10 W) conditions (Fig. S2). Figure 6 illustrates the electrochemical behaviour of compounds (3), (4), and (5). Compound (3) exhibits distinct oxidation signals under light and dark conditions. An oxidation signal is observed in the dark at Ep = 8.0 mV with Ip = 2.87 mA. When the experiment is conducted under light conditions, a second oxidation signal appears at E2'p = 5.4 mV with I2'p = 6.34 × 10⁻1 mA, while the original signal shifts to E'p = 8.5 mV with I'p = 3.16 mA. The observed behaviour is characteristic of oxidative redox catalytic systems in which two electrons are transferred to the electrode, as shown in Scheme 2.
Fig. 6
Cyclic voltammetry of compounds (3) red, (4) green, and (5) blue, 5 mL of 1 × 10⁻¹ M in DMF at a scan rate of 500 mV/min. Experiments were carried out under dark conditions, purple, light conditions (using a 10 W lamp), orange and without analytes, black
Scheme 2
Consecutive oxidations took place at the electrode
It is important to note that species B is unstable, and the oxidation rate of B is faster than that of A. Therefore, only one signal is observed under dark conditions at Ep = 8.0 mV, corresponding to B oxidation. The oxidation signal of A becomes defined upon light irradiation, showing a second peak at E2'p = 5.4 mV. Additionally, if consecutive cycles are performed under dark conditions, the intensity of the oxidation signal decreases with each cycle. Conversely, if cycles are performed under light conditions, the intensity of the oxidation signals increases with each cycle. Scheme 3 depicts the possible oxidations for compound (3).
Scheme 3
Possible oxidations at the electrode result in radical products
Convergence is observed in the oxidation and reduction signals at E = 6.7 mV with I = 9.81 × 10⁻¹ mA, a phenomenon observed in systems with unstable intermediates [30,31,32,33,34,35,36,37,38,39,40,41].
Compound (4) exhibits a reduction signal under light and dark conditions. A reduction signal shows in the dark at Ep = -8.1 mV with Ip = -2.15 mA. In the experiment under light, the signal appears at E'p = -8.4 mV with I'p = -2.71 mA. The observed behavior is characteristic of systems with reductive redox catalysis; this observation is attributed to the reduction of the organic ligand (Scheme 4), likely due to the metal-to-ligand energy transfer M → L phenomenon, which hinders the oxidation of the organic ligand but facilitates its reduction.
Scheme 4
Possible reduction of compound (4)
Compound (5) exhibits oxidation signals under both conditions. In the dark, one sees two oxidation signals: the first at E1p = 0.55 mV with I1p = 5.08 × 10⁻1 mA and the second at E2p = 7.9 mV with I2p = 3.07 mA. When the experiment is under light, the first signal shifts to E1'p = 5.3 mV with I1'p = 7.83 × 10⁻1 mA, while the second signal appears at E2'p = 8.1 mV with I2'p = 4.51 mA. The observed behaviour corresponds to oxidative redox catalytic systems with two-electron transfer to the electrode (Scheme 5). The change in the shape of the voltammogram is characteristic of systems with low substrate consumption and rapid electron transfer between the catalytic species and the electrode, resembling an S-shaped voltammogram [42]. When consecutive cycles are performed in the dark, the intensity of the oxidation signal decreases, while under light conditions, the intensity of the oxidation signal increases.
Scheme 5
Consecutive oxidations for compound (5)
From the previous results, we conclude that the organic compound (3) undergoes a catalytic oxidation process when irradiated with light. Compound (4), containing the Ru3+ d5 species, exhibited reductive catalysis upon irradiation and no catalytic oxidation signal on the ligand. Compound (5), containing La3+ d⁰ species, showed the highest catalytic activity when irradiated. This behaviour can be attributed to L → M transfer, which facilitates the oxidation of the organic moiety.
Previous electrochemical studies on phenanthrene semiquinone coordination compounds suggested that the electrochemical activity primarily arises from the oxidation or reduction of the organic ligand, independently of the metal centre [43]. Electrochemical studies conducted on some benzimidazoles and their ruthenium(II) compounds mainly explore their biological activity [44, 45], whereas studies involving lanthanum derivatives are scarce [46]. Previous studies on ruthenium benzimidazolic complexes do not investigate the effect of light on electrochemical behaviour [13]. Our results demonstrate that the metal centre in the complex can significantly enhance electrochemical photocatalytic properties.
3.7 Morphological characterisation by scanning electron microscopy and energy dispersive x-ray spectroscopy (SEM–EDS)SEM–EDS studies were done to learn about the morphology of the coordination compounds with Ru3+ and La3+ ions and the surface chemical composition. Figure 7 shows the SEM image of compound (4), revealing a semicrystalline material with defined edges in most particles. The EDS analysis shows electronic transitions from the K shell (n = 1) for the elements C, O, N, and Cl, while for Ru, L-type transitions (n = 2) appear.
Fig. 7
SEM image of compound (4) in grey and EDS elements surface distribution, carbon in red, oxygen in green, nitrogen in orange, chlorine in purple and ruthenium yellow
Figure 8 shows the SEM image of compound (5), revealing an amorphous material with irregular edges in the observed particles. The EDS analysis shows electronic transitions from the K shell (n = 1) for the elements C, O, and N, while for La, L-type transitions (n = 2) are observed [
Comments (0)