
Remember me


We recruited 10 recreationally active (≥ 3 endurance-based exercise sessions per week, V̇O2max ≥ 40 mL·kg−1·min−1), healthy, non-smoking males. One participant was excluded from the final analysis due to technical problems (error in provision of experimental drinks, discovered retrospectively upon blood βHB assessment), with the final dataset including 9 participants (age: 26 ± 5 (means ± SD); height: 1.80 ± 0.07 m; body mass: 80 ± 9 kg; V̇O2max: 47 ± 4 mL·kg−1·min−1). Participants provided written consent, and the study was approved by the local Research Ethics Committee of Liverpool John Moores University (ref. no. H23/SPS/043).
Preliminary testingParticipants completed two preliminary sessions within 1 week before the start of the first condition. During the first visit, subjects performed a maximal incremental exercise test on a bicycle ergometer (Corival CPET, Lode B.V, Groningen, The Netherlands), where the initial workload was set at 125 W, followed by 25-W increments per min, until exhaustion (Bishop et al. 1998). Respiratory gas exchange was measured continuously during the test using a Vyntus™ CPX metabolic cart (Vyaire, Mettawa, Illinois, USA) and the highest oxygen uptake measured over a 30-s period was defined as V̇O2max. During the second session, participants were familiarised with the exercise testing procedure that consisted of 45 min at 60% V̇O2max.
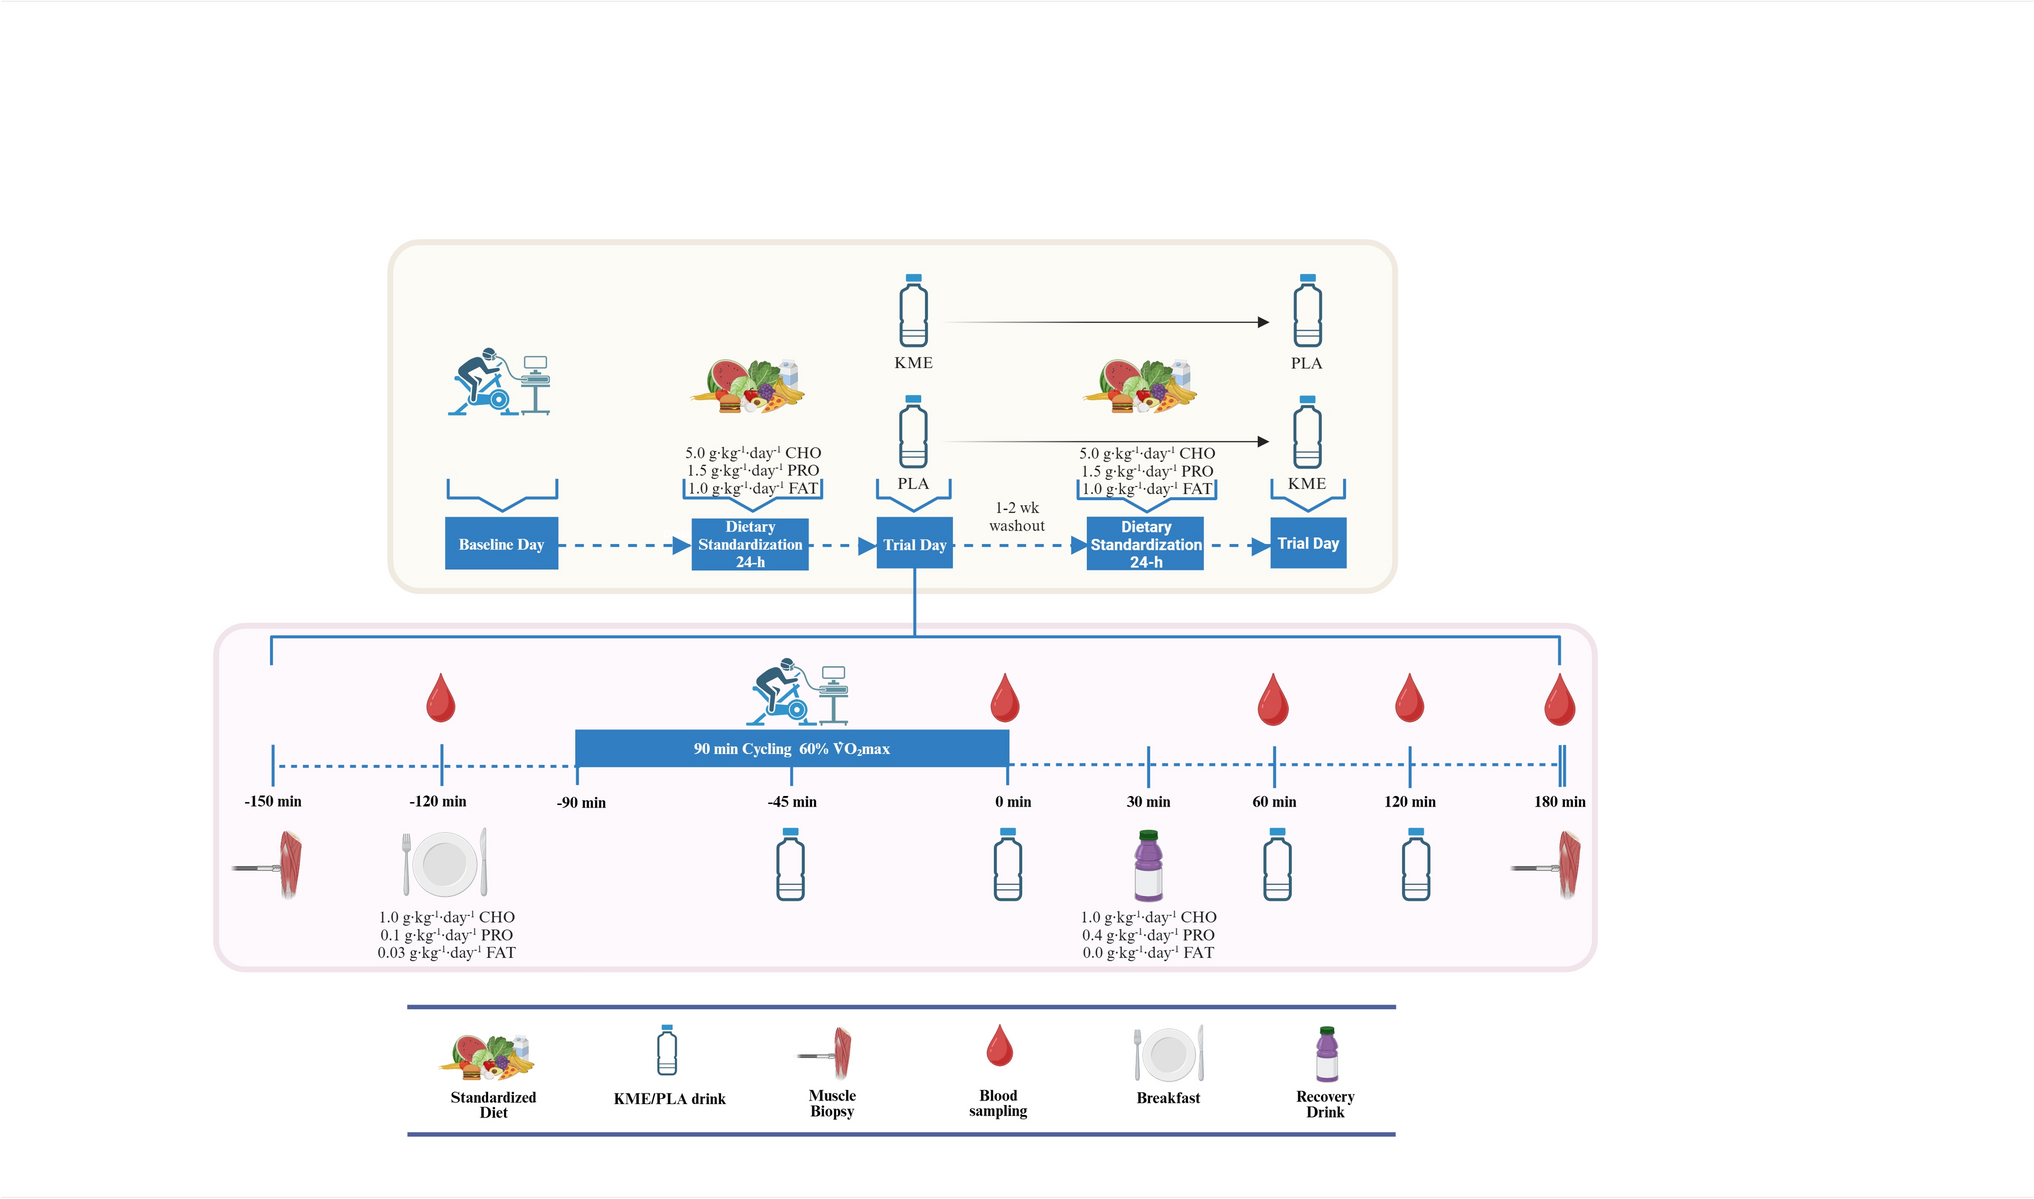
General study designAn overview of the study design is shown in Fig. 1. This randomised, double-blind, placebo-controlled, crossover design study involved two experimental sessions involving two experimental visits, separated by 7–14 days. Each experimental session comprised a 90-min cycling session at 60% V̇O2max. Subjects received either 1.25 g·kg−1 (range: ~ 85–110 g) of KME [> 96% (R)-3-hydroxybutyl (R)-3-hydroxybutyrate] or a volume and taste-matched placebo (PLA) drink. Both drinks were spread in four dosages (0.5 g·kg−1, 0.25 g·kg−1, 0.25 g·kg−1, 0.25 g·kg−1) to be ingested at min 45 of exercise and at 0, 60, and 120 min post-exercise.
Fig. 1
Schematic of the study protocol. The study involved two experimental sessions following a randomised, double-blind, crossover design, with a washout of 7–14 days in between. During each visit, subjects completed a 90-min steady state cycling at 60% V̇O2max. Participants consumed four doses of a KME or PLA drink ingested at min 45 of exercise and at 0, 60, and 120 min post-exercise. Breakfast and post-exercise recovery drink were provided 30 min pre-exercise and 30 min post-exercise, respectively. Venous blood samples were obtained 30 min pre-exercise and throughout the post-exercise recovery period. Muscle samples were obtained 60 min pre-exercise and 180 min post-exercise
Experimental sessionsForty-eight to twenty-four hours before each experimental session, participants were free to follow their usual food intake and exercise habits, and any exercise performed prior to the first trial was recorded and replicated prior to the second trial. Twenty-four hours before each experimental session, subjects were instructed not to consume caffeinated drinks, abstain from exercise or strenuous physical activity, and were provided a custom-made, prepackaged diet containing 5 g·kg−1·day−1 carbohydrate (CHO), 1.5 g·kg−1·day−1 protein (PRO), and 1 g·kg−1·day−1 fat (FAT).
On trial days, participants arrived at the laboratory in the morning (0730 to 0830 h) and venous blood samples were drawn at 30 min pre-exercise and 0, 60, 120, and 180 min post-exercise. Subjects received a standardised breakfast containing 1 g·kg−1 CHO, 0.1 g·kg−1 PRO, and 0.03 g·kg−1 FAT exactly 30 min pre-exercise, and at 30-min post-exercise, participants consumed a recovery drink containing 1 g·kg−1 CHO and 0.4 g·kg−1 PRO. During the exercise, respiratory gas exchange (Vyntus™ CPX metabolic cart, Vyaire, Mettawa, Illinois, USA), heart rate monitor (H10 Polar, Polar Electro Oy, Kempele, Finland), and rating of perceived exertion (RPE, 6–20 scale, (Borg 1982) were also recorded in the last 3 min of every 15 min, and finger-prick blood samples were collected to measure lactate concentrations (Biosen C-Line, EKF Diagnostics, Cardiff, UK).
Ketone and placebo drinksKME drinks were composed of water, KME (TdeltaS Ltd, Thame Oxfordshire, UK), 5% w/v sucralose (MyProtein, Northwich, UK), and 1% v/v strawberry flavour drops (Myprotein, Northwich, UK). PLA drink contained water, bitter sucrose octaacetate (Sigma-Aldrich, Bornem, Belgium), 5% w/v sucralose, and 1% v/v strawberry flavour drops, dissolved and in proportion to water volume. Drinks were provided in opaque bidons, and double-blinding and participant order consumption randomisation of KME and PLA drink was performed by an investigator who was not involved in the study.
Venous blood sampling and analysisAn indwelling cannula was inserted into the antecubital vein of one arm [Becton Dickinson (BD) Nexiva Closed IV Catheter, Becton Dickinson U.K. Limited, Wokingham, UK)], and samples were collected in blood collection tubes (EDTA, lithium heparin and serum, BD Vacutainers, Becton Dickinson U.K. Limited, Wokingham, UK). Tubes were centrifuged (3000 rpm for 10 min at 4 °C), and the supernatant was stored at − 80 °C until later analysis. Serum EPO was assessed in triplicate using commercially available enzyme-linked immunosorbent assay (ELISA, ab274397 Human Erythropoietin SimpleStep ELISA kit, Abcam), whereas serum βHB and glucose were measured in duplicate using the RX Daytona + (Randox Laboratories, Crumlin, UK: assay codes RB1007 GL8319, respectively). EPO intra-assay coefficient of variation was 4.9 ± 2.2%. βHB and glucose intra-assay coefficient of variation were 3.2 ± 4.2% and 1.7 ± 1.8%, respectively.
Muscle biopsySkeletal muscle biopsies were obtained from the vastus lateralis of the quadriceps ~ 60 min pre-exercise and 180 min post-exercise. Each trial day, biopsies were taken from the same leg through different incisions. Anaesthetic (0.5% Marcaine) was applied prior to sampling, and a Conchotome biopsy needle was utilised to obtain muscle samples. Immediately, muscle samples were washed with phosphate buffered saline, and non-muscle material was removed. Muscle samples were instantly snap frozen in liquid nitrogen and stored at −80 °C until further analysis.
Glycogen assayMuscle glycogen concentration was determined according to the acid hydrolysis method using freeze-dried muscle samples that were dissected under the microscope to eliminate impurities of blood and connective tissue (Van Loon et al. 2000; Doering et al. 2019). Glucose concentration was quantified with the hexokinase method using a commercially available kit (GL8319; Randox Laboratories, Crumlin, UK), and glycogen concentration (mmol·kg−1 dry mass) was then calculated. Samples were analysed in duplicate and intra-assay coefficient of variation was 10.0 ± 8.9%.
RNA isolation and RNA sequencingTotal RNA from muscle samples (< 30 mg) was extracted using TRI reagent (Thermo Fisher Scientific, Waltham, MA, USA) and purified using the QIAGEN RNeasy Mini Kit (Qiagen, Hilden, Mettmann, Germany) according to the manufacturer’s instructions. Eluted RNA was stored at −80 °C until required for determination of total RNA and library processing. Total RNA was quantified using a Nanodrop 8000 (Thermo Fisher Scientific, Waltham, MA, USA), and RNA quality was assessed using an Agilent® Bioanalyser (Agilent, Santa Clara, CA, USA) with an average RIN score = 7.9, 260/280 = 2.01. RNA samples were then diluted to 20 ng·μL−1 using RNase-free water.
Libraries were constructed from 100 ng of total RNA with Poly-A tail enrichment of mRNA using NEBNext® Ultra™ II RNA Library Prep Kit for Illumina® with Agencourt AMPureXP Sample Purification Beads (Beckman Coulter. Wycombe, UK) as per manufacturers’ guidelines, by Bart’s and the London Genome Centre at Queen Mary, University of London. The resultant-barcoded libraries were sequenced on an Illumina NextSeq 2000 using 2 × 50 bp paired-end sequencing. An average of 36 million paired-end reads was achieved per sample post-trimming and alignment as described below.
FastQ files were imported to Partek® Flow® Genomic Analysis Software (Partek Inc. Missouri, USA) for pipeline processing. Pre-alignment QA/QC was performed on all reads prior to read trimming (Online Resource 1), before quality score trimming of reads with a Phred-score less than 20. STAR alignment 2.7.8a was then used to align trimmed reads to the human genome (GrCh38). Aligned reads were then quantified to the Ensembl transcriptome annotation model associated with human genome (hg) transcripts release 99. Post-alignment, QC reports are provided in Online Resource 2. Filtered raw counts were used for normalisation and differential analysis with DESeq2 through Partek® Flow® (Love et al. 2014). Gene transcripts were considered significantly different between groups when the false discovery rate (FDR) q < 0.05 and fold change (FC) > 1.5. To ensure robustness to the statistical framework, we additionally analysed the data using lmerseq (Vestal et al. 2022), which implements linear mixed-effects models appropriate for within-subject RNA-seq designs. Volcano plot was generated in R studio (version 2023.06.1 + 524); principal component analysis (PCA) plot was generated in Partek Flow®. Correlation plot was created in GraphPad Prism v10 (GraphPad Software, San Diego, CA). Raw data can be found at the GEO accession GSE292369. Further data will be made available by the corresponding author upon reasonable request.
Statistical analysisWhile the primary outcome of the current study is the global mRNA expression, there are not available data in human trials to base the sample size on this outcome. Statistical analysis of the transcriptomics data was performed as described in the previous paragraph. Other results are expressed as mean ± standard deviation (SD). Normality was tested with the Shapiro–Wilk test; if sphericity was not met, a Greenhouse–Geisser correction was applied. A two-way repeated measures analysis of variance (RM-ANOVA, [2 × 5] for serum βHB, glucose, and EPO; [2 × 2] for muscle glycogen concentration; [2 × 7] for cardiorespiratory, RPE, and substrate utilisation measurements) was utilised. If significant main effects or interactions effects were observed, post hoc testing was used with Bonferroni´s correction, with multiplicity-adjusted P values reported when comparing KME to PLA at respective time points. Significance was considered at P ≤ 0.05, and partial eta square (\(\eta_^\): small effect = < 0.05; moderate effect = 0.05–0.14; large effect = > 0.14) was calculated to provided effect sizes if significant interactions occurred. A paired t-test was used to determine differences in total area under the curve (tAUC, for BHB, glucose, and EPO) (Narang et al. 2020) and deltas of skeletal muscle glycogen. All data were analysed in SPSS v29 (IBM Corp, Armonk, NY, USA). Figures were produced using GraphPad Prism v10 (GraphPad Software, San Diego, CA).
Comments (0)