
Remember me


Sarcopenia occurs in both elderly and adult patients with cancer due to the higher rates of loss in muscle mass and function in older populations (Williams et al., 2021), with a prevalence ranging from 15% to 50% based on cancer type and treatment approach (Peterson & Mozer, 2017). Sarcopenia has been associated with higher risks of death and cancer recurrence (Xia et al., 2020) and has been gaining increased attention from clinical workers. Quality of life (QoL) is an important indicator of the subjective perceptions of patients regarding the impact of their disease and treatments on life. In several studies, cancer patients with sarcopenia have been shown to suffer from relatively worse QoL than their peers without this condition (Besson et al., 2021; Nipp et al., 2018). However, only generic QoL questionnaires, which assess multifactorial QoL and thus may not capture the minor changes that typify sarcopenia-related QoL, were employed in these studies. Thus, there is a need for a sarcopenia-specific tool able to detect the dynamics of sarcopenia-related QoL during treatment and assess the effectiveness of sarcopenia interventions.
The two instruments previously developed to assess QoL specific to sarcopenia in community-dwelling older adults include the Sarcopenia Quality of Life (SarQoL) questionnaire and the short-form SarQoL (SF-SarQoL) questionnaire. The SarQoL was initially developed to assess QoL in older adults with sarcopenia (Beaudart et al., 2015) and detect intervention-related changes in QoL (Witham et al., 2022). The original SarQoL measure has been translated into 30 languages, and more than 10 have subsequently been validated (Le et al., 2021; Yoo et al., 2021). The Chinese version was previously validated on a sample of community-dwelling older adults (Le et al., 2021). Although the SarQoL has been validated with adequate properties, its 55 items may place a considerable burden on patients with cancer, especially those experiencing physical or mental discomfort. The SF-SarQoL questionnaire was developed in 2021 to reduce the burden on participants. Its 14 items were extracted from the SarQoL, and the SF-SarQoL has been validated for use in community-dwelling older adults (Geerinck, Beaudart, et al., 2021). Although the SF-SarQoL has an advantage over the SarQoL due to ease of clinical use, its measurement properties in patients with cancer have yet to be determined. In particular, the sensitivity of this abbreviated scale, which is an important indicator of the dynamics of sarcopenia-related QoL during treatment and interventions, has not yet been examined.
Due to the current need for a high-clinical-utility tool that is adequately sensitive to capture the impact of sarcopenia on QoL, it is more preferable to examine the clinimetric rather than psychometric properties of the SF-SarQoL in the context of patients with cancer. Clinimetrics is an alternative approach to psychometrics for testing measurement properties (Fava et al., 2012). Different from the psychometric approach, clinimetrics focuses on the value of clinical applications. The focus on the homogeneity of components in the psychometric approach may reduce the sensitivity of tools, which is significant to clinical evaluation. Clinimetrics adjusts for the limitations of psychometrics with regard to the clinical applicability of questionnaires and corrects some of the inappropriate property requirements (Fava et al., 2004). For example, with regard to construct validity, clinimetrics is not concerned about the factor structure, which requires homogeneity of components, and rather focuses on scalability, which reflects how much distinctive information each item provides and how well the information provided collectively by the items fits the underlying clinical concept. In addition, clinimetrics focuses more on sensitivity, which refers to the ability of a tool to discriminate among patients with different clinical features and detect changes in interventions. The criteria for clinimetric patient-reported outcome measures (CLIPROM) have been developed to help researchers choose appropriate instruments for use in clinical settings and to guide the process of developing new instruments in clinical practice (Carrozzino et al., 2021).
In light of the above, this study was designed to examine the clinimetric properties of the Chinese SF-SarQoL in patients with colorectal cancer in accordance with CLIPROM criteria, as sarcopenia is prevalent in patients with colorectal cancer (Feliciano et al., 2017). In particular, the sensitivity with which the SF-SarQoL captures changes in sarcopenia-related QoL was examined. It was assumed for the purposes of this article that SF-SarQoL scores in patients change significantly between presurgery and postsurgery.
Methods Participants and Study DesignA longitudinal study design was used, and participants were recruited from the surgery department of a tertiary oncology hospital in East China from July 2020 to December 2021. The inclusion criterion was being a patient with colorectal cancer who was planning to undergo radical colorectal surgery. Otherwise eligible patients with problems communicating were excluded. Four hundred sixteen patients were identified as eligible, 408 of whom provided verbal informed consent.
This study was approved by the Ethics Committee of Shandong University School of Nursing and Rehabilitation (2020-R-066) and conducted in accordance with the ethical principles of Ethics of the World Medical Association (Declaration of Helsinki). The 408 participants completed the questionnaire in a face-to-face setting with a researcher prior to surgery, and 341 participants completed the questionnaire again 1 month after surgery.
Assessment SarcopeniaSarcopenia is defined under the 2019 consensus of the Asian Working Group for Sarcopenia (AWGS) as muscle mass loss accompanied by low muscle strength (low physical performance, low grip strength, or both; Chen et al., 2020). Low physical performance is defined as a 6-m walk < 1.0 m/s and low grip strength of < 28 kg for men and < 18 kg for women. Muscle data were obtained from computed tomography scans of the third lumbar vertebra (L3) performed 1 month before surgery. Muscle mass was computed using an automatic body composition analyzer running the CT Image Segmentation module of SliceOmatic software (Version 5.0; TomoVision, Montreal, Quebec, Canada; Cespedes Feliciano et al., 2020). Skeletal muscle index (SMI) was calculated as the cross-sectional muscle mass divided by the square of the height (m2). The criteria for muscle mass loss were defined according to Prado's criteria (SMI < 53 cm2/m2 for men with body mass index [BMI] > 25, SMI < 43 cm2/m2 for men with BMI < 25, and SMI < 41 cm2/m2 for women).
Short-form version of the Sarcopenia Quality of LifeThe 14-item SF-SarQoL is a short-form version of the SarQoL that is used to assess QoL specifically associated with sarcopenia (Geerinck, Beaudart, et al., 2021). The SF-SarQoL has demonstrated adequate measurement properties. Scale scores are calculated by summing individual item scores, dividing this amount by the number of valid responses, and then normalizing this score to a range between 0 and 100. Similar to the SarQoL, higher total SF-SarQoL scores indicate better QoL.
Sarcopenia Quality of Life questionnaireThe SarQoL is a patient self-report questionnaire developed to assess the QoL in older adults with sarcopenia (Beaudart et al., 2017). This scale contains 55 items across the seven domains of physical and mental health, locomotion, body composition, functionality, activities of daily living, leisure activities, and fears. The total SarQoL score ranges from 0 to 100, with higher scores indicating better QoL. The SarQoL has also been used to assess QoL in frail older adults (Geerinck, Locquet, et al., 2021).
SARC-F questionnaireThe SARC-F questionnaire, developed as a screening tool to identify patients with sarcopenia (Malmstrom & Morley, 2013), contains five items related to physical functions (strength, assistance with walking, rise from a chair, climb stairs, and falls). The total score ranges from 0 to 10, with higher scores indicating poorer condition. The effectiveness of the SARC-F in predicting adverse outcomes related to sarcopenia has been previously demonstrated (Voelker et al., 2021).
Karnofsky performance scaleThe Karnofsky Performance Scale (KPS; Friendlander & Ettinger, 2009) is a commonly used tool for assessing physical functioning in patients with cancer. The KPS total score ranges in 10-point intervals from 0 to 100, which categorize the respondent's physical functioning into 11 levels (e.g., 0 for dead, 100 for no disease). Respondents scoring below 60 are considered unfit for cancer treatment.
Functional assessment of chronic illness therapy-fatigueThe Functional Assessment of Chronic Illness Therapy-Fatigue is a one-dimensional scale used to assess fatigue (Yellen et al., 1997) that has been widely used in China and exhibits high reliability and validity. This scale contains 13 items, with each score ranging from 0 to 4 and a total possible score ranging from 0 to 52. Higher total scores indicate greater fatigue burden.
The global health status/quality of life subscale of the European Organization for Research and Treatment of Cancer quality of life questionnaireThe European Organization for Research and Treatment of Cancer Quality of Life questionnaire (EORTC QLQ-C30) was developed to assess QoL in patients with cancer (Aaronson et al., 1993). This questionnaire contains 15 subscales and 30 items in total. Items 29 and 30 of the EORTC QLQ-C30 assess the respondent's global health status and QoL over the previous week, respectively, and together constitute the global health status/QoL subscale. The score for this subscale, ranging from 0 to 100, is calculated by linearly transforming the mean of the sum of the scores of Items 29 and 30, with higher scores indicating better global health status/QoL. The global health status/QoL subscale of the EORTC QLQ-C30 has been validated with good properties in many countries (El Alami et al., 2021), including China (Wan et al., 2008).
Clinimetric Evaluation and Statistical AnalysisShapiro–Wilk tests were used in this study to examine whether the data conformed to a normal distribution. Because the distribution for the SF-SarQoL score was found not normal, Spearman correlation analyses and Mann–Whitney U tests were performed. In this study, continuous variables are described as means ± standard deviations or medians (25th percentile, 75th percentile), and categorical variables are reported using frequencies and percentages. IBM SPSS Statistics 25.0 (IBM Inc., Armonk, NY, USA), Stata v17.0 (StataCorp, College Station, TX, USA), and R v4.2.1 (R Foundation for Statistical Computing, Vienna, Austria) were used to conduct the statistical analyses. A significance level of 5% was used for all of the tests.
In line with CLIPROM criteria (Carrozzino et al., 2021), we examined reliability (internal consistency), validity (construct validity, concurrent validity), sensitivity (discriminative ability, ability to detect changes), and floor and ceiling effects.
Internal consistencyInternal consistency reflects the extent to which each item on the SF-SarQoL correlates with the others. Cronbach's alpha in combination with McDonald's omega was used to examine internal consistency using SPSS, with values above .7 deemed acceptable (Taber, 2018).
Construct validityAccording to CLIPROM criteria, scalability is the core property of construct validity. Scalability reflects the extent to which each item provides its own clinical information and determines whether the symptoms of these items reflect an underlying clinical syndrome (Carrozzino et al., 2021). Mokken analysis, a nonparametric approach to item response theory, was used to compute the Loevinger's coefficients of homogeneity (Loevinger's H coefficients) for each item and the entire questionnaire. Higher Loevinger's H coefficients are associated with stronger scalability, and in this study, Loevinger's H coefficient values ≥ 0.5 were used to identify strong scalability (Hardouin et al., 2011). Next, item discriminative ability (a) and item thresholds (b) were calculated using a graded response model. Three item thresholds (b1, b2, and b3) were estimated for all scale items with the exception of Item 14, for which only two thresholds could be estimated. The S-χ2 indicator was tested to examine item fit, with p > .001 indicating acceptable fit. Before examining scalability, unidimensionality was tested as a prerequisite for the Mokken analysis and graded response model. Exploratory factor analysis results in which the first component explains more than 20% of the variance and the ratio of eigenvalues between the first and second components is greater than 3 are considered good indicators of unidimensionality (Molenaar, 1997). The Mokken analysis was performed using Stata, and the graded response model was conducted using the “mirt” package of R. Exploratory factor analysis for unidimensionality was conducted using SPSS.
Concurrent validityConcurrent validity refers to the extent to which the SF-SarQoL correlates with the other related questionnaires. Spearman's correlation tests conducted using SPSS were used to estimate the correlation between the SF-SarQoL and the SarQoL as well as that among other questionnaires developed to address muscle function from different aspects (effect size: ρ = 0.10–0.19 as very weak, 0.20–0.39 as weak, 0.40–0.59 as moderate, 0.60–0.79 as strong, and ≥ 0.80 as very strong; Evans, 1996).
SensitivitySensitivity refers to the ability of a scale/questionnaire to respond to interventions or changes over time (ability to detect changes) as well as to discriminate among different groups (discriminative ability).
1. Ability to detect changes: The ability of the SF-SarQoL to detect changes refers to whether a significant difference exits between SF-SarQoL scores before and after treatment. In this study, the patients were evaluated using the SF-SarQoL 1 month after surgery. A Wilcoxon signed rank test performed using SPSS 25.0 was used to determine whether a statistically significant difference was found in the SF-SarQoL scores before and 1 month after surgery. The effect size (Cohen's d) of the change in SF-SarQoL scores before and after surgery was calculated using two equations: SDpooled = √(SD12 + SD22) / 2 and Cohen's d = (M2 − M1) / SDpooled. (Note that SD1 represents the standard deviation of the preoperative SF-SarQoL score, SD2 represents the standard deviation of the postoperative SF-SarQoL score, M1 represents the mean of the preoperative SF-SarQoL score, and M2 represents the mean of the preoperative SF-SarQoL score.) 2. Discriminative ability: Discriminative ability refers to the ability of the SF-SarQoL to discriminate between sarcopenic and nonsarcopenic participants. This aspect of sensitivity was examined using receiver operating characteristic curve (ROC) analyses run under the “pROC” package of R, with the presence of sarcopenia used as the outcome variable and the SF-SarQoL scores used as independent variables. The ROC analysis was performed, and the area under the curve was calculated. Floor/ceiling effectsA floor or ceiling effect was deemed to have been attained when the number of participants with SF-SarQoL scores at the lowest or highest score exceeded 15% of the total.
Results Participant CharacteristicsThe mean age of participants in this study was 60.1 years, with a standard deviation of 11.8 years and ages ranging from 20 to 86 years. There were 238 men (58.3%) and 170 (41.7%) women. A total of 131 (32.1%) and 277 (67.9%) participants had colon and rectal cancers, respectively. Regarding cancer stage, 49 were at Stage 0 (12.0%), 64 were at Stage I (15.7%), 101 were at Stage II (24.8%), 133 were at Stage III (32.6%), and 61 were at Stage IV (15.0%). Nine (2.2%) were receiving neoadjuvant chemotherapy, four (1.0%) were receiving neoadjuvant radiotherapy, and nine (2.2%) were receiving neoadjuvant targeted therapy. Of the 389 patients treated with surgery, 359 received laparoscopic surgery (88.0%) and 30 received open abdominal surgery (7.4%). The mean BMI of the participants was 24.0 ± 3.4, ranging from 14.0 to 38.1. The median (interquartile range) of the Charlson score was 0 (0, 2), ranging from 0 to 13; the median (interquartile range) of the SF-SarQoL score was 90.48 (77.38, 94.05), ranging from 0 to 100; the median (interquartile range) of the SarQoL score was 90.15 (83.80, 93.00), ranging from 25.48 to 98.72; and the median (interquartile range) of the SARC-F was 0 (0.00, 0.00), ranging from 0.00 to 8.00.
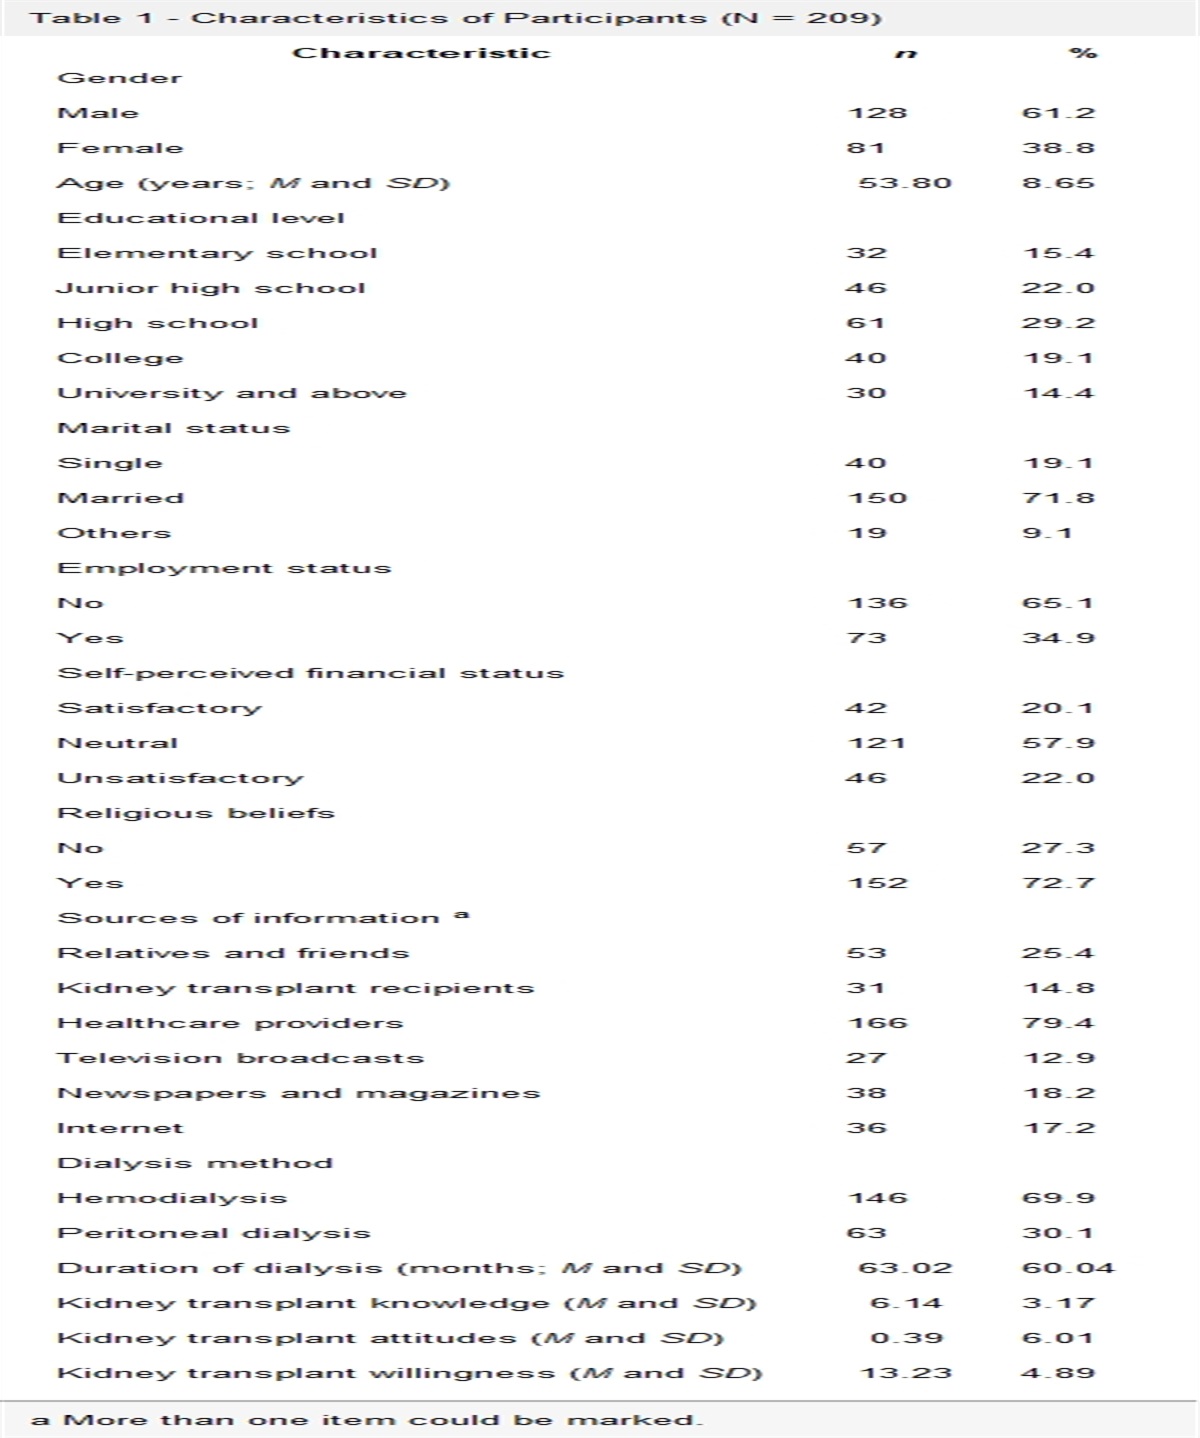
A total of 341 (83.6%) participants completed the second-round (postsurgery) questionnaire, with 40 (9.8%) participants lost due to transfer to another hospital, eight (2.0%) lost due to depression and not wanting to cooperate with the questionnaire interview, and 19 (4.6%) lost due to canceling their intended surgery. Those patients lost to follow-up were more likely to have a diagnosis of rectal cancer and to be at Stage 0 than their peers who completed the second-round questionnaire (see Table 1).
Table 1 - Baseline Characteristic Comparison Between Participants in the Followed-Up and Non-Followed-Up Groups Variable Followed-Up Group (n = 341) Non-Followed-Up Group (n = 67) t/χ2 p n % n % Age (years; M and SD) 59.95 11.45 60.64 13.32 0.395 .693 Gender Male 200 58.7 38 56.7 0.086 .769 Female 141 41.3 29 43.3 Surgery a Laparoscopic 313 92.3 46 76.7 0.001 1.000 Open abdominal 26 7.7 14 23.3 Cancer Colon 117 34.3 14 20.9 4.623 .032 Rectal 224 65.7 53 79.1 Cancer stage Tis (carcinoma in situ) 29 8.5 20 29.9 27.081 < .001 I 53 15.5 11 16.4 II 91 26.7 10 14.9 III 118 34.6 15 22.4 IV 50 14.7 11 16.4 Body mass index (M and SD) 24.01 3.30 24.01 4.15 0.001 1.000 Item Median (25th percentile, 75th percentile) Median (25th percentile, 75th percentile) Z p Charlson score 0.00 (0.00, 2.00) 0.00 (0.00, 1.00) 0.657 .511 SF-SarQoL 91.67 (78.57, 94.05) 87.50 (67.86, 94.05) 1.188 .235Note. SF-SarQoL = short-form version of the Sarcopenia Quality of Life questionnaire.
a Participants had missing data on surgery (n = 9): in the followed-up group (n = 2) and in the non-followed-up group (n = 7).
The internal consistency of the SF-SarQoL was acceptable, with a Cronbach's alpha of .94 and a McDonald's omega of .94.
Construct ValidityExploratory factor analysis with principal component factor extraction was used for the unidimensionality test. The variance percentage of the first extracted component was 59.09% (> 20%). The first component eigenvalue was 8.27, the second component eigenvalue was 1.20 (Table 2), and the ratio of the first component to the second component eigenvalue was 6.923 > 3, satisfying the unidimensionality of the SF-SarQoL.
Table 2 - Principal Component Factor Analysis of the SF-SarQoL Component Eigen value Proportion of Variance Cumulative Proportion of Variance 1 7.33 52.33 52.33 2 1.83 13.06 65.39 3 1.21 8.62 74.01 4 0.70 5.02 79.03 5 0.61 4.37 83.40 6 0.44 3.14 86.54 7 0.38 2.74 89.28 8 0.29 2.10 91.38 9 0.29 2.03 93.42 10 0.24 1.68 95.09 11 0.20 1.42 96.52 12 0.19 1.32 97.84 13 0.18 1.25 99.09 14 0.13 0.91 100.00The results of the Mokken analysis showed both the total score (Loevinger's H coefficient = 0.67) and each item (Loevinger's H coefficient ranged from 0.58 to 0.75) confirmed strong scalability. p Values for the S-χ2 indicator for all of the items were larger than .001, indicating all items were fit for the graded response model. Discriminative ability (a) ranged from 1.62 to 2.31, and item thresholds ranged from 0.01 to 2.25 (Table 3).
Table 3 - Graded Response Model Analysis and Mokken Analysis of the SF-SarQoL Item Mean Score Loevinger's H Coefficient a Model FitThe coefficient of the Spearman correlation showed a strong correlation between the total scores for the SF-SarQoL and SarQoL (rs = .83, p < .001) and moderate to very strong correlations between the SF-SarQoL score and scores for each domain of the SarQoL (rs = .54–.87, p < .001; Table 4).
Table 4 - Spearman Correlation Between SF-SarQoL Total Score and Scores for the SarQoL and Each SarQoL Domain SF-SarQoL Score rs Total SarQoL score .83*** Domain 1: physical and mental health .87*** Domain 2: locomotion .86*** Domain 3: body composition .65*** Domain 4: functionality .79*** Domain 5: activities of daily living .68*** Domain 6: leisure activities .54*** Domain 7: fears .54***The SF-SarQoL score was found to correlate weakly with the SARC-F score (rs = −.32, p < .001), moderately with the Functional Assessment of Chronic Illness Therapy-Fatigue (rs = −.60, p < .001) and EORTC QLQ-C30 global health status/QoL (rs = .49, p < .001) scores, and strongly with the KPS score (rs = .66, p < .001).
Sensitivity Ability to detect changesThe 341 participants who completed the postsurgery questionnaire scored an average of 91.67 (78.57, 94.05) preoperatively and 79.76 (55.05, 91.67) postoperatively on the SF-SarQoL. The difference in SF-SarQoL scores before and after surgery was statistically significant (Z = 8.19, p < .001). The mean score deviation for the SF-SarQoL was 83.12 (18.31) preoperatively and 70.44 (26.26) postoperatively, and the effect size (Cohen's d) for the change in SF-SarQoL score between presurgery and 1 month postsurgery was 0.56.
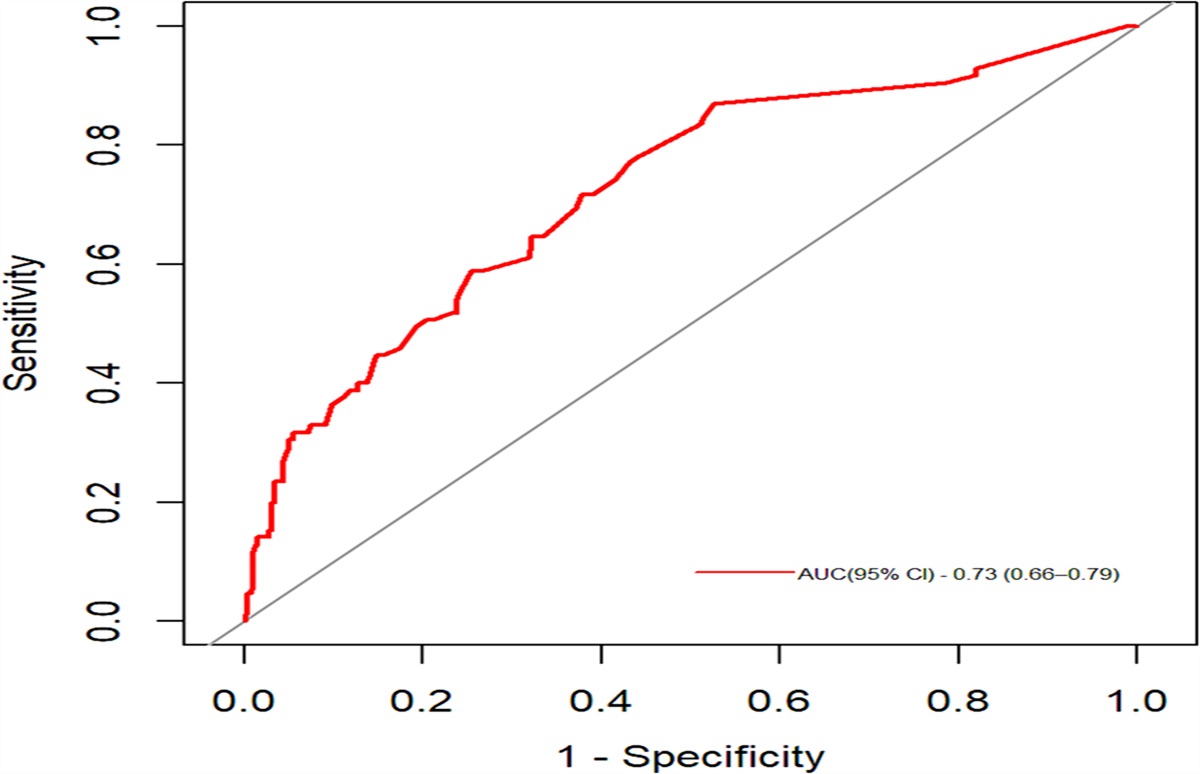
Discriminative abilityFollowing the AWGS sarcopenia criteria, 85 of the participants were classified with sarcopenia and 323 were classified without sarcopenia. The results of the ROC analyses indicate a good area under the curve for the SF-SarQoL (0.73, 95% CI [0.66, 0.79]; Figure 1).
 Figure 1:
 Receiver Operating Characteristic Curves for SF-SarQoLNote. AUC = area under the curve; SF-SarQoL = Short-Form Version of the Sarcopenia Quality of Life questionnaire.
Floor/Ceiling EffectsThree participants (0.7%) reached the minimum score (0), whereas three patients (0.7%) reached the maximum score (100), indicating the absence of either floor or ceiling effects.
DiscussionIn this study, the clinimetric properties of the Chinese SF-SarQoL in patients with colorectal cancer were examined in accordance with CLIPROM criteria. The results indicate excellent reliability (internal consistency), sufficient validity (construct validity and concurrent validity), good sensitivity (ability to detect changes and discriminative ability), and no floor or ceiling effects. This study extends and augments the results of a previous study (Geerinck, Beaudart, et al., 2021) in terms of confirming the SF-SarQoL questionnaire has good clinimetric properties in patients with cancer and, in particular, is able to capture surgery-associated changes in QoL specific to sarcopenia.
Sensitivity properties were tested based on the ability of this questionnaire to detect changes and its discriminative ability. With regard to ability to detect changes, the SF-SarQoL exhibited a moderate effect size for the change in scores between presurgery and postsurgery periods. This is an improvement over the limited evidence provided in a previous study (
Comments (0)