
Remember me


This study included 247 patients diagnosed with low and mid rectal cancer (LARC), with 122 in the experimental group and 125 in the control group, all having a median age of 59 years. There were no significant differences between the two groups in terms of gender, diabetes history, tumor staging, differentiation grade, clinical T/N stage, CEA, and CA199 levels (P > 0.05). The gender distribution was 91 male and 31 female in the experimental group, and 89 male and 36 female in the control group. In terms of diabetes history, 13 patients in the experimental group and 17 in the control group had diabetes, while the rest were non-diabetic. Regarding tumor differentiation, 10 cases in the experimental group were poorly differentiated, 63 were moderately differentiated, and 49 were well-differentiated; in the control group, 8 were poorly differentiated, 61 were moderately differentiated, and 56 were well-differentiated. There were no significant differences in baseline CEA and CA199 levels. Detailed data are shown in Table 1.
Table 1 Baseline data of two groups of patientsSurgical outcomes and pathological responseA total of 247 patients with LARC underwent preoperative concurrent chemoradiotherapy (CRT) and TME surgery. The median time from radiotherapy to surgery was 9 weeks in both groups. The distribution of surgical procedures was similar between the two groups, with 56.6% of the experimental group and 54.4% of the control group undergoing LAR surgery. The anal sphincter preservation rate was 56.6% in the experimental group and 54.4% in the control group. In terms of surgical resection margins, the experimental group achieved an R0 resection rate of 96.7%, compared to 96.8% in the control group. The experimental group had a pT downstaging rate of 72.1%, while the control group had a rate of 66.4%. The pathological complete response (pCR) rate was 18.0% in the experimental group and 16.0% in the control group. Postoperative TRG scores revealed that 18.0% of the experimental group achieved TRG1, 50.0% achieved TRG2, 27.0% achieved TRG3, and 5.0% achieved TRG4. In the control group, 16.0% achieved TRG1, 41.6% achieved TRG2, 37.6% achieved TRG3, and 4.8% achieved TRG4. There were no significant differences in the major outcomes between the two groups (P > 0.05), as shown in Table 2
Table 2 Surgical outcomes and pathological responses in both groupsIn the experimental group, 88.5% of patients with elevated baseline CEA levels returned to normal after CRT, while 87.7% of patients in the control group did so. Similarly, 87.5% of patients in the experimental group with elevated CA199 levels normalized their CA199 levels after CRT, compared to 88.9% in the control group. These differences were not statistically significant (P > 0.05), as shown in Tables 3 and 4.
Table 3 Decrease in baseline elevated CEA after CRT in both groups of patientsTable 4 Post-CRT CA199 normalization in patients with elevated baseline CA199Regarding preventive ileostomy reversal after LAR surgery, 98.6% of patients in the experimental group and 98.5% of patients in the control group underwent the procedure, with no significant difference (P > 0.05), as shown in Table 5.
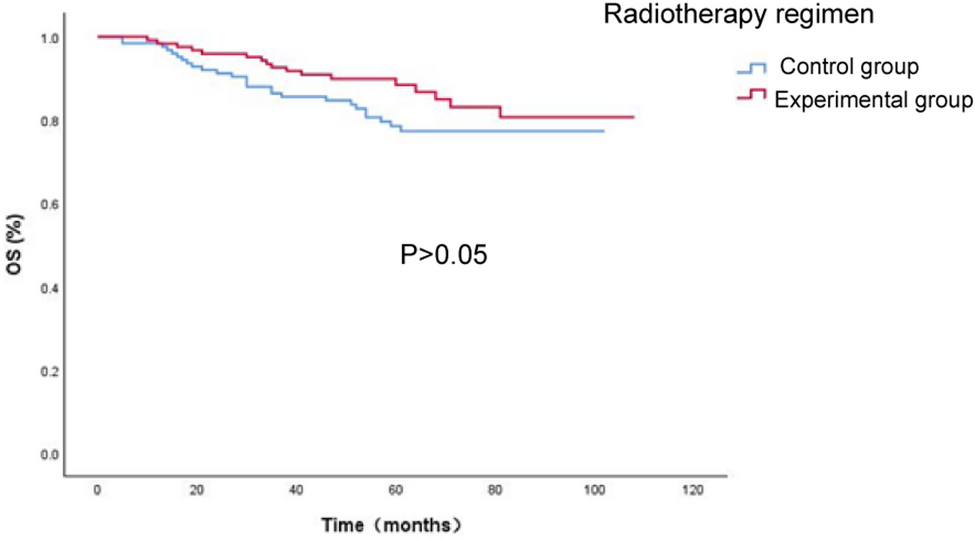
Table 5 Prophylactic ileostomy in patients undergoing LAR in both groupsSurvival and recurrence outcomesAs of January 20, 2024, the median follow-up time for the experimental group was 59.5 months (range 10–108 months), with 17 deaths, 20 instances of metastasis, and 9 local recurrences. The control group had a median follow-up time of 61 months (range 5–102 months), with 26 deaths, 29 instances of metastasis, and 8 local recurrences. Kaplan–Meier survival curves for OS, PFS, DFS, MFS, and LRFS were calculated using SPSS 29.0 software. The results showed that the 1-year, 2-year, and 3-year OS rates were 98.4% vs 98.4%, 95.9% vs 91.2%, and 92.6% vs 86.4%, respectively. The experimental group had comparable OS at each time point compared to the control group (P > 0.05), as shown in Fig. 1 and Table 6. The 1-year, 2-year, and 3-year PFS were 97.5% vs 92.8%, 86.9% vs 83.2%, and 82.0% vs 77.5%, respectively. The 1-year, 2-year, and 3-year DFS were 97.5% vs 94.3%, 87.7% vs 85.3%, and 82.7% vs 79.5%. The 1-year, 2-year, and 3-year MFS were 97.5% vs 94.3%, 88.5% vs 87.0%, and 85.2% vs 81.2%. The 1-year, 2-year, and 3-year LRFS were 99.2% vs 100.0%, 97.5% vs 96.7%, and 94.1% vs 94.1%. No significant differences in survival rates were observed between the two groups (P > 0.05), as shown in Figs. 2, 3, 4 and 5 and Tables 6.
Fig. 1
Overall Survival (OS) curve for the two patient groups.
Table 6 OS, PFS, DFS, MFS, LRFS in both groupsFig. 2
Progression-Free Survival (PFS) curve for the two patient groups
Fig. 3
Disease-Free Survival (DFS) curve for the two patient groups
Fig. 4
Metastasis-Free Survival (MFS) curve for the two patient groups
Fig. 5
Local Recurrence-Free Survival (LRFS) curve for the two patient groups
Acute adverse reactionsAcute adverse reactions in both groups primarily included hematological toxicity and non-hematological toxicities such as gastrointestinal, skin, and urinary system reactions. No significant differences were observed between the two groups regarding the incidence of acute adverse reactions such as leukopenia, thrombocytopenia, anemia, and urinary system reactions (P > 0.05). However, the experimental group had a significantly lower incidence of skin toxicity (58.2% vs 72.0%, P = 0.023) and grade 3 gastrointestinal toxicity (1.6% vs 7.2%, P = 0.034). Both groups experienced primarily grade 1–2 toxicities, with no significant difference in the incidence of grade 1–2 adverse reactions between the two groups (P > 0.05). As shown in Table 7, the incidence of grade ≥ 3 acute adverse reactions was significantly lower in the experimental group than in the control group (7.4% vs 17.6%, P = 0.015), as shown in Table 8.
Table 7 Acute adverse events in both groupsTable 8 Grade ≥ 3 acute adverse events in both groupsPerioperative complicationsIn the experimental group, 3 patients developed perioperative complications, including wound infections, pelvic abscesses, and urethral injuries, with no associated deaths. After treatment, the patients’ quality of life was unaffected. In contrast, 12 patients in the control group experienced complications, including anastomotic leaks, ureteral injuries, intestinal obstruction, pelvic abscesses, and wound infections. One patient died due to secondary abdominal infection and septic shock. Two patients developed chronic wound non-healing, resulting in ulcers and fistulas. The incidence of perioperative complications was significantly lower in the experimental group than in the control group (2.5% vs 9.6%, P = 0.019), as shown in Table 9.
Table 9 Perioperative complications in the two groups of patientsPostoperative preventive ileostomy reversal in LAR patientsIn the experimental group, 68 patients underwent preventive ileostomy after LAR surgery, with 66 patients successfully having the ileostomy reversed approximately six months postoperatively. However, 2 patients were unable to undergo ileostomy reversal due to rigid thickening of the intestinal wall and anastomotic stenosis. In the control group, 67 patients underwent preventive ileostomy after LAR surgery, and 58 patients had their ileostomies reversed. Eight patients were unable to undergo reversal due to rigid thickening of the intestinal wall and anastomotic stenosis, while one patient was excluded due to pelvic infection. The preventive ileostomy reversal rate in the experimental group was significantly higher than that in the control group (97.1% vs 86.6%, P = 0.026), as shown in Table 10. The significantly higher rate of ileostomy reversal in the experimental group was an important finding. The failure of reversal in the control group was primarily attributed to rigid intestinal wall thickening and anastomotic stenosis, which we believe may be related to the intensity of radiation in the irradiated area near the anastomosis.
Table 10 Preventive ileostomy reversal in patients undergoing LARLate adverse reactions in both groupsLate adverse reactions in both groups primarily involved the digestive, urinary, reproductive, skin, and other systems. Digestive reactions included diarrhea and bowel obstruction; urinary reactions included frequency, retention, and other issues; reproductive reactions included amenorrhea and vaginal stenosis; skin reactions consisted of pigmentation, ulcers, etc.; other reactions included pelvic chronic pain and radiation-induced bone necrosis.
Among the 21 patients in the experimental group, digestive reactions occurred in all 21, with 6 cases classified as grade 3–4. One patient experienced a urinary reaction, 2 patients had reproductive reactions, 3 had skin reactions, and 2 suffered from pelvic chronic pain. In the control group, 29 patients experienced digestive system reactions, with 7 cases classified as grade 3–4. Three patients had urinary reactions, 5 had reproductive reactions, 6 had skin reactions, and 2 suffered from pelvic chronic pain. Most late adverse reactions in both groups were grade 1–2, and the incidence of adverse reactions was lower in the experimental group than in the control group, although the difference was not statistically significant (P > 0.05). Detailed data are shown in Table 11.
Table 11 Late adverse events in both groupsUnivariate prognostic analysisUnivariate analysis was conducted using the univariate Cox regression analysis for clinical factors such as age, gender, diabetes history, tumor stage, radiotherapy regimen, pCR, TRG grading, postoperative T/N stage, cancer nodules, baseline CEA, baseline CA199, CRT post-CEA, and CRT post-CA199. The results revealed that gender, TRG grading, postoperative T stage, postoperative N stage, and cancer nodules were significant factors influencing OS, PFS, DFS, MFS, and LRFS (P < 0.05). Baseline CEA was significantly associated with PFS (P < 0.05); baseline CA199 was associated with OS, PFS, DFS, and MFS (P < 0.05); CRT post-CA199 was significantly associated with OS and MFS (P < 0.05). However, age, diabetes history, tumor staging, radiotherapy regimen, pCR, and CRT post-CEA did not significantly influence long-term prognosis (P > 0.05), as shown in Table 12.
Table 12 Univariate analysis of 247 patients with locally advanced rectal cancerMultivariate prognostic analysisBased on the results of the univariate analysis, multivariate Cox regression analysis was performed to evaluate the potential influencing factors for OS, PFS, DFS, MFS, and LRFS. The results indicated that postoperative T stage, postoperative N stage, and baseline CA199 were significantly associated with OS, PFS, and DFS (P < 0.05). Postoperative N stage was significantly correlated with MFS (P < 0.05), and postoperative T stage was significantly associated with LRFS (P < 0.05). Detailed data are shown in Tables 13, 14, 15, 16 and 17.
Table 13 Multivariate analysis of prognostic factors for overall survival (OS) in 247 patients with locally advanced rectal cancerTable 14 Multivariate analysis of prognostic factors for progression-free survival (PFS) in 247 patients with locally advanced rectal cancerTable 15 Multivariate analysis of prognostic factors for disease-free survival (DFS) in 247 patients with locally advanced rectal cancerTable 16 Multivariate analysis of prognostic factors for metastasis-free survival (MFS) in 247 patients with locally advanced rectal cancerTable 17 Multivariate analysis of prognostic factors for local recurrence-free survival (LRFS) in 247 patients with locally advanced rectal cancer
Comments (0)