
Remember me
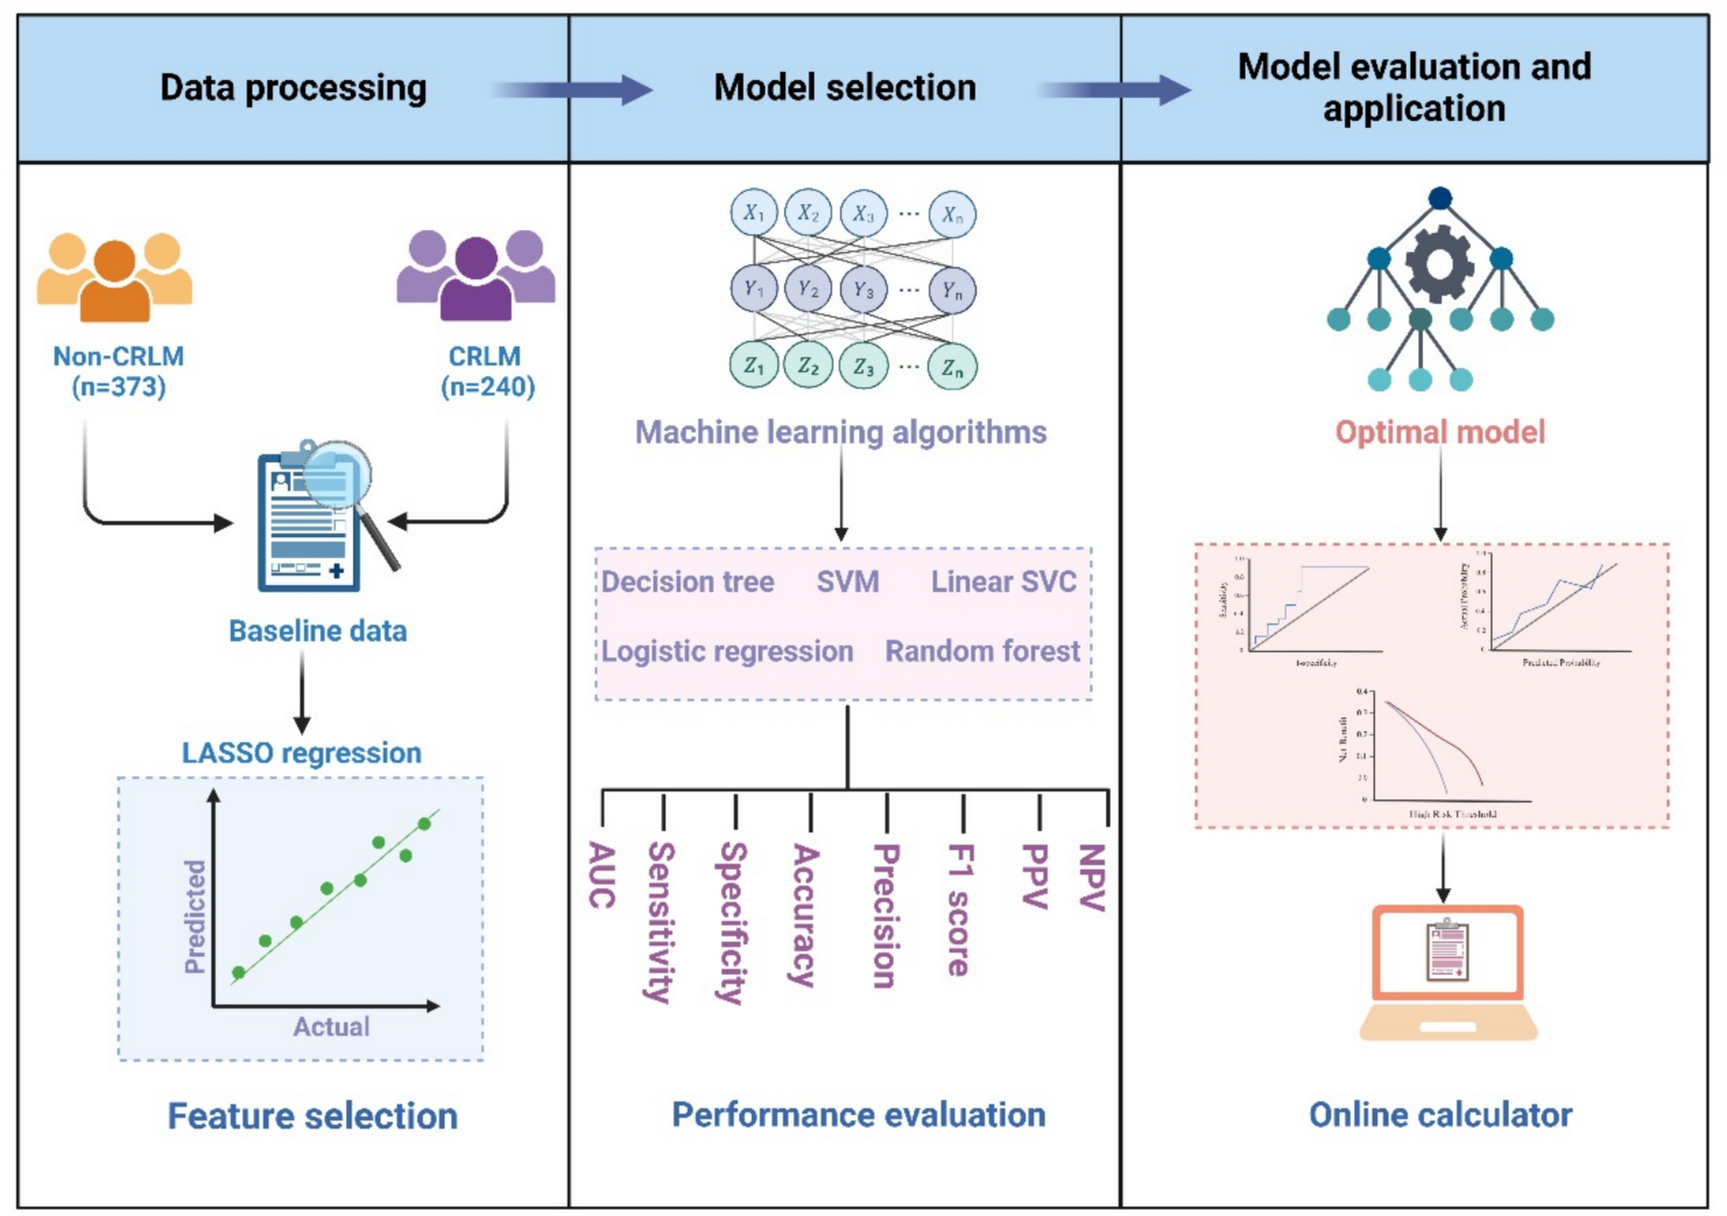

Table 1 summarizes the clinical characteristics of participants in both the discovery and validation cohorts. A total of 865 subjects were included in this study. The discovery cohort comprised 613 CRC patients, including 373 non-CRLM and 240 CRLM patients. The validation cohort consisted of 252 subjects, including 160 non-CRLM and 92 CRLM patients. In the discovery cohort, no statistically significant differences were observed between the non-CRLM and CRLM groups in terms of age, gender, WBC count, Hb, platelet, RDW, MPV, creatinine, CK, Mb, HDL-C, tumor size, location, and degree of differentiation (P > 0.05). However, CRLM patients exhibited more frequent abnormalities in liver function, characterized by elevated levels of TBIL, DBIL, TBA, ALT, and AST, as well as increased tumor markers CEA and CA199. Additionally, there were significant differences between the two groups in MCV, TG, AGR, LDH, LDL-C, T stage, and lymph node metastasis (P < 0.05). The data distribution between the discovery and validation cohorts was largely consistent.
Table 1 Baseline characteristics of CRLM and non-CRLM patientsFeature selectionTo further enhance the interpretability and predictive performance of the model, we employed LASSO regression for variable selection. Using tenfold cross-validation, we identified nine features with non-zero coefficients: LDH, CA199, ALT, CEA, TBIL, AGR, TG, MCV, and lymph node metastasis (Fig. 2a, b).
Fig. 2
Feature selection based on LASSO regression. a LASSO coefficient profiles of the fourteen risk factors. b Nine risk factors selected using LASSO regression analysis
CRLM-Lab6 prediction model constructionThe discovery cohort was utilized for model construction. A total of five ML models were employed for performance comparison: Logistic regression, Linear SVC, Random forest, Decision tree, and SVM. Specifically, each model underwent training and parameter optimization using the training set, while the validation set was used to assess model performance. Among these algorithms, the Random forest model demonstrated superior performance. The AUC of the Random forest model in the training set was 1.00 (Fig. 3a). Additionally, in the internal validation set, the AUC of the Random forest model was 0.93 (Fig. 3b), with a sensitivity of 0.82, specificity of 0.90, PPV of 0.83, and NPV of 0.88 (Table 2). Consequently, we selected the Random forest algorithm to construct the CRLM prediction model.
Fig. 3
ML-based prediction model for CRLM. a The ROC curve of the Random forest model in the internal training set. b The ROC curve of the Random forest model in the internal validation set. c Weight of AGR, TBIL, ALT, LDH, CEA, CA199, TG, MCV and lymph node metastasis in the Random forest model. d ROC curve analysis of six features
Table 2 Performance of five modelsWe further analyzed the relative importance of each variable in the Random forest model, ranking them in descending order as follows: LDH, CA199, ALT, CEA, TBIL, AGR, TG, MCV, and lymph node metastasis (Fig. 3c). To simplify the model while retaining predictive power, we selected the top six variables by importance (LDH, CA199, ALT, CEA, TBIL, and AGR) to optimize the model. Consequently, a refined Random forest model based on these six key variables was constructed and designated as CRLM-Lab6. Additionally, the ROC curve analysis demonstrated that these six features exhibited robust predictive performance for CRLM risk (Fig. 3d).
In the internal validation set, the CRLM-Lab6 model demonstrated exceptional performance with an AUC of 0.94, with a sensitivity of 0.88, specificity of 0.93 (Fig. 4a). The precision-recall curve indicated that the model achieved satisfactory performance (Fig. 4b). Additionally, the decision curve analysis confirmed that this model offers substantial clinical utility. (Fig. 4c). Furthermore, the calibration curve revealed a close alignment between the observed and predicted probabilities (Fig. 4d).
Fig. 4
Evaluation of the ability of the CRLM-Lab6 model to predict CRLM. a ROC curve analysis. b Precision recall curve analysis. c Decision curve analysis. d Calibration curve analysis
Validation of CRLM-Lab6 prediction modelTo further evaluate the performance of the CRLM-Lab6 model, we conducted an analysis in a validation cohort comprising 252 subjects between January 2023 and September 2024, including 160 non-CRLM patients, and 92 CRLM patients. The ROC analysis demonstrated that the CRLM-Lab6 model effectively distinguished the CRLM patients from the non-CRLM patients, achieving an AUC of 0.96, with a sensitivity of 0.95 and specificity of 0.93.
A web page calculator of CRLM prediction modelBased on the CRLM-Lab6 model, we have developed an online calculator designed to predict the risk of CRLM occurrence. Users can input the relevant variables into the tool available at (https://dxonline.deepwise.com/prediction/index.html?baseUrl=%2Fapi%2F&id=49967&topicName=undefined&from=share&platformType=wisdom) to obtain a prediction of CRLM risk (Fig. 5).
Fig. 5
The visualization of the CRLM-Lab6 model through the DxAI platform
Comments (0)