Patients
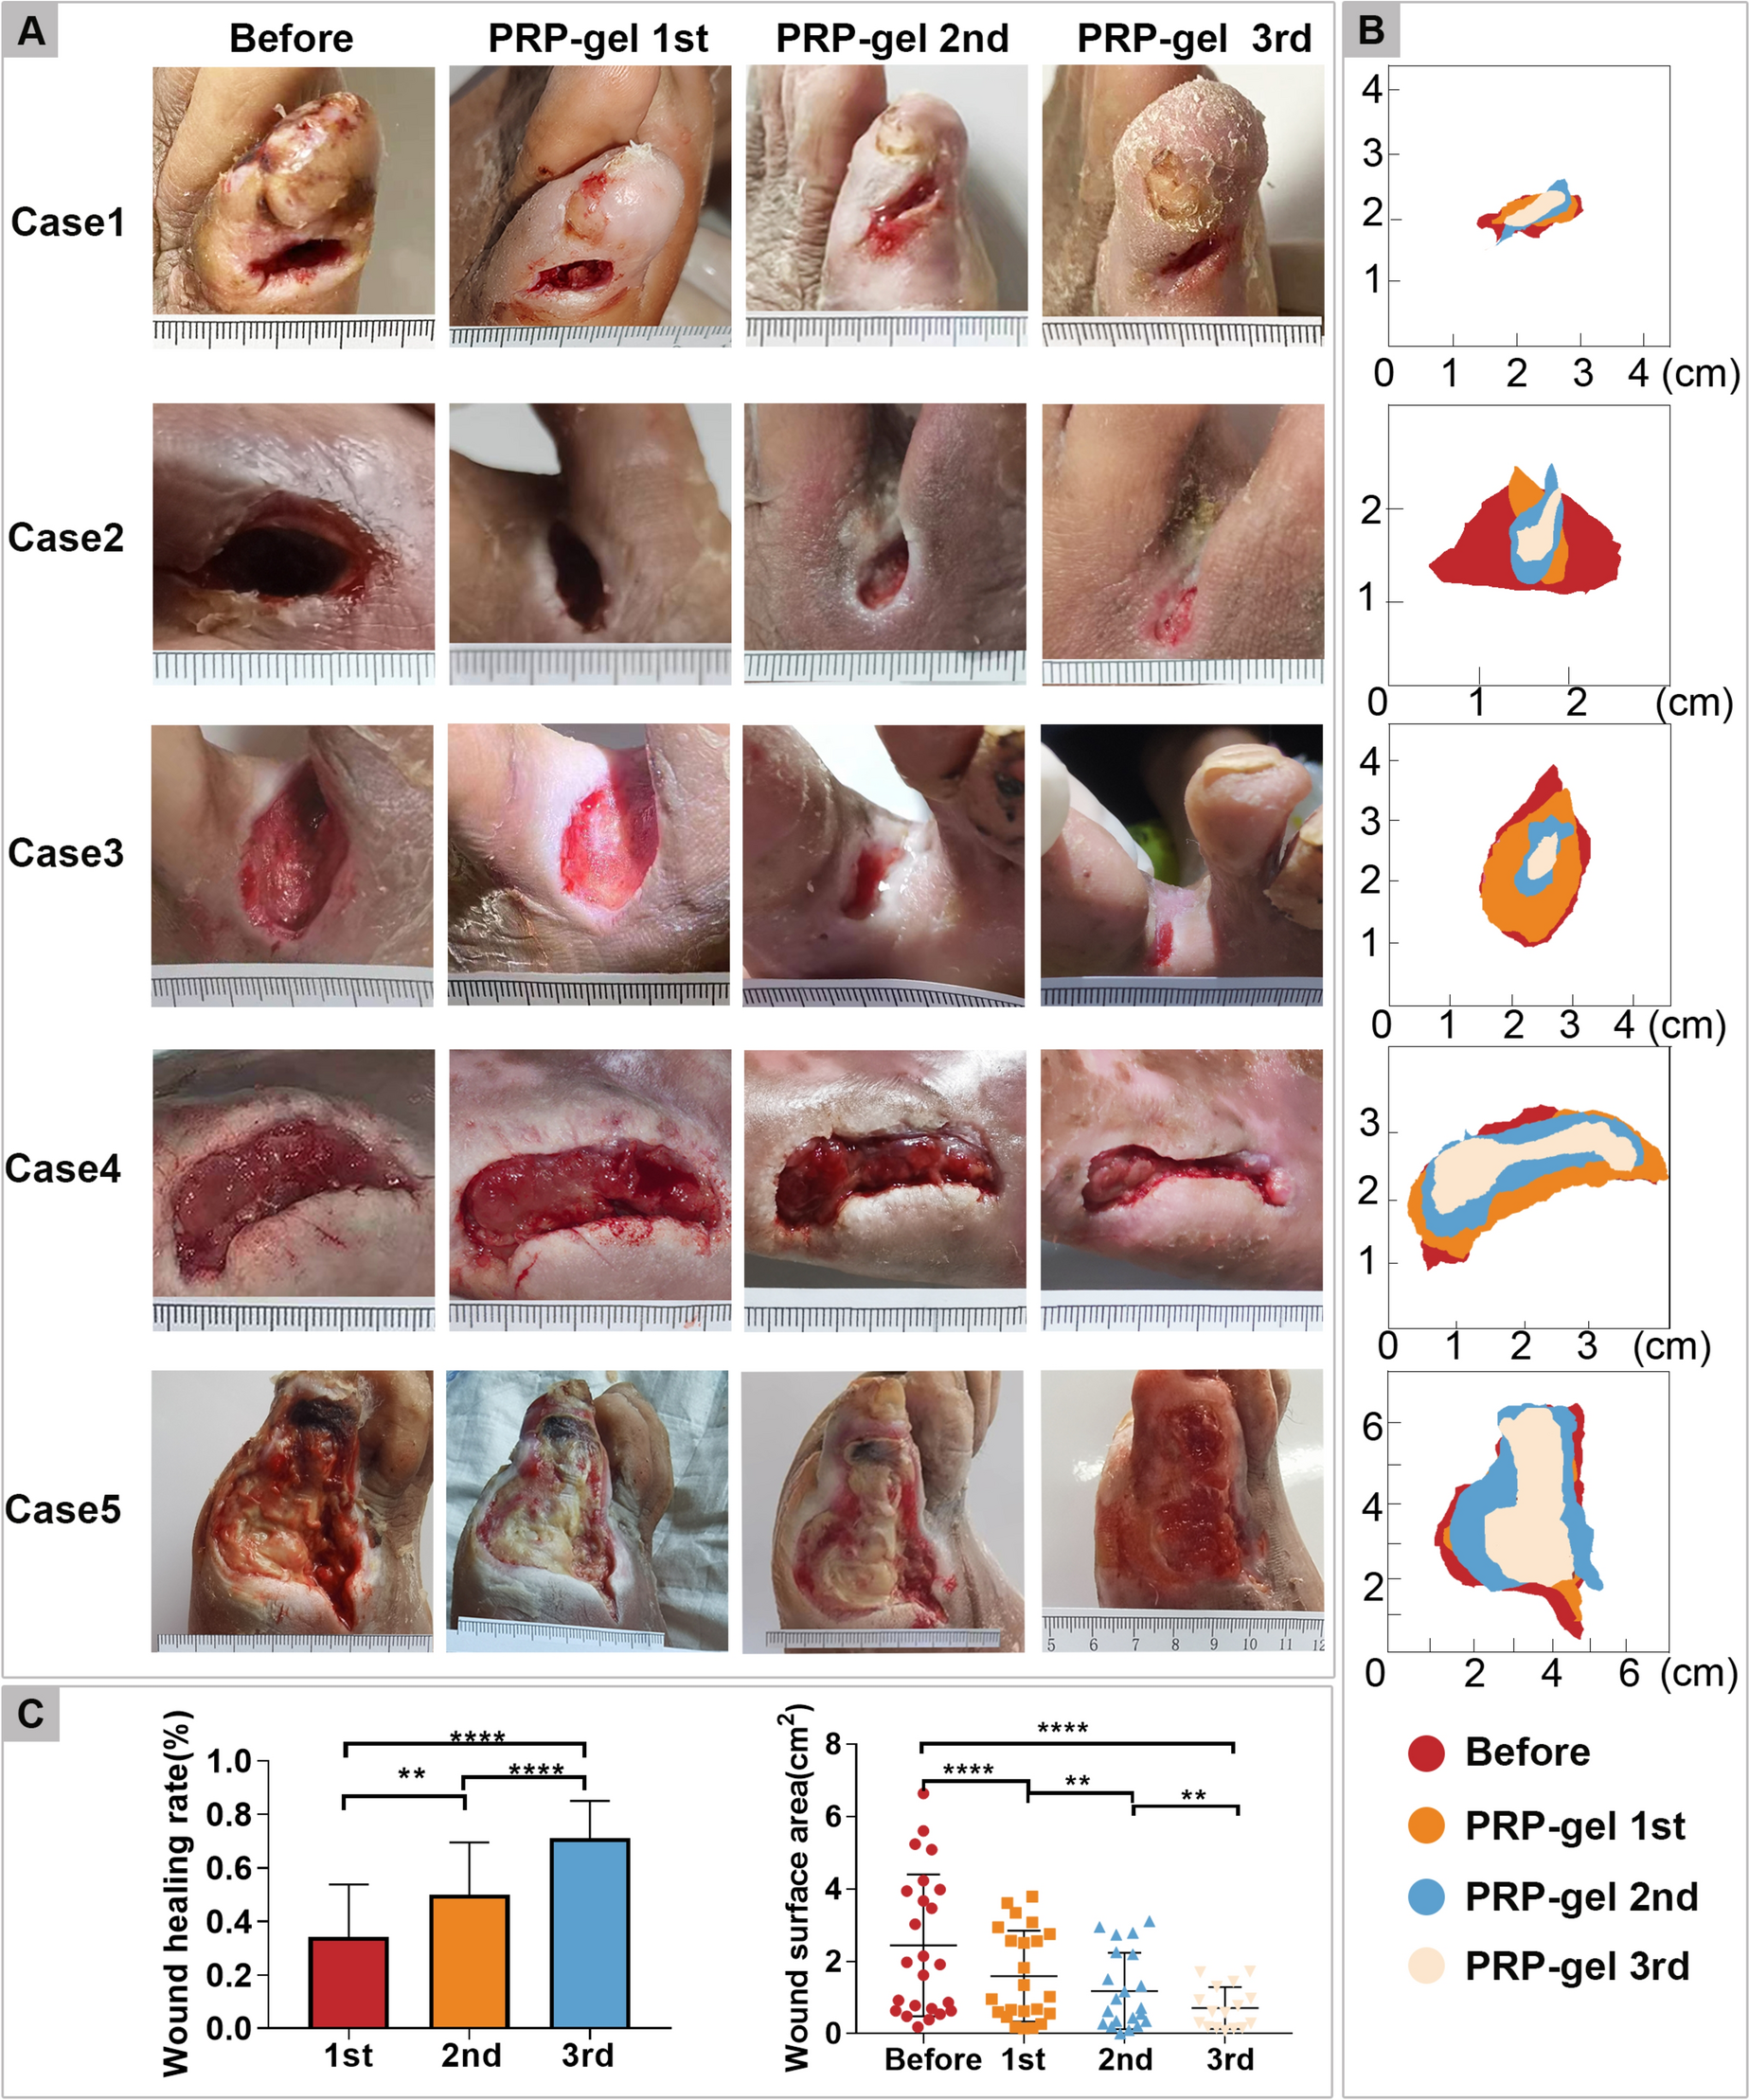
This study was sanctioned by the Ethics Committee of the Wannan Medical College. Written informed consent was obtained from all participants. These patients had been diagnosed with stages II–IV DFU’s based on the Wagner classification system. Clinical information regarding the patients is presented in Supplemental Table S1-S2. The wound of the patient with diabetic foot was treated using only autologous PRP-gel derived from the patient themselves. The ulcer area was measured every 3 days using a digital camera, and wound closure rates were calculated. We analyzed wound area measurements from images using ImageJ (NIH, USA) software. Data were not identifiable to any patient.
Diabetic skin wound animal model and treatment
Adult male BALB/c mice (6–8 weeks of age and weighing 26–28 g; grade, clean; license, SCXK 2023-005) were purchased from the Experimental Animal Center of Qinglongshan (Nanjing, China) and raised in a specific-pathogen-free (SPF) mouse colony. Mice were housed in a controlled environment with a 12-h light/dark cycle, maintained at 22 ± 2 °C, and provided with standard rodent chow and water ad libitum. Diabetes was induced by intraperitoneal injection of streptozotocin (STZ, 50 mg/kg) for 5 days consecutively. After 4 weeks, blood glucose levels were monitored, and mice with sustained blood glucose levels above 16.8 mmol/L were considered successful diabetic models. An electronic blood glucose meter (Roche, China) was used to measure mouse serum glucose levels. Subsequently, full-thickness skin ulcers with a diameter of 6 mm were created on the dorsal side of the mice to serve as a DFU model.
Chronic wound healing in mice
A model of DFUs was created in mice anesthetized with isoflurane inhalation. A single round full-thickness skin wound was then created with a 6-mm disposable skin biopsy punch on the dorsum of the diabetic mice. Digital images of the wound area were captured on the day of surgery and on days 5, 7, 9, and 11 after operation. A ruler reference was placed nearby to confirm the distance between the animals and the camera. The wound area was quantified by three blinded observers using ImageJ (NIH, USA) software and expressed as a percentage of the original area. The wound was covered with gauze and a bandage, and the dressings were changed every 3 days according to the standard of care; and wound tissues were sampled and harvested at 5, 7, 9, and 11 days. Harvested wound tissues were fixed in 10% formalin solution and adopted for further immunofluorescence (IF) investigations.
Preparation of PRP and PRP-gel
Ten healthy adult volunteers, aged between 18 and 45 years and with no history of hematological or infectious diseases, were selected. PRP was isolated utilizing a fully automatic blood separator (COM.TEC; Fresenius Kabi, German), and PRP-gel was produced by activating PRP with a prepared mixture of thrombin and calcium gluconate at a ratio of 10:1. PRP-gel derived from volunteers was used for the diabetic wound experiment in mice.
Morphological staining
A graded series of ethanol and formaldehyde were applied to the wound tissues from the mice after they had been sampled at 5, 7, 9, and 11 days; and paraffin was applied after the tissues were fixed in 4% formaldehyde overnight. The sections were cut at a thickness of 5 mm and then treated with hematoxylin and eosin (Servicebio, China). We performed Masson trichrome staining using a staining kit (Servicebio, China) in accordance with the manufacturer’s guidelines.
Immunofluorescence staining
The tissues were fixed with 4% paraformaldehyde for 16–24 h at 4 °C, followed by embedding in paraffin and sectioning at 4 μm. After deparaffinization with a dewaxing solution and anhydrous ethanol, the sections were rinsed in PBS and then blocked with 5% of BSA blocking solution for 30 min. The sections were subsequently incubated overnight at 4 °C with primary antibodies targeting iNOS (Servicebio, China), Arg-1 (Servicebio, China), and F4/80 (Servicebio, China). For immunofluorescence staining, the sections were incubated with Alexa Fluor 488, Alexa Fluor 555, and conjugated secondary antibodies (Servicebio, China). To evaluate the angiogenesis of PRP-gel and PRP-Exos in the treatment of diabetic wounds, the sections were incubated with antibodies to α-SMA (Servicebio, China) and CD31 (Servicebio, China) at 4 °C overnight. After washing several times with PBS, DAPI (Servicebio, China) was used to stain the nuclei for 10 min. Fluoroshield mounting medium (G1401, Servicebio, China) was applied to preserve fluorescence when imaging tissues.
Isolation and purification of PRP-Exos
The PRP samples were centrifuged at 3000 × g for 15 min at 4 °C to remove cell debris, and the supernatant was then centrifuged at 10,000 × g for 30 min at 4 °C to remove large particles; this was followed by ultracentrifugation of the supernatant at 100,000 × g for 70 min at 4 °C to pellet the exosomes. The exosomal pellets were ultracentrifuged in PBS and centrifuged again at 100,000 × g for 70 min to wash the exosomes.
Identification of PRP-Exos
A transmission electron microscope (TEM) was used to identify the morphology of the exosomes. Briefly, PRP-Exos were fixed in 3% glutaraldehyde for 2 h and washed twice with PBS. The exosomes were negatively stained with 2% uranyl acetate for 30 s and applied to a continuous carbon grid. We ultimately visualized the exosomes on a FEI Tecnai G2 12 TEM (FEI, America).
The size distribution of PRP-derived exosomes (PRP-Exos) was determined using nanoparticle tracking analysis (NTA) with a ZetaView PMX-120 system (Particle Metrix, Germany). Prior to sample analysis, the instrument was calibrated using 100-nm polystyrene nanoparticles as reference standards. The exosome pellet, resuspended in phosphate-buffered saline (PBS), was subsequently introduced into the NTA system for particle-size characterization. It should be noted that while polystyrene beads serve as reliable calibration standards, the inherent differences in material composition between synthetic beads and biological exosomes necessitate cautious interpretation of size distribution data. Therefore, the NTA results were complemented and validated by TEM for direct visualization of exosomal morphology and western blot (WB) analysis for specific exosomal marker identification, ensuring comprehensive characterization of the isolated exosomes.
The marker proteins of the exosomes were detected by western blotting. A QubitTM Protein Assay Kit (Thermo Fisher Scientific, USA) was used to measure the protein concentration of the isolated PRP-Exos. PRP-Exos (10 μg protein) were lysed in loading buffer (Solarbio, China), separated by sodium dodecyl sulfate polyacrylamide gel electrophoresis (SDS-PAGE) and transferred onto a 0.22-μm nitrocellulose (NC) filter membrane (Millipore, USA). The NC filter membranes were incubated with the following primary antibodies: Alix (SantaCruz, USA), CD81 (SantaCruz, USA), CD63 (Abcam, USA), and flotillin-1 (Abcam, USA). Imaging was performed using a chemiluminescence imaging system (P&Q Science & Technology, USA).
In vitro experiments of bone marrow-derived macrophages
BMDMs were separated from the mouse femurs and tibias under sterile conditions. BMDMs were seeded in six-well plates and cultured in Dulbecco’s modified eagle’s medium (DMEM, Gibco, USA) containing 20% fetal bovine serum (FBS, Gibco, USA) and 20% L929 cell supernatant at 37 °C in a 5% CO2 incubator (M0). Seven days later, the cells were transferred in fresh RPMI-1640 medium containing 10% FBS for 24 h. BMDMs were cultured with DMEM medium (10% FBS) supplemented with 100 ng/ml lipopolysaccharide (LPS, Sigma, USA) plus 20 ng/ml interferon-γ (IFN-γ, Sigma, USA) for 24 h to activate M1 polarization or 20 ng/ml interleukin-4 (IL-4, Sigma, USA) for 48 h to activate M2 polarization.
Statistical analyses
Results are expressed as the mean ± standard deviation (SD). We analyzed the data using GraphPad Prism software (version10.4), with Student’s t-test used to compare the differences between the two groups. A P value < 0.05 was considered statistically significant.


Comments (0)