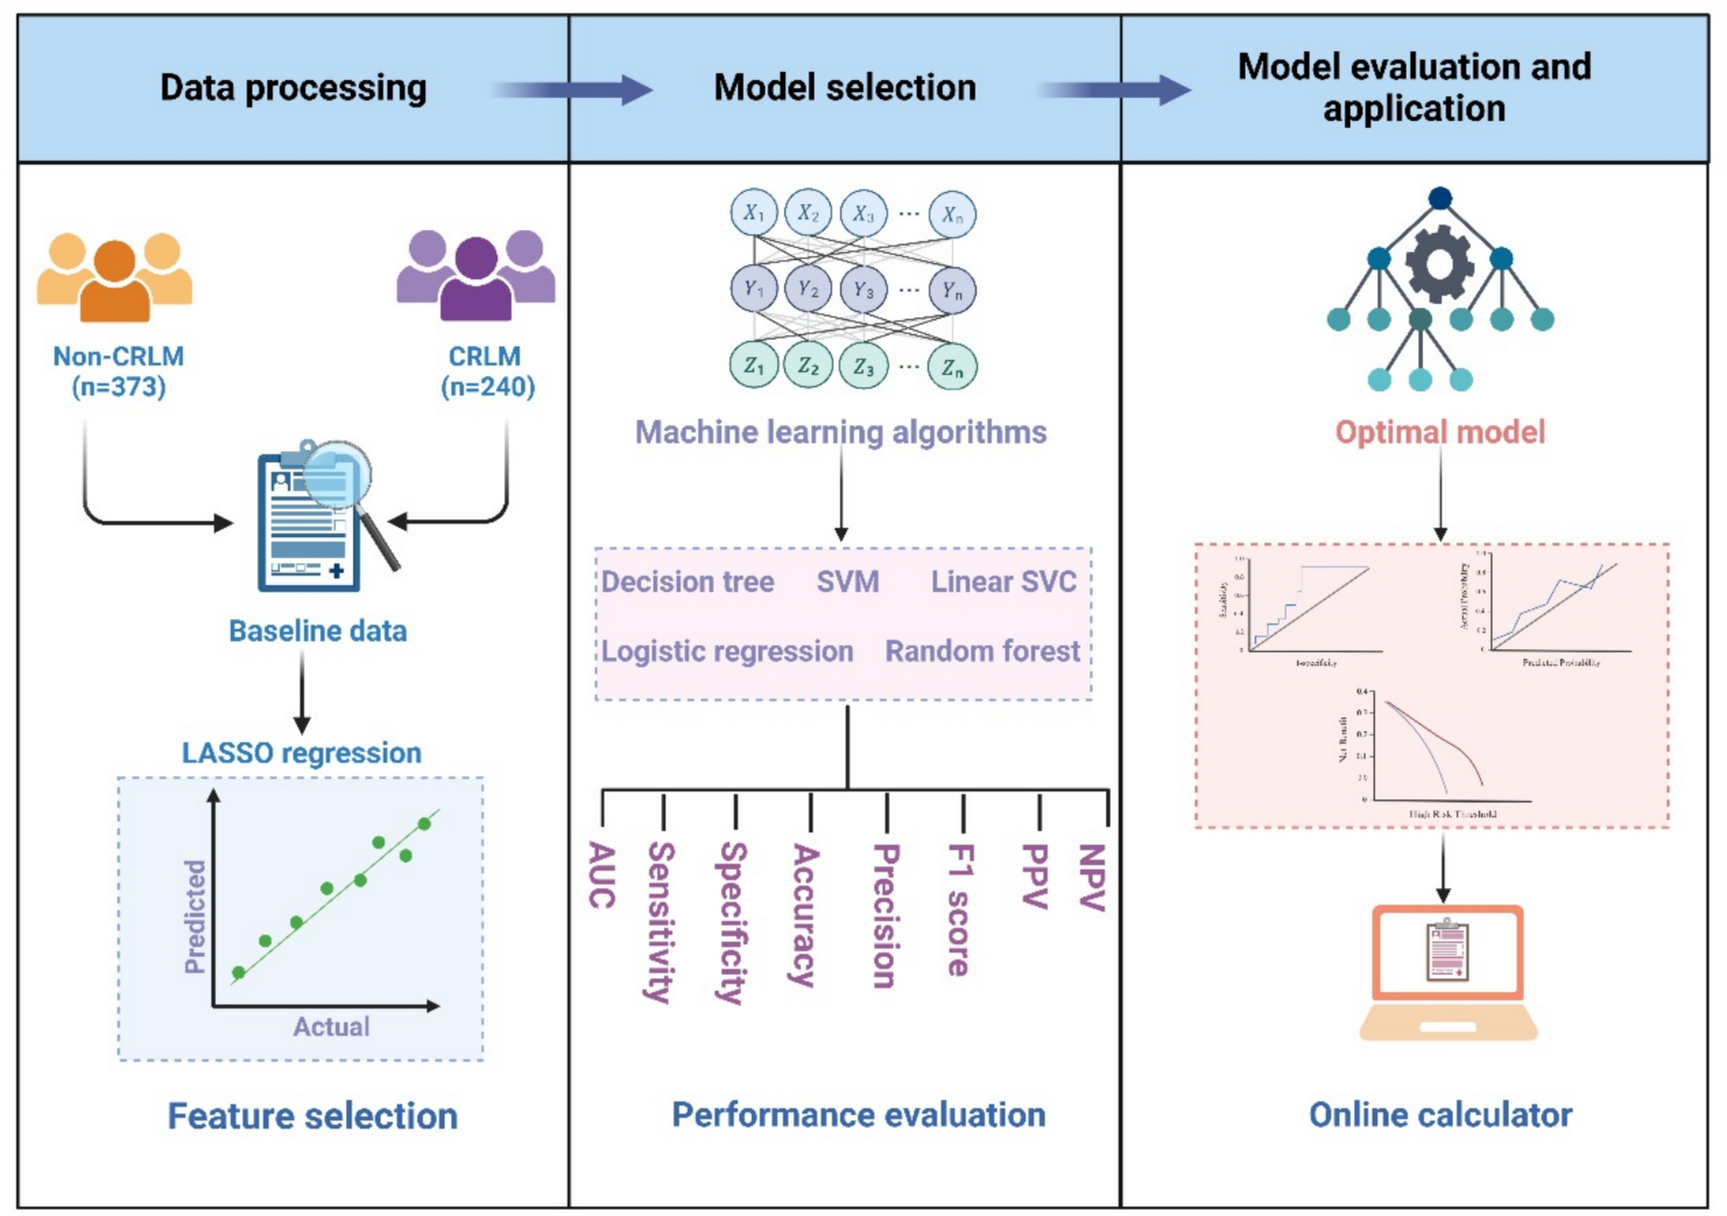
Data retrieval, analysis, and identification of hub genes in TC and HT
To identify differentially expressed genes (DEGs) in TC and HT, we retrieved datasets from the Gene Expression Omnibus (GEO) database (https://www.ncbi.nlm.nih.gov/geo/) [16], including two TC datasets (GSE53157 and GSE153659) and two HT datasets (GSE54958 and GSE138198). Data preprocessing steps were performed prior to DEG analysis to ensure the reliability and reproducibility of the results. Specifically, all raw gene expression data were first normalized to correct for any technical variation between samples, ensuring that the results reflect biological differences rather than technical biases. For normalization, we used the quantile normalization method, which adjusts for differences in overall intensity distribution across samples. This method was chosen to ensure that each dataset could be directly compared by aligning the distributions of expression values. Additionally, batch effects—systematic variations that could arise from differences in experimental conditions, platforms, or other external factors—were corrected using the ComBat method, an empirical Bayes approach available in the sva R package. Batch effect correction is crucial to prevent confounding factors from influencing the DEG analysis, particularly when datasets are collected from different platforms or studies. After normalization and batch effect correction, we performed DEG analysis using the limma package (https://bioconductor.org/packages/release/bioc/html/limma.html) in R, which is a widely used tool for analyzing differential expression in high-throughput data. Differential expression was visualized through volcano plots, where the x-axis represents log2 fold change (LogFC) and the y-axis represents the -log10 of the p-value. A LogFC cutoff value of |LogFC|≥ 1 was applied, corresponding to a fold change of ≥ 2 in gene expression, to identify significantly upregulated or downregulated genes. Additionally, genes with an adjusted p-value (Padj) < 0.05 were considered statistically significant. Finally, a Venn diagram was used to compare the top 2000 DEGs identified across all four datasets, highlighting the overlap of DEGs between TC and HT samples. For Protein–Protein Interaction (PPI) analysis of the common genes, we used the STRING database (https://string-db.org/) [28] to construct the interaction networks. The PPI network was visualized using the Cytoscape software (https://cytoscape.org/). To identify the most important genes within the interaction network, we applied the CytoHubba application in Cytoscape. This tool calculates the "degree" of each node (representing genes) in the network, where the degree is the number of interactions a protein has with other proteins. Genes with the highest degree values were considered to have the most central roles in the network, thus providing a measure of their importance in the biological processes associated with TC and HT. The rationale for using the degree method is based on the premise that highly connected proteins are likely to be functionally important, influencing key pathways involved in disease development. Through this method, CLTA, EDIL3, HAPLN1, and HIP1 emerged as the most significant hub genes, with the highest interaction frequencies. These genes were selected for further analysis due to their central roles in the PPI network and their potential involvement in the molecular mechanisms underlying TC and HT. This focused analysis using the degree method allowed us to narrow down the list of potential biomarkers from overlapping DEGs to four key genes that could serve as promising candidates for further experimental validation and clinical application.
Cell culture
In this study, we purchased 10 TC cell lines and 6 normal thyroid cell lines from the American Type Culture Collection (ATCC), USA. The thyroid cancer cell lines used were TPC1, CAL62, BHT-101, SW1736, K1, KTC1, CGTH-W-1, ARO, C643, and BCPAP, while the normal thyroid cell lines included Nthy-ori 3–1, FRTL-5, HTori-3, NTHY-1, Thy-1, and HTh7. These cell lines were cultured in our laboratory under optimal conditions for comparative analysis of gene expression and molecular characteristics. For TC cell lines, RPMI-1640 medium (Thermo Fisher Scientific) supplemented with 10% Fetal Bovine Serum (FBS) (Thermo Fisher Scientific) and 1% Penicillin–Streptomycin (Thermo Fisher Scientific) was used to support their growth. In contrast, the normal thyroid cell lines were cultured in DMEM/F12 medium (Thermo Fisher Scientific), supplemented with 10% FBS and 1% Penicillin–Streptomycin. All cell lines were maintained in a humidified incubator at 37 °C with 5% CO2, with the medium being changed every 2–3 days. Cells were subcultured upon reaching approximately 80% confluence using Trypsin–EDTA (Thermo Fisher Scientific) for detachment.
Reverse transcription quantitative PCR (RT-qPCR) analysis
To analyze the gene expression of CLTA, EDIL3, HAPLN1, HIP1, Rap1A, and C3G, RNA was extracted from the cultured TC and normal thyroid cell lines. First, cells were collected from the culture plates once they reached 80% confluence, and total RNA was extracted using the RNeasy Mini Kit (Qiagen) according to the manufacturer’s protocol. The RNA concentration and quality were assessed using a NanoDrop spectrophotometer (Thermo Fisher Scientific), and only samples with a 260/280 ratio between 1.8 and 2.0 were used for further analysis. Next, the RNA was reverse transcribed into complementary DNA (cDNA) using the High-Capacity cDNA Reverse Transcription Kit (Applied Biosystems), following the manufacturer’s instructions. Briefly, 1 µg of total RNA was used for cDNA synthesis, and the reaction was carried out in a thermal cycler under conditions specified in the kit protocol.
Following cDNA synthesis, RT-qPCR was performed to assess the expression levels of the target genes (CLTA, EDIL3, HAPLN1, HIP1, Rap1A, and C3G) and GAPDH as a housekeeping gene. The RT-qPCR reactions were set up using SYBR Green PCR Master Mix (Applied Biosystems) and performed on the QuantStudio 5 Real-Time PCR System (Thermo Fisher Scientific). The relative expression levels of the target genes were calculated using the 2^-ΔΔCt method, with GAPDH as the internal control for normalization. All the primers used in this study have been listed in Table 1.
Table 1 Detail of the primers used in the current studyThe thermal cycling conditions for RT-qPCR reactions were as follows: an initial denaturation step was performed at 95 °C for 10 min to activate the SYBR Green DNA polymerase. This was followed by 40 cycles of amplification, each consisting of denaturation at 95 °C for 15 s, annealing at the optimal temperature for each gene (Table 1) for 30 s, and extension at 72 °C for 30 s. After amplification, a melting curve analysis was performed by increasing the temperature from 60 °C to 95 °C at a rate of 0.1 °C per second to ensure the specificity of the PCR products.
Validation of hub gene expression and Gene Set Enrichment Analysis (GSEA) analysis
To validate the expression of the hub genes CLTA, EDIL3, HAPLN1, and HIP1, we utilized the TCGA TC dataset in conjunction with the GSCA database (http://bioinfo.life.hust.edu.cn/GSCA/) [29] The GSCA database provides integrated analysis tools for gene expression and clinical data in cancer, allowing for the comparison of gene expression between tumor and normal tissues. The expression levels of the selected hub genes were assessed in both tumor and normal tissue samples from TC. In addition, this database was also utilized for the GSEA analysis of hub genes in TC.
Promoter methylation analysis
To investigate the promoter methylation status and its correlation with gene expression of the hub genes CLTA, EDIL3, HAPLN1, and HIP1 in TC, we utilized the OncoDB and GSCA databases. The OncoDB database (http://oncodb.org/) [30] provides information on genetic and epigenetic alterations in cancer, including methylation profiles across different cancer types. The GSCA database [29] integrates cancer genomic data and allows for the analysis of gene expression and methylation status, making it a suitable resource for this study.
Mutational and copy number variation (CNV) analysis
To analyze the mutational and CNV data of the hub genes CLTA, EDIL3, HAPLN1, and HIP1 in TC, we utilized the cBioPortal database (https://www.cbioportal.org/) [31], a comprehensive resource for exploring, visualizing, and analyzing multidimensional cancer genomics data. cBioPortal provides access to mutation, copy number, and clinical data from multiple cancer studies, making it an ideal platform for investigating the genetic alterations of specific genes in various cancer types, including TC.
Meta-analysis of survival associations for hub genes
To assess the survival associations of the hub genes CLTA, EDIL3, HAPLN1, and HIP1 in thyroid cancer, we conducted a meta-analysis using data from the GENT2 database (http://gent2.appex.kr/gent2/) [32], which integrates gene expression and clinical data from multiple cancer datasets. The GENT2 database provides tools for analyzing the impact of gene expression on patient survival across a variety of cancers, including TC.
Correlation analysis of hub genes with immune regulation and drug sensitivity
The TISIDB database (http://cis.hku.hk/TISIDB/) [33] is a comprehensive resource for studying tumor immune microenvironments, including immune-related gene expression and immune cell infiltration. In this study, we analyzed the correlation between the expression of the hub genes and immune inhibitor genes in TC and other cancers, using the Spearman correlation coefficient. Additionally, we used the GSCA database (http://bioinfo.life.hust.edu.cn/GSCA/) [29], which integrates gene expression and clinical data, to examine the correlation between the expression levels of the hub genes and immune cell infiltration and to perform drug sensitivity analysis in TC.
PPI network and gene enrichment analysis of hub genes
The GeneMANIA database (http://genemania.org/) [34] is a powerful tool for predicting protein interactions and gene function based on functional genomics data, while the STRING database (https://string-db.org/) [28] provides known and predicted protein interactions derived from experimental and computational data. Using both databases, we constructed the PPI networks for the hub genes. In addition, The DAVID database (https://david.ncifcrf.gov/) [35] was used for functional annotation and enrichment analysis of the hub genes and their other binding partners.
Regulatory miRNAs of hub genes
To investigate the potential regulatory miRNAs targeting the hub genes CLTA, EDIL3, HAPLN1, and HIP1, we used TargetScan (http://www.targetscan.org/) [36], a widely used tool for predicting miRNA targets based on conserved miRNA binding sites in the 3' untranslated regions (UTRs) of genes. TargetScan utilizes a large database of miRNA binding predictions and employs algorithms to assess the likelihood of interactions between miRNAs and their target genes.
For the miRNA analysis, we used the TaqMan® MicroRNA Reverse Transcription Kit (Applied Biosystems) to reverse transcribe 100 ng of total RNA into cDNA, specifically targeting the mature miRNAs of interest. RT-qPCR was then performed using TaqMan® MicroRNA Assays (Applied Biosystems) for hsa-miR-142-3p, hsa-miR-137, hsa-miR-23c, and hsa-miR-19a-3p. The reactions were conducted on the QuantStudio 5 Real-Time PCR System (Thermo Fisher Scientific). Data analysis was conducted using the 2^−ΔΔCt method, with RNU6B as the endogenous control for normalization.
Correlation analysis of hub genes
GEPIA2 (http://gepia2.cancer-pku.cn/#index) is a web-based tool for analyzing gene expression data from TCGA and GTEx projects [37]. It provides comprehensive visualizations and statistical analyses for cancer research. In this work, we used GEPIA2 to explore correlations of hub genes with Rap1 key players in TC.
Knockdown of CLTA and EDIL3 in CAL62 and TPC1 cells
To investigate the functional roles of CLTA and EDIL3 in TC, we performed miRNA-mediated knockdown of these hub genes in CAL62 and TPC1 cell lines. First, we transfected the cells with miRNAs targeting CLTA and EDIL3 using Lipofectamine RNAiMAX Transfection Reagent (Thermo Fisher Scientific) according to the manufacturer’s instructions. Pre-designed miRNA mimics specific to CLTA and EDIL3 (obtained from Thermo Fisher Scientific) were used to reduce the expression of these genes. Non transfected cells were used in parallel to serve as controls. The transfection was carried out in 6-well plates, and the cells were incubated with the transfection mixture for 48 h at 37 °C in a 5% CO2 incubator. After the knockdown procedure, the cells were harvested for RT-qPCR and Western blot analysis to assess the protein expression levels of CLTA, EDIL3, and other related markers.
For protein extraction, the cells were lysed using RIPA buffer (Thermo Fisher Scientific), supplemented with protease and phosphatase inhibitors (Sigma-Aldrich). The protein concentration was determined using the BCA Protein Assay Kit (Thermo Fisher Scientific), following the manufacturer’s instructions. Equal amounts of protein (30–50 µg) from each sample were separated by SDS-PAGE and transferred onto a PVDF membrane (Millipore). The transfer was conducted at 100 V for 1 h at 4 °C to ensure efficient protein transfer. After transfer, the membrane was blocked with 5% non-fat dry milk in TBS-T buffer (Tris-buffered saline with 0.1% Tween 20) for 1 h at room temperature to prevent non-specific binding. Following blocking, the membrane was incubated overnight at 4 °C with primary antibodies against CLTA, EDIL3, and other proteins of interest. The following primary antibodies were used: anti-CLTA (1:1000), anti-EDIL3 (1:1000), and anti-GAPDH (as a loading control, 1:5000) (all antibodies were purchased from Santa Cruz Biotechnology). Following the primary antibody incubation, the membrane was washed with TBS-T three times for 5 min each to remove excess primary antibody. The membrane was then incubated for 1 h at room temperature with HRP-conjugated secondary antibodies (1:5000). After secondary antibody incubation, the membrane was washed again with TBS-T three times for 5 min each. Protein bands were visualized using ECL detection reagent (Thermo Fisher Scientific) on a ChemiDoc XRS + System (Bio-Rad). The relative protein expression levels were quantified using ImageJ software and normalized to the GAPDH control.
Cell proliferation assay
To evaluate the effects of CLTA and EDIL3 knockdown on TC cell growth, we performed a cell proliferation assay using the CellTiter 96® AQueous One Solution Cell Proliferation Assay (Promega). After transfection with miRNAs targeting CLTA and EDIL3, CAL62 and TPC1 cells were seeded into 96-well plates at a density of 5,000 cells per well. The cells were incubated at 37 °C in a 5% CO2 incubator. At 24, 48, and 72 h, 20 µL of CellTiter 96® AQueous reagent was added to each well, and the cells were incubated for 1 h. Absorbance at 490 nm was measured using a Microplate Reader (BioTek Instruments), and the data were analyzed to calculate the proliferation rate, expressed as a percentage of the control group.
Colony formation assay
To assess the clonogenic potential of CLTA and EDIL3 knockdown cells, we performed a colony formation assay. After transfection, CAL62 and TPC1 cells were plated in 6-well plates at a density of 1,000 cells per well. The cells were incubated for 2–3 weeks at 37 °C in a 5% CO2 incubator. During this period, colonies were allowed to form. After incubation, the cells were fixed with 4% paraformaldehyde and stained with crystal violet (Sigma-Aldrich) to visualize the colonies. The colonies were counted manually, and the results were expressed as the number of colonies per well.
Wound healing assay
To investigate the effect of CLTA and EDIL3 knockdown on cell migration, we performed a wound healing assay. After transfection with the miRNAs, CAL62 and TPC1 cells were seeded in 6-well plates and grown to confluence. A wound was created by scraping the monolayer with a sterile pipette tip. The cells were washed with PBS to remove debris and incubated in serum-free medium for 24 h at 37 °C in a 5% CO2 incubator. Images were captured at 0 and 24 h using a phase-contrast microscope (Olympus), and the percentage of wound closure was calculated by measuring the area of the wound at each time point.
Statistics
Statistical analysis for all experiments was performed using GraphPad Prism software (Version 9.0). A two-way ANOVA with Tukey’s multiple comparisons test was used for analyzing differences in cell proliferation assays at various time points. For colony formation and wound healing assays, Student’s t-test was used to compare the number of colonies and wound closure between knockdown and control groups. Venn diagram and network centrality analysis were used to identify common DEGs and hub genes, with statistical significance set at an adjusted p-value (Padj) < 0.05 and LogFC |≥ 1|. ROC curve analysis and AUC values were calculated to assess the diagnostic potential of miRNAs and the effects of knockdown on protein expression levels were analyzed by Western blot using ImageJ software. Statistical significance was considered at P*-value < 0.05, P**-value < 0.01, and P***-value < 0.001.


Comments (0)