
Remember me


This study included a total of 202 patients (213 feet), with 66 males (70 feet, 32.86%) and 136 females (143 feet, 67.14%). Among them, 123 feet were on the left side (57.75%) and 90 feet on the right side (42.25%). The age of the patients ranged from 19 to 75 years old, with a BMI of 23.24 ± 3.67 kg/m2. Of these patients, 36 cases (36 feet) underwent secondary surgery to remove HyProCure, including 14 males (14 feet, 38.89%) and 22 females (22 feet, 61.11%), with 20 feet on the left side (55.56%) and 16 feet on the right side (44.44%). The age of these patients ranged from 19 to 69 years old, with a BMI of 24.25 ± 4.33 kg/m2.
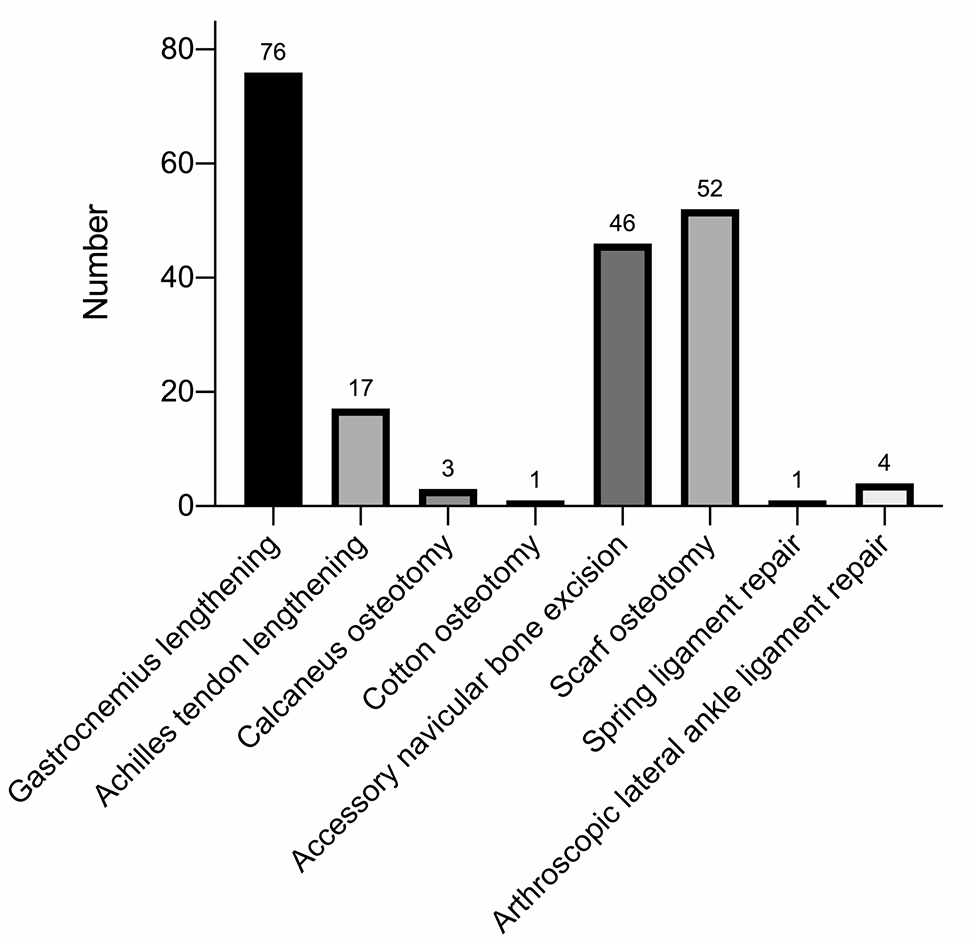
Surgery was performed in 13 feet (6.1%) with isolated SA and in 200 feet (93.9%) in combination with adjunctive procedures, including gastrocnemius lengthening in 76 feet (38%), achilles tendon lengthening in 17 feet (8.5%), calcaneus osteotomy in 3 feet (1.5%), Cotton osteotomy in 1 feet (0.5%), accessory navicular bone excision in 46 feet (23%), scarf osteotomy in 52 feet (26%), spring ligament repair in 1 feet (0.5%), and arthroscopic lateral ankle ligament repair in 4 feet (2%) (Fig. 1). No one underwent other bone and soft tissue balance surgery (0%). The surgery most often associated with SA were gastrocnemius lengthening, accessory navicular bone excision, and scarf osteotomy (Fig. 2).
Fig. 1
Number of adjunctive procedures performed
Fig. 2
A 46-year-old male patient with PCFD was treated with SA and scarf osteotomy. And further consultation was made: (A–E): The patient who had bilateral PCFD took a general photo before surgery. The left foot was more serious. The anterior foot abduction, arch collapse and posterior foot ectropion were shown. And weightbearing lateral and anteroposterior X-ray indicated that the angles of foot was abnormal; (F–J): The general view, weightbearing lateral and anteroposterior X-ray showed the deformity correction at 1 year postoperatively
Radiographic and clinical outcome after SAPatients were followed up for 12–36 months, with an average follow-up period of (14.35 ± 6.11) months. Preoperative T1M was 12.73° (7.98, 16.88)°, T2M was 22.56° (15.34, 26.21)°, TNCA was 15.03° (7.67, 23.79)°, Meary’s angle was 10.08° (5.48, 17.91)°, pitch angle was 17.88° (12.14, 22.85)°, and kite angle was 47.00° (38.06, 52.06)°; T1M at the last follow-up after SA was 7.90° (5.04, 12.03)°, T2M was 13.48° (8.76, 20.12)°, TNCA was 5.41° (2.78, 8.75)°, Meary’s angle was 6.23° (3.23, 9.68)°, pitch angle was 20.13° (15.88, 23.75)°, and kite angle was 45.31° (39.55, 49.35)°. Compared with preoperation and the last follow-up after SA, all imaging indicators showed a significant improvement (P < 0.01) (Fig. 3) (Table 1).
Fig. 3
Violin plot of comparison of preoperative and postoperative imaging indicators
Table 1 Comparison of preoperative and postoperative imaging indicatorsCompared with preoperation, the AOFAS score at 3 months and 1 year postoperatively showed significant improvement (P < 0.01). At 1 year postoperatively, there were 109 cases (51.17%) rated as excellent, 104 cases (48.83%) rated as good, 0 cases (0%) rated as fair, and 0 cases (0%) rated as poor, with an excellent-good rate of 100%. The VAS at 3 months and 1 year postoperatively were significantly lower than preoperatively (P < 0.01). There were statistically significant differences in AOFAS scores and VAS between 3 months and 1 year postoperatively (P < 0.05) (Fig. 4) (Table 2).
Fig. 4
Violin plot of comparison of preoperative and postoperative clinical evaluation
Table 2 Comparison of AOFAS score and VAS preoperatively, at 3 months postoperatively and at 1 year postoperativelyRadiographic and clinical outcome after HyProCure removalFor patients who removed HyProCure, a follow-up was conducted for 12–30 months, with an average follow-up period of (19.92 ± 5.87) months. Preoperative T1M was 14.90°(10.60, 17.80)°, T2M was 20.91°(9.55, 26.13)°, TNCA was 16.74°(5.87, 26.33)°, Meary’s angle was 12.55°(10.16, 19.08)°, pitch angle was 15.43°±7.37°, and kite angle was 47.94°(44.57, 51.87)°; T1M at post-SA was 6.79°(4.03, 9.14)°, T2M was 9.66°(7.06, 15.48)°, TNCA was 4.73°(2.48, 6.75)°, Meary’s angle was 6.72°(3.40, 10.30)°, pitch angle was 20.53°±5.58°, and kite angle was 41.19°(38.14, 45.57)°; T1M at post-removal was 6.86°(5.17, 8.09)°, T2M was 10.26°(6.23, 15.63)°, TNCA was 6.31°(3.80, 8.18)°, Meary’s angle was 7.55°(5.82, 9.33)°, pitch angle was 20.95°±3.17°, and kite angle was 43.60°(39.10, 46.22)°. There was no significant difference in all indicators between 6-month post-SA and 1-year post-removal (Fig. 5). Compared with preoperation, T1M, T2M, TNCA in weightbearing anteroposterior X-ray, as well as Meary’s angle and kite angle, showed a significant decrease in weightbearing lateral X-ray after 6-month post-SA and 1-year post-removal, whereas the pitch angle showed a noticeable increase before surgery (P < 0.05). Comparing with 6-month post-SA, the difference in angles at 1-year post-removal was not statistically significant (P > 0.05) (Fig. 6) (Table 3).
Fig. 5
A 28-year-old female patient with AAFD was treated with SA. And further consultation was made: (A) The patient who had PCFD on the right foot took a general photo before surgery. The anterior foot abduction, arch collapse and posterior foot ectropion were shown; (B–C) Before surgery, the weightbearing lateral and anteroposterior X-ray indicated that the angles of foot was abnormal; (D–E) The weightbearing lateral and anteroposterior X-ray showed the deformity correction at 6-month post-SA; (F) The general view showed the foot alignment was satisfactory after 1-year post-removal, and no flatfoot recurrence was found; (G–H) The weightbearing lateral and anteroposterior X-ray showed the angles was maintained well with no significant change at 1-year post-removal
Fig. 6
Violin plot of comparison of imaging indicators in HyProCure removal patients
Table 3 Comparison of angles, AOFAS score and VAS in HyProCure removal patientsCompared with preoperation, AOFAS score at 6-month post-SA and 1-year post-removal were significantly improved (P < 0.05). There were 0 excellent cases (0%), 19 good cases (52.78%), 17 acceptable cases (47.22%), and 0 poor cases (0%), resulting in an excellent and good rate of 52.78% preoperatively. At 6-month post-SA, there were 0 excellent cases (0%), 35 good cases (97.22%), 1 acceptable case (2.78%), 0 poor cases (0%), leading to an excellent and good rate of 97.22%. At 1-year post-removal, there were 13 excellent cases (36.11%), 23 good cases (63.89%), 0 acceptable cases (0%), and 0 poor cases (0%), resultinf in an improved excellent and good rate of 100%. Compared with preoperation, there was no statistically significant difference in VAS at 6-month post-SA (P > 0.05). However, when compared with preoperation and 6-month post-SA, VAS was significantly decreased at 1-year post-removal (P < 0.05) (Fig. 7) (Table 3).
Fig. 7
Violin plot of comparison of AOFAS score and VAS in HyProCure removal patients
ComplicationsIn this study, there were 58 cases of complications after SA, with an incidence of 27.23%. 53 cases (24.88%) experienced sinus tarsi pain. Achilles tendon tension occurred in 2 cases (0.94%). Muscle strength decreased in 1 case (0.47%). 1 case (0.47%) had poor wound healing. Foreign body sensation occurred in 1 case (0.47%). The incidence of sinus tarsi pain was the highest among all complications, accounting for 91.37%.
For patients who removed HyProCure, there were 1 case of complication, resulting in an incidence of 2.78%. The patient had a poor wound healing, which resolved after dressing changes. There were no instances of vascular or nerve injury, and no patient reported recurrence of sinus tarsi pain following the removal of HyProCure.
Comments (0)