
Remember me
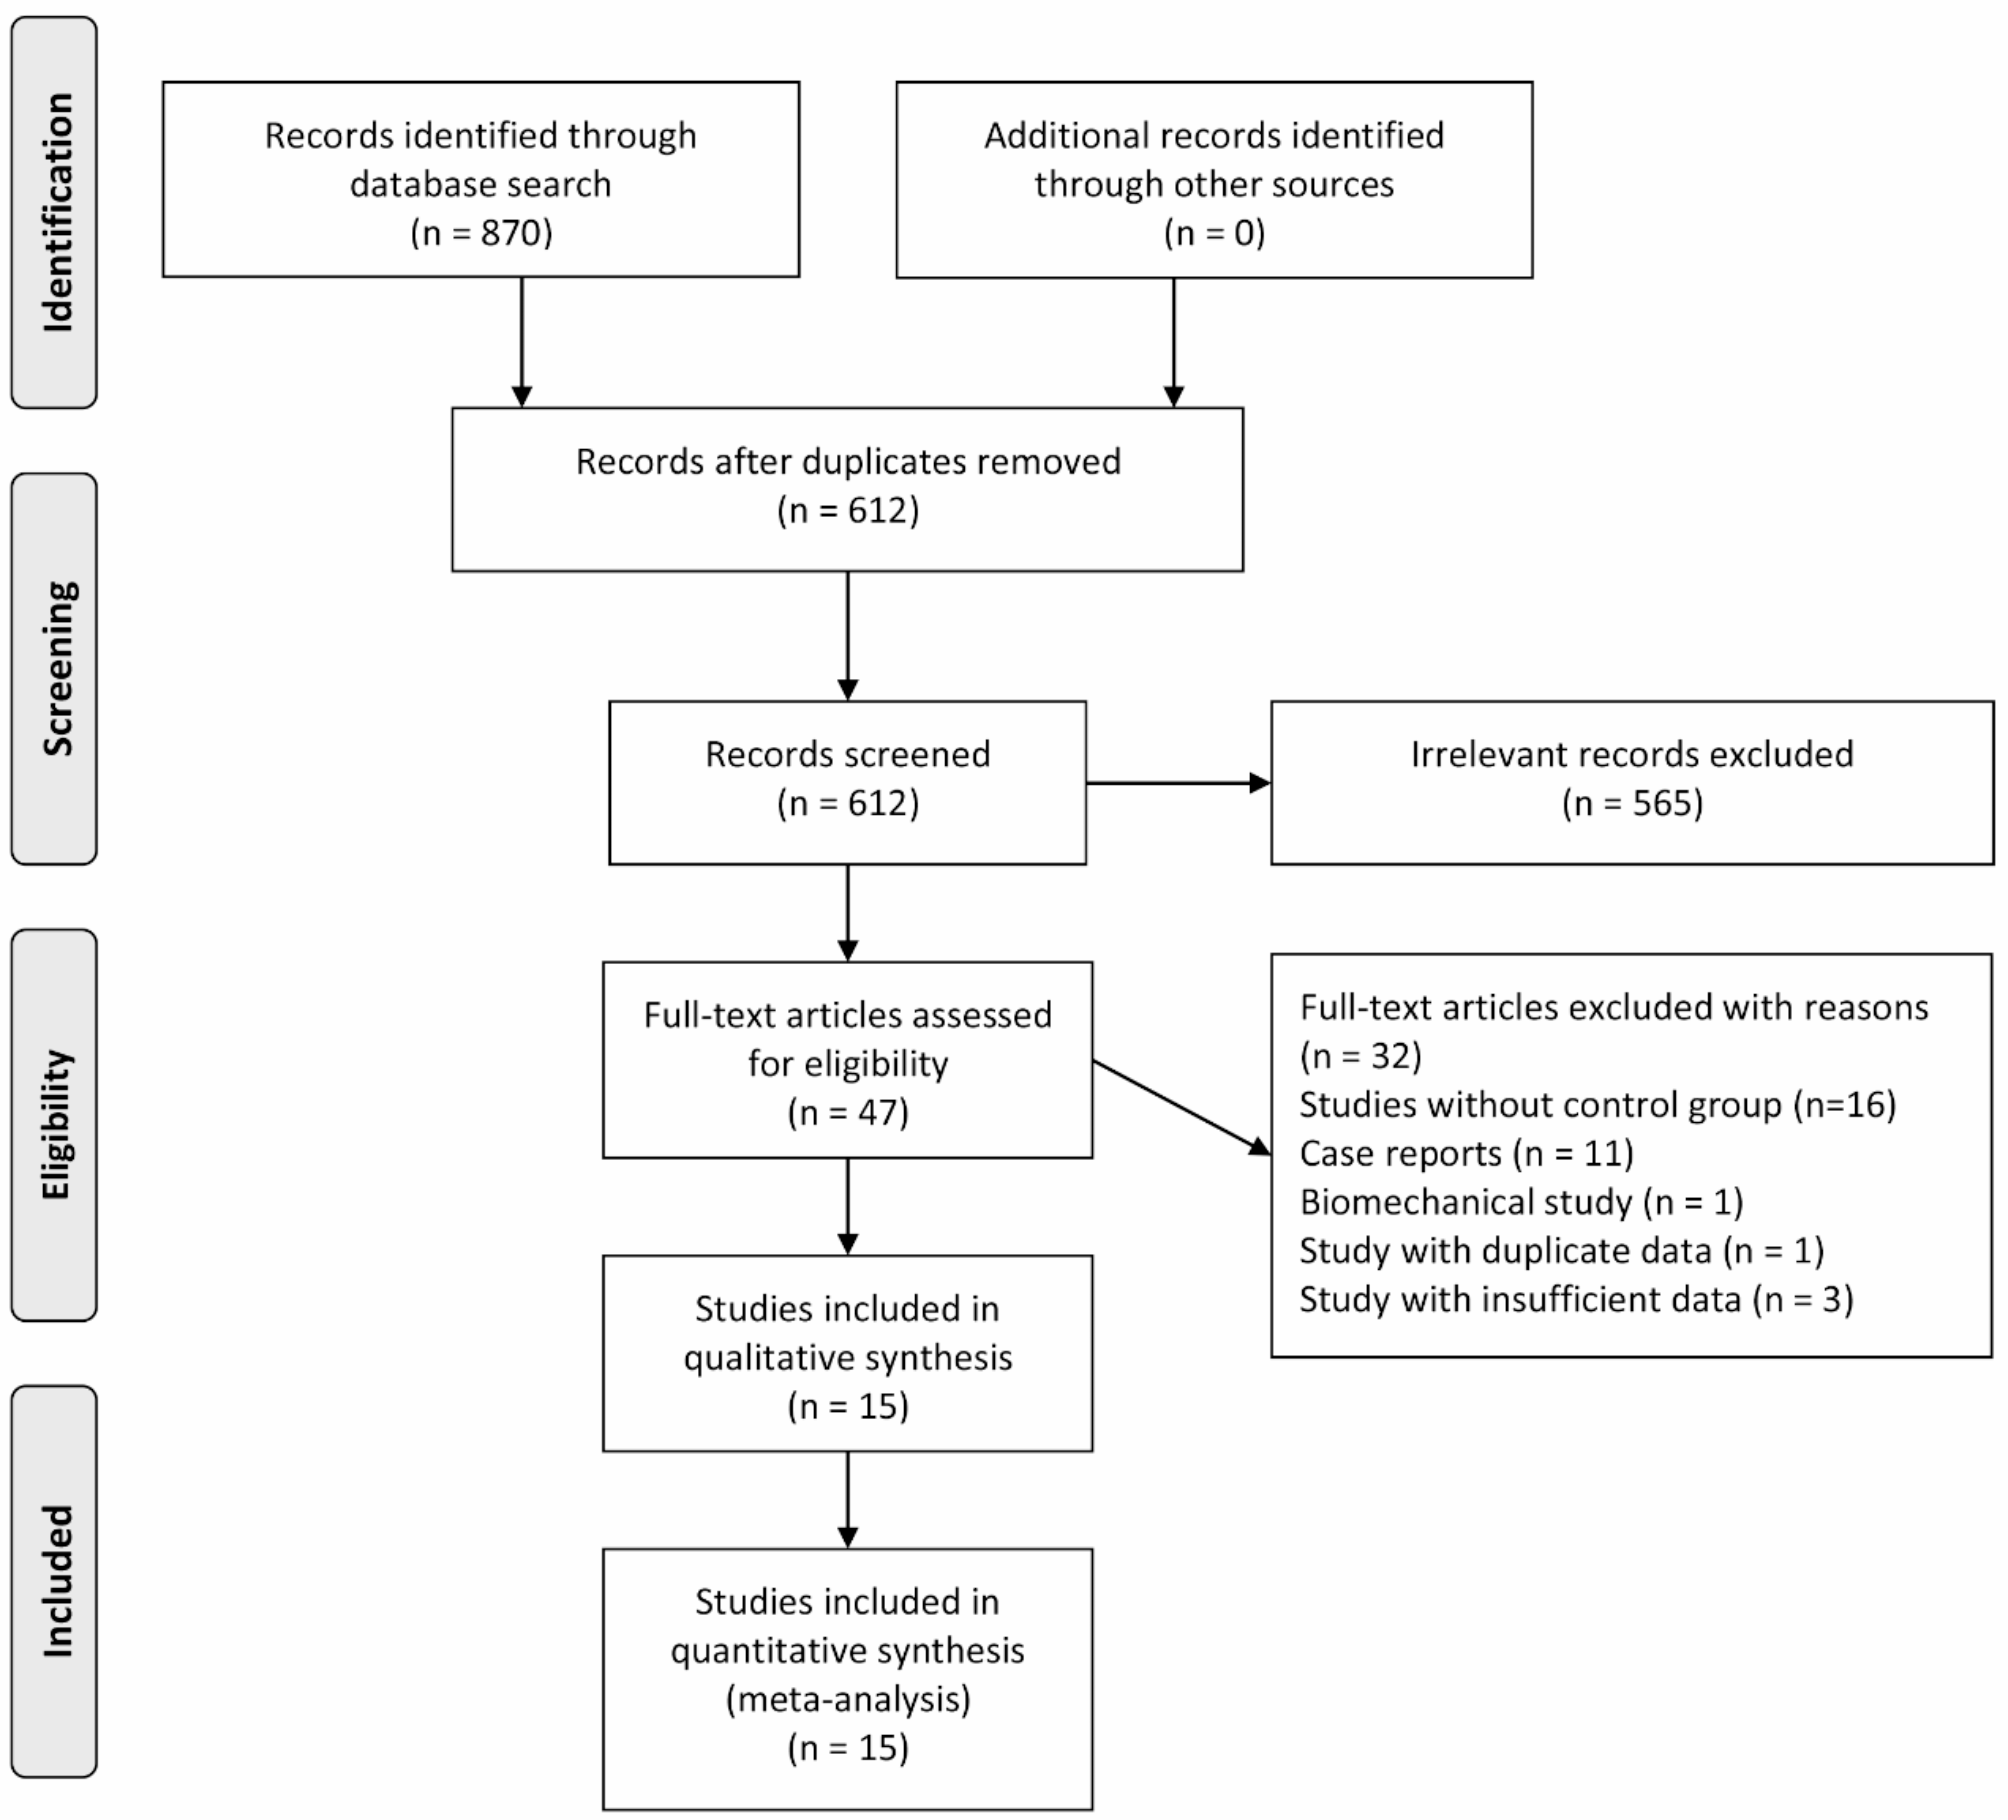


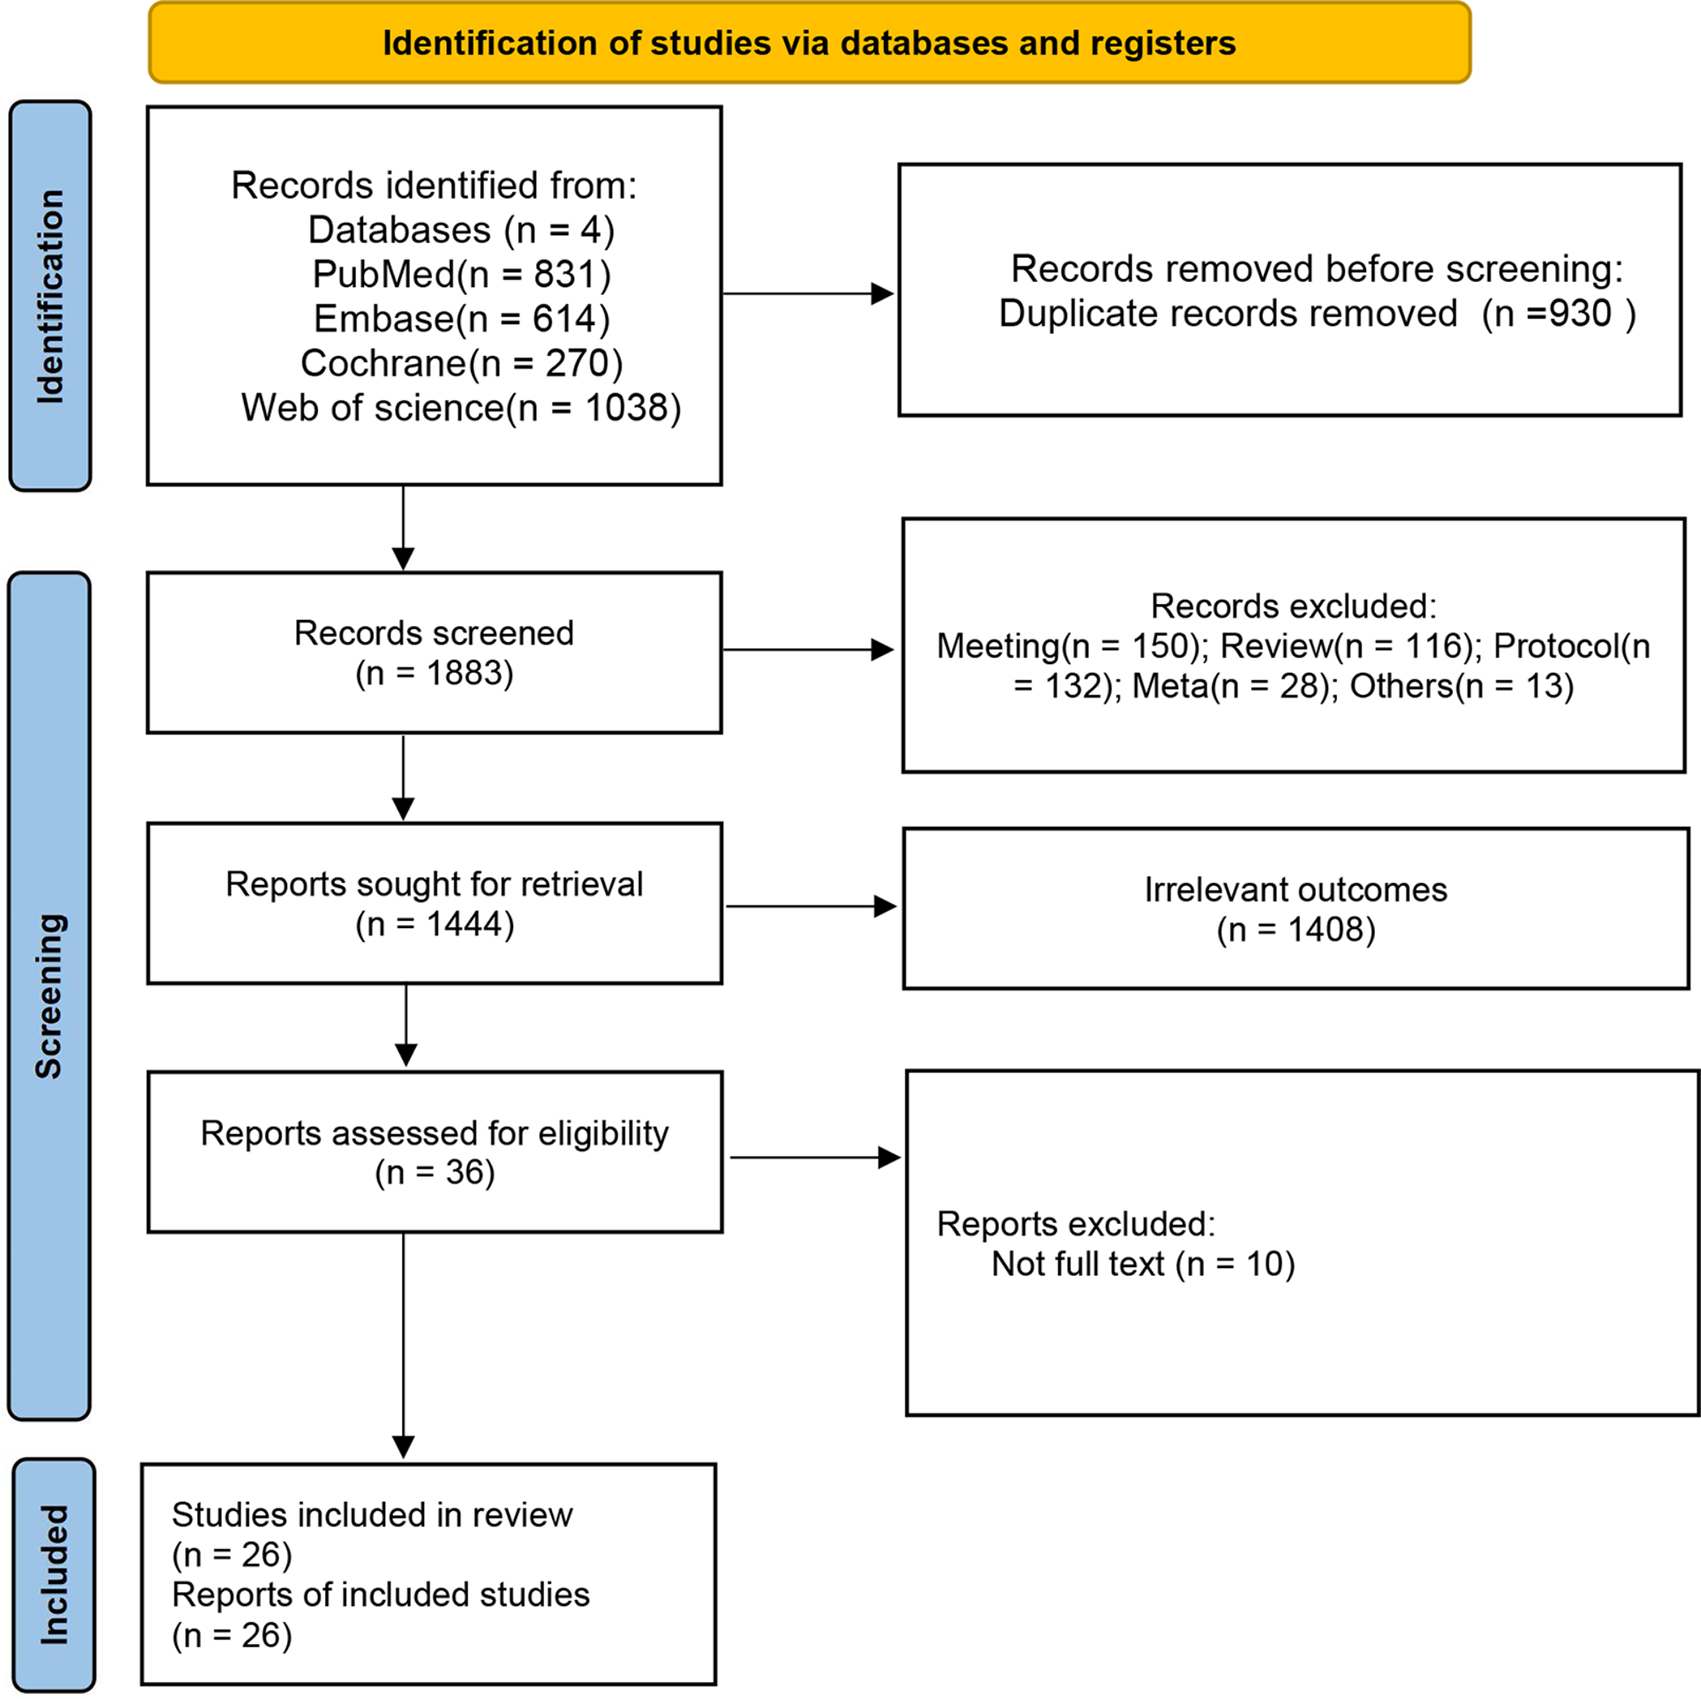
A comprehensive search of six databases yielded 870 relevant articles: 316 from PubMed, 369 from Web of Science, 123 from EMBASE, 1 from the Cochrane Library, 26 from CNKI, and 35 from Wanfang Data. No additional studies were identified through manual reference checks. One study, published in Russian, could not be accessed, and attempts to contact the author via email were unsuccessful. After removing duplicates and screening the titles and abstracts, the remaining articles underwent a full-text evaluation. Ultimately, 15 articles [6, 8,9,10,11,12,13,14,15,16,17,18,19,20,21] met the inclusion criteria and were included in the meta-analysis. The detailed literature screening process is presented in Fig. 1.
Fig. 1
Flowchart of literature selection
Basic characteristics of included studiesFifteen cohort studies were included, with 11 published in English and 4 in Chinese. In total, 943 participants were involved: 488 patients in the MIS group and 455 in the OS group. Among these, the study by Jiang et al. [18] was a prospective cohort, while the others were retrospective. The studies were conducted across several countries, including China, the United States, South Korea, France, Germany, and Portugal. The study quality evaluation showed that all studies scored at least 6 points, indicating good quality. Detailed characteristics of the included studies are summarized in Table 1.
Table 1 Main characteristics of included studiesResults of meta-analysisSurgery durationThirteen studies [8,9,10,11,12,13,14,15, 17,18,19,20,21] reported surgery duration, involving 315 participants in the MIS group and 348 in the OS group. Significant heterogeneity was noted among these studies (P < 0.01, I² = 96%), necessitating the use of a random-effects model. The pooled data suggested that the MIS group had a shorter surgery duration than the OS group, but the difference was not statistically significant (MD = -28.67, 95% CI -58.58 to 1.23, P = 0.06, Fig. 2).
Fig. 2
Forest plot of minimally invasive surgery versus open surgery for surgery duration
Estimated blood lossEleven studies [8,9,10,11,12, 14, 15, 17,18,19, 21] reported estimated blood loss, involving 226 participants in the MIS group and 266 in the OS group. High heterogeneity was present (P < 0.01, I² = 89%), so a random-effects model was applied. The results indicated that the MIS group experienced significantly less blood loss than the OS group (MD = -76.73, 95% CI -102.56 to -50.91, P < 0.01, Fig. 3).
Fig. 3
Forest plot of minimally invasive surgery versus open surgery for estimated blood loss
Incision lengthThree studies [17, 20, 21] reported incision length, involving 121 participants in the MIS group and 107 in the OS group. Due to substantial heterogeneity (P < 0.01, I² = 82%), a random-effects model was used. The MIS group had significantly shorter incisions than the OS group (MD = -4.09, 95% CI -5.20 to -2.97, P < 0.01).
VAS scoreSix studies [14, 17,18,19,20,21] reported VAS pain scores, including 203 participants in the MIS group and 183 in the OS group. The analysis revealed considerable heterogeneity (P < 0.01, I² = 89%), prompting the use of a random-effects model. The pooled results demonstrated that the MIS group had significantly lower VAS scores than the OS group (MD = -0.79, 95% CI -1.48 to -0.11, P = 0.02).
Time to mobilizationThree studies [17, 19, 20] reported the time from surgery to first mobilization, including 139 participants in the MIS group and 121 in the OS group. High heterogeneity was noted (P < 0.01, I² = 94%), necessitating the use of a random-effects model. The analysis showed that the MIS group had a significantly shorter time to mobilization than the OS group (MD = -4.27, 95% CI -5.12 to -3.43, P < 0.01).
Length of hospitalizationTwelve studies [6, 9,10,11,12, 14, 15, 17,18,19,20,21] reported the length of hospitalization, involving 430 participants in the MIS group and 381 in the OS group. Considerable heterogeneity across studies was detected (P < 0.01, I2 = 88%), and a random-effects model was applied. The pooled data indicated that the MIS group had a significantly shorter hospital stay than the OS group (MD = -3.76, 95% CI -4.82 to -2.70, P < 0.01).
Gross total resectionSeven studies [8,9,10,11, 14,15,16] reported the gross total resection, involving 120 participants in the MIS group and 152 participants in the OS group. No between-study heterogeneity was detected (P < 0.99, I² = 0), and a fixed-effects model was applied. The pooled data indicated that there was no significant difference in the gross total resection rate between two groups (RR = 1.00, 95% CI 0.94 to 1.07, P = 0.92).
Blood transfusionThree studies [8, 9, 19] examined the blood transfusion, including 102 participants in the MIS group and 96 in the OS group. With no observed heterogeneity (P = 0.88, I² = 0), a fixed-effects model was applied. Although the pooled results suggested a lower incidence of blood transfusion in the MIS group, the difference was not statistically significant (RR = 0.23, 95% CI 0.05 to 1.04, P = 0.06).
CSF leakageSeven studies [6, 8,9,10,11,12, 21] reported the incidence of CSF leakage, involving 227 participants in the MIS group and 244 in the OS group. No heterogeneity was observed (P = 0.67, I² = 0), and a fixed-effects model was therefore used. The pooled data indicated a reduced incidence of CSF leakage in the MIS group, though the difference did not reach statistical significance (OR = 0.50, 95% CI 0.24 to 1.04, P = 0.07).
Total complicationsTen studies [6, 8,9,10,11,12, 14, 16, 18, 21] reported the overall complication rates, including 327 participants in the MIS group and 286 in the OS group. With no heterogeneity detected (P = 0.49, I² = 0), a fixed-effects model was utilized. The findings revealed a significantly lower overall complication rate in the MIS group than the OS group (RR = 0.49, 95% CI 0.33 to 0.73, P < 0.01).
Sensitivity analysis and publication biasSensitivity analyses confirmed that most results were stable, supporting their reliability. However, VAS scores proved sensitive to the inclusion of the study by Lu et al. [14], which showed notably larger difference between MIS and OS groups than other studies. Excluding this study led to stabilized VAS results, suggesting it was an outlier impacting the initial findings. Funnel plots for all outcomes showed no significant asymmetry, indicating no major publication bias (Fig. 4).
Fig. 4
Funnel plot of minimally invasive surgery versus open surgery for surgery duration
Comments (0)