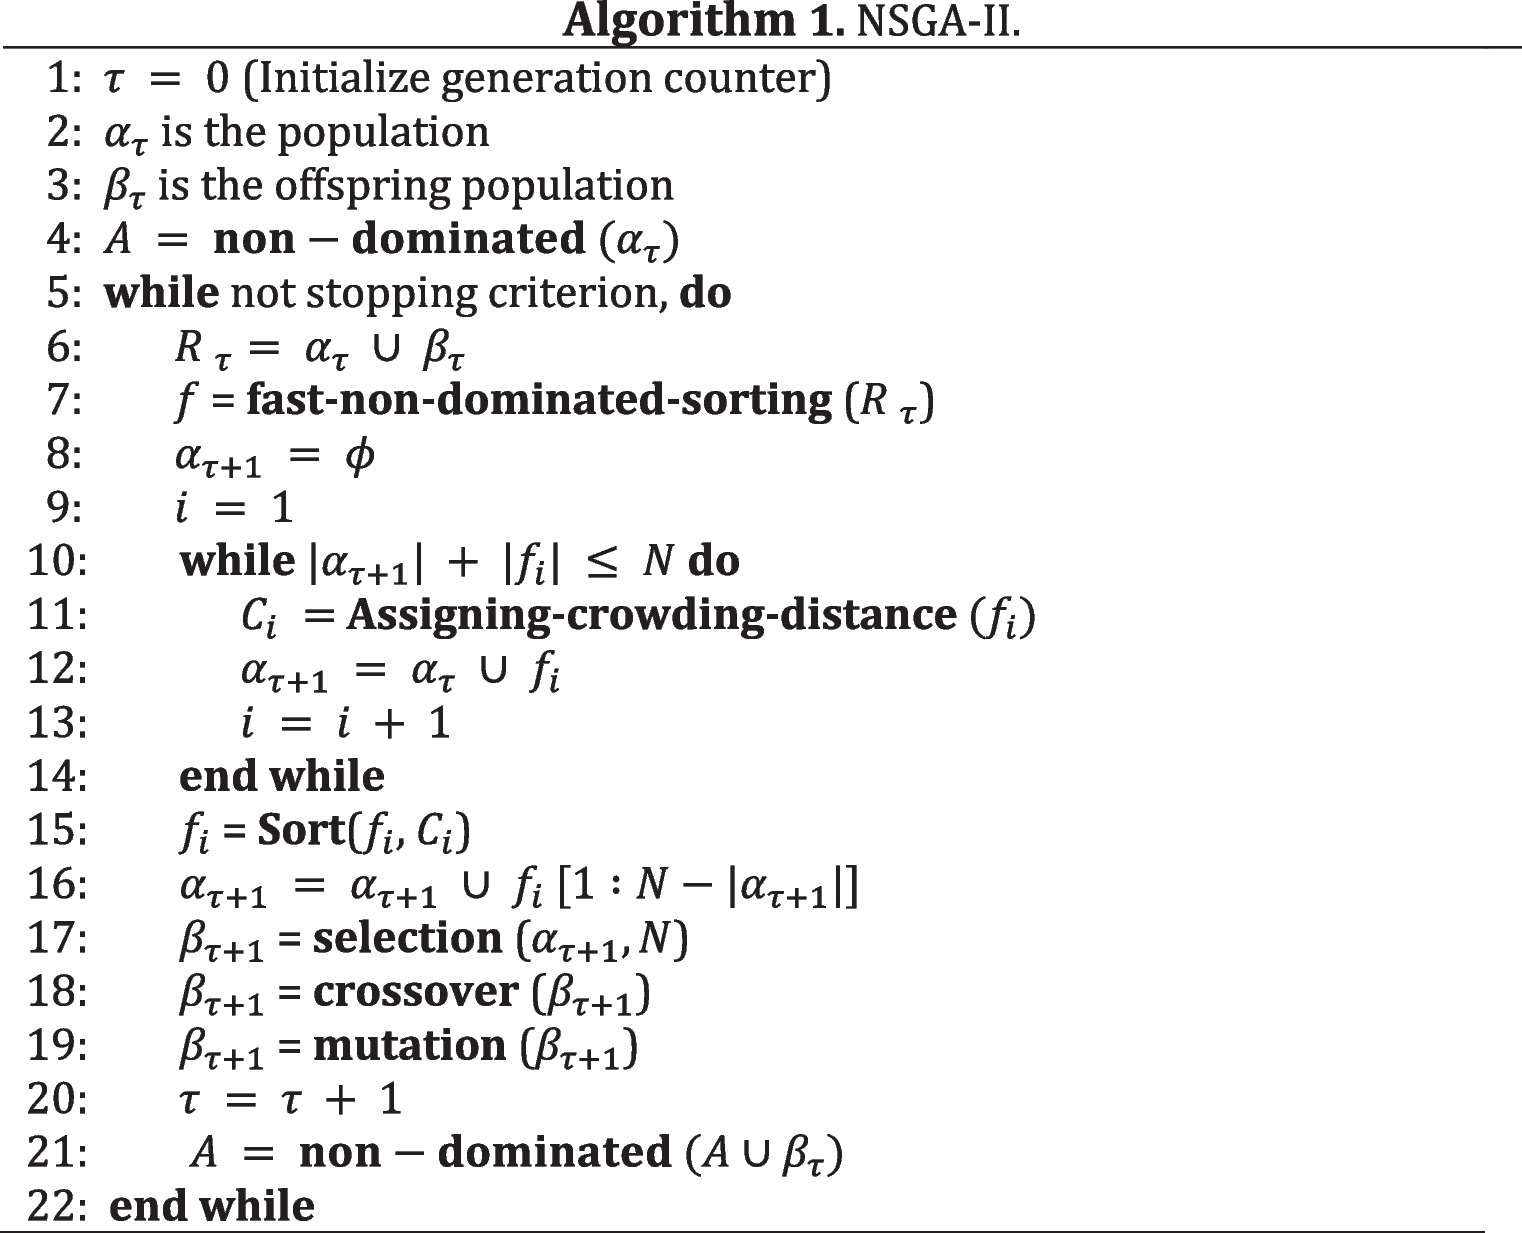
3.1 Methods
This study used the ADAS-Cog−13, a standard clinical tool for assessing cognitive dysfunction [14], comprising 13 tasks spanning memory, language, praxis, and orientation. It is scored from 0 to 85, with higher scores indicating greater impairment. While its sensitivity in early dementia is debated [20], it remains widely used. Prior work identified a cut-off score ≥ 12 as optimal for AD detection, with 89.2% sensitivity and 88.5% specificity [33]. To evaluate cognitive item relationships, we performed a feature-to-feature correlation analysis using Pearson’s r, excluding the target class. This approach has been successfully applied in previous dementia-related studies [e.g., 34, 35, 18, 19] and highlights redundant features by identifying items with high intercorrelations (r near ± 1), allowing us to focus on distinct contributors to dementia progression. Results were mapped to DSM-5 cognitive domains to ensure broad domain coverage during feature selection.
We conducted a feature-to-feature assessment (excluding the target class) to explore inter-item relationships among ADAS-Cog-13 cognitive tasks. This analysis identifies highly correlated items that may convey redundant information regarding disease progression, allowing for dimensionality reduction. When two features exhibit strong correlation, their contribution to classification is likely similar, and one may be omitted without loss of predictive value. Cognitive items were also mapped to DSM-5 domains to ensure broad diagnostic coverage during feature selection.
We computed Pearson correlation coefficients between features, summarised in matrix form. This highlights similarities across tasks and supports identification of distinctive, diagnostically relevant items. The correlation coefficient r, which ranges from − 1 to + 1, was calculated as:
$$\:r=\frac_^\left(_-\overline\right)\left(_-\overline\right)}_^_-\overline\right)}^}\sqrt_^_-\overline\right)}^}}$$
(1)
.
where n is the number of observations, x and y are feature values, and \(\underset$}}\to \) and \(\underset$}}\to \) are their respective means. Higher absolute values of r indicate stronger linear dependence between features.
We also applied Permutation Feature Importance (PFI) [36] to quantify the influence of each ADAS-Cog item. PFI estimates the drop in model accuracy when a feature is randomly shuffled, revealing its predictive value. We implemented PFI using two classifiers: DT (C4.5) and LR, both chosen for their differing learning approaches and interpretability in medical research. To complement PFI, we used Mutual Information (MI) [37], a measure of non-linear dependence between each cognitive feature and the class label. MI is calculated as:
$$\:MI(X,Y)=_^p(x,y)\cdot\:log\left(\frac\right)$$
(2)
where p(x, y) is the joint distribution of features X and Y. Higher MI values indicate stronger relevance for classification. All analyses were implemented in Python via Google Colab using the Scikit-learn library for model construction, PFI, and MI experiments. This computational setup ensured reproducibility and scalability across multiple dementia progression cohorts.
3.2 Data and Preparation
This study used data from the ADNI data repository [38], specifically the ADNI-Merge and ADAS-Cog-13 datasets. ADNI-Merge aggregates data across several ADNI phases (ADNI-1, GO, 2, and 3), and includes a wide range of participant data such as demographics, clinical diagnoses, neuropsychological assessments, functional questionnaires, genetic markers (e.g., APOE status), and biomarker data from structural MRI and PET imaging. The ADAS-Cog-13 dataset contains scores for 13 individual cognitive tasks measuring memory, language, praxis, and orientation. Table 1 displays the basic statistics related to the ADNI-Merge, and ADAS-Cog datasets. There is one target class in the ADNI-Merge dataset, which is the diagnosis of the last examination visit (DX); another attribute that can be considered important is the baseline diagnosis (DX_bl), which denotes the initial diagnosis given to the patient at the first visit.
To investigate cognitive changes during the progression of dementia, we created two longitudinal sub-cohorts by merging the ADAS-Cog-13 scores with diagnostic data from ADNI-Merge:
The CN to MCI cohort consists of participants who were diagnosed as cognitively normal (CN) at their baseline visit but later progressed to mild cognitive impairment (MCI) within a 36-month follow-up period.
The MCI to AD cohort includes participants who were diagnosed with MCI at baseline and subsequently progressed to Alzheimer’s disease (AD) over the same timeframe.
To construct these sub-cohorts, we first unified the ADAS Sub-Scores and Total Scores datasets from the various ADNI phases to ensure full coverage of ADAS-Cog-13 items. We then left-joined this cognitive data with the ADNI-Merge dataset based on unique participant IDs (RID) and visit codes (VISCODE). Visits were excluded if either the diagnosis or ADAS-Cog scores were missing. Importantly, we only retained participants who demonstrated diagnostic progression (from CN to MCI or from MCI to AD) and excluded all visits that occurred after the progression point to avoid conflating pre- and post-progression cognitive data.
Table 1 General statistics of the datasets before Pre-processing
After these exclusions, the resulting CN to MCI dataset consisted of 141 participants contributing 744 observations (visits), while the MCI to AD dataset comprised 385 participants and 1,765 observations. However, in both datasets the majority of observations represented no change in diagnosis. For example, only 73 of the 1,695 visits in the CN to MCI dataset (about 4.3%) indicated progression, while 207 of 3,275 visits in the MCI to AD dataset (6.3%) reflected diagnostic change. This large class imbalance posed a risk of biased model training and reduced classification performance. To address this, we applied the Synthetic Minority Over-Sampling Technique (SMOTE) [39], using the UBL package for R [40] with k = 5 nearest neighbours. SMOTE generates synthetic examples of minority class instances (i.e., those showing progression) based on feature space similarity, resulting in more balanced datasets suitable for machine learning analysis. After resampling, the CN to MCI cohort included 3,198 observations, with approximately 49.3% progression cases, while the MCI to AD cohort included 5,982 observations, with 48.7% progression cases. Table 2 displays the statistics of the participant groups for 36 months from the baseline visit and for different dementia stages.
During dataset preparation, we identified a small number of regression cases, in which participants appeared to revert to a less severe diagnosis over time (e.g., MCI to CN or AD to MCI). Specifically, 20 regression cases were found in the CN to MCI cohort and 16 in the MCI to AD cohort (labelled ‘-1’). These were excluded from analysis because they represent atypical patterns that fall outside the scope of this study, which focuses exclusively on forward disease progression. These balanced cohorts provided the basis for the feature correlation, importance ranking, and classification analyses reported in the following sections.
Table 2 General statistics for the groups of participants within 36 months from the baseline and for different dementia stages3.3 Analysis method
The analyses were conducted using Python [41] using hyperparameters of the feature selection method that were unchanged. We assessed the feature-to-feature correlation within the datasets and identified highly correlated items in order to derive influential features from the ‘ADNI-Merge-ADAS-Cog’ dataset. Feature-feature correlation matrices with coefficients indicating the strength between two items were created to identify highly correlated features by calculating the largest mean absolute correlation between each item to remove any redundant features. Pearson correlation was used to generate a correlation matrix of the data’s features as a vector of integers to reduce independent attributes’ correlations. When two attributes are highly correlated, the function evaluates the correlation of the mean absolute value for each attribute and drops the one with the greatest value. The suggested Cut-off = 0.60 [42]. For data balancing the SMOTE algorithm was used to sample the minority class labels in the dataset. SMOTE is a data sampling technique that adjusts the class distribution by taking the entire dataset as input, thereby increasing the minority class using K Nearest Neighbours (KNN) [43].


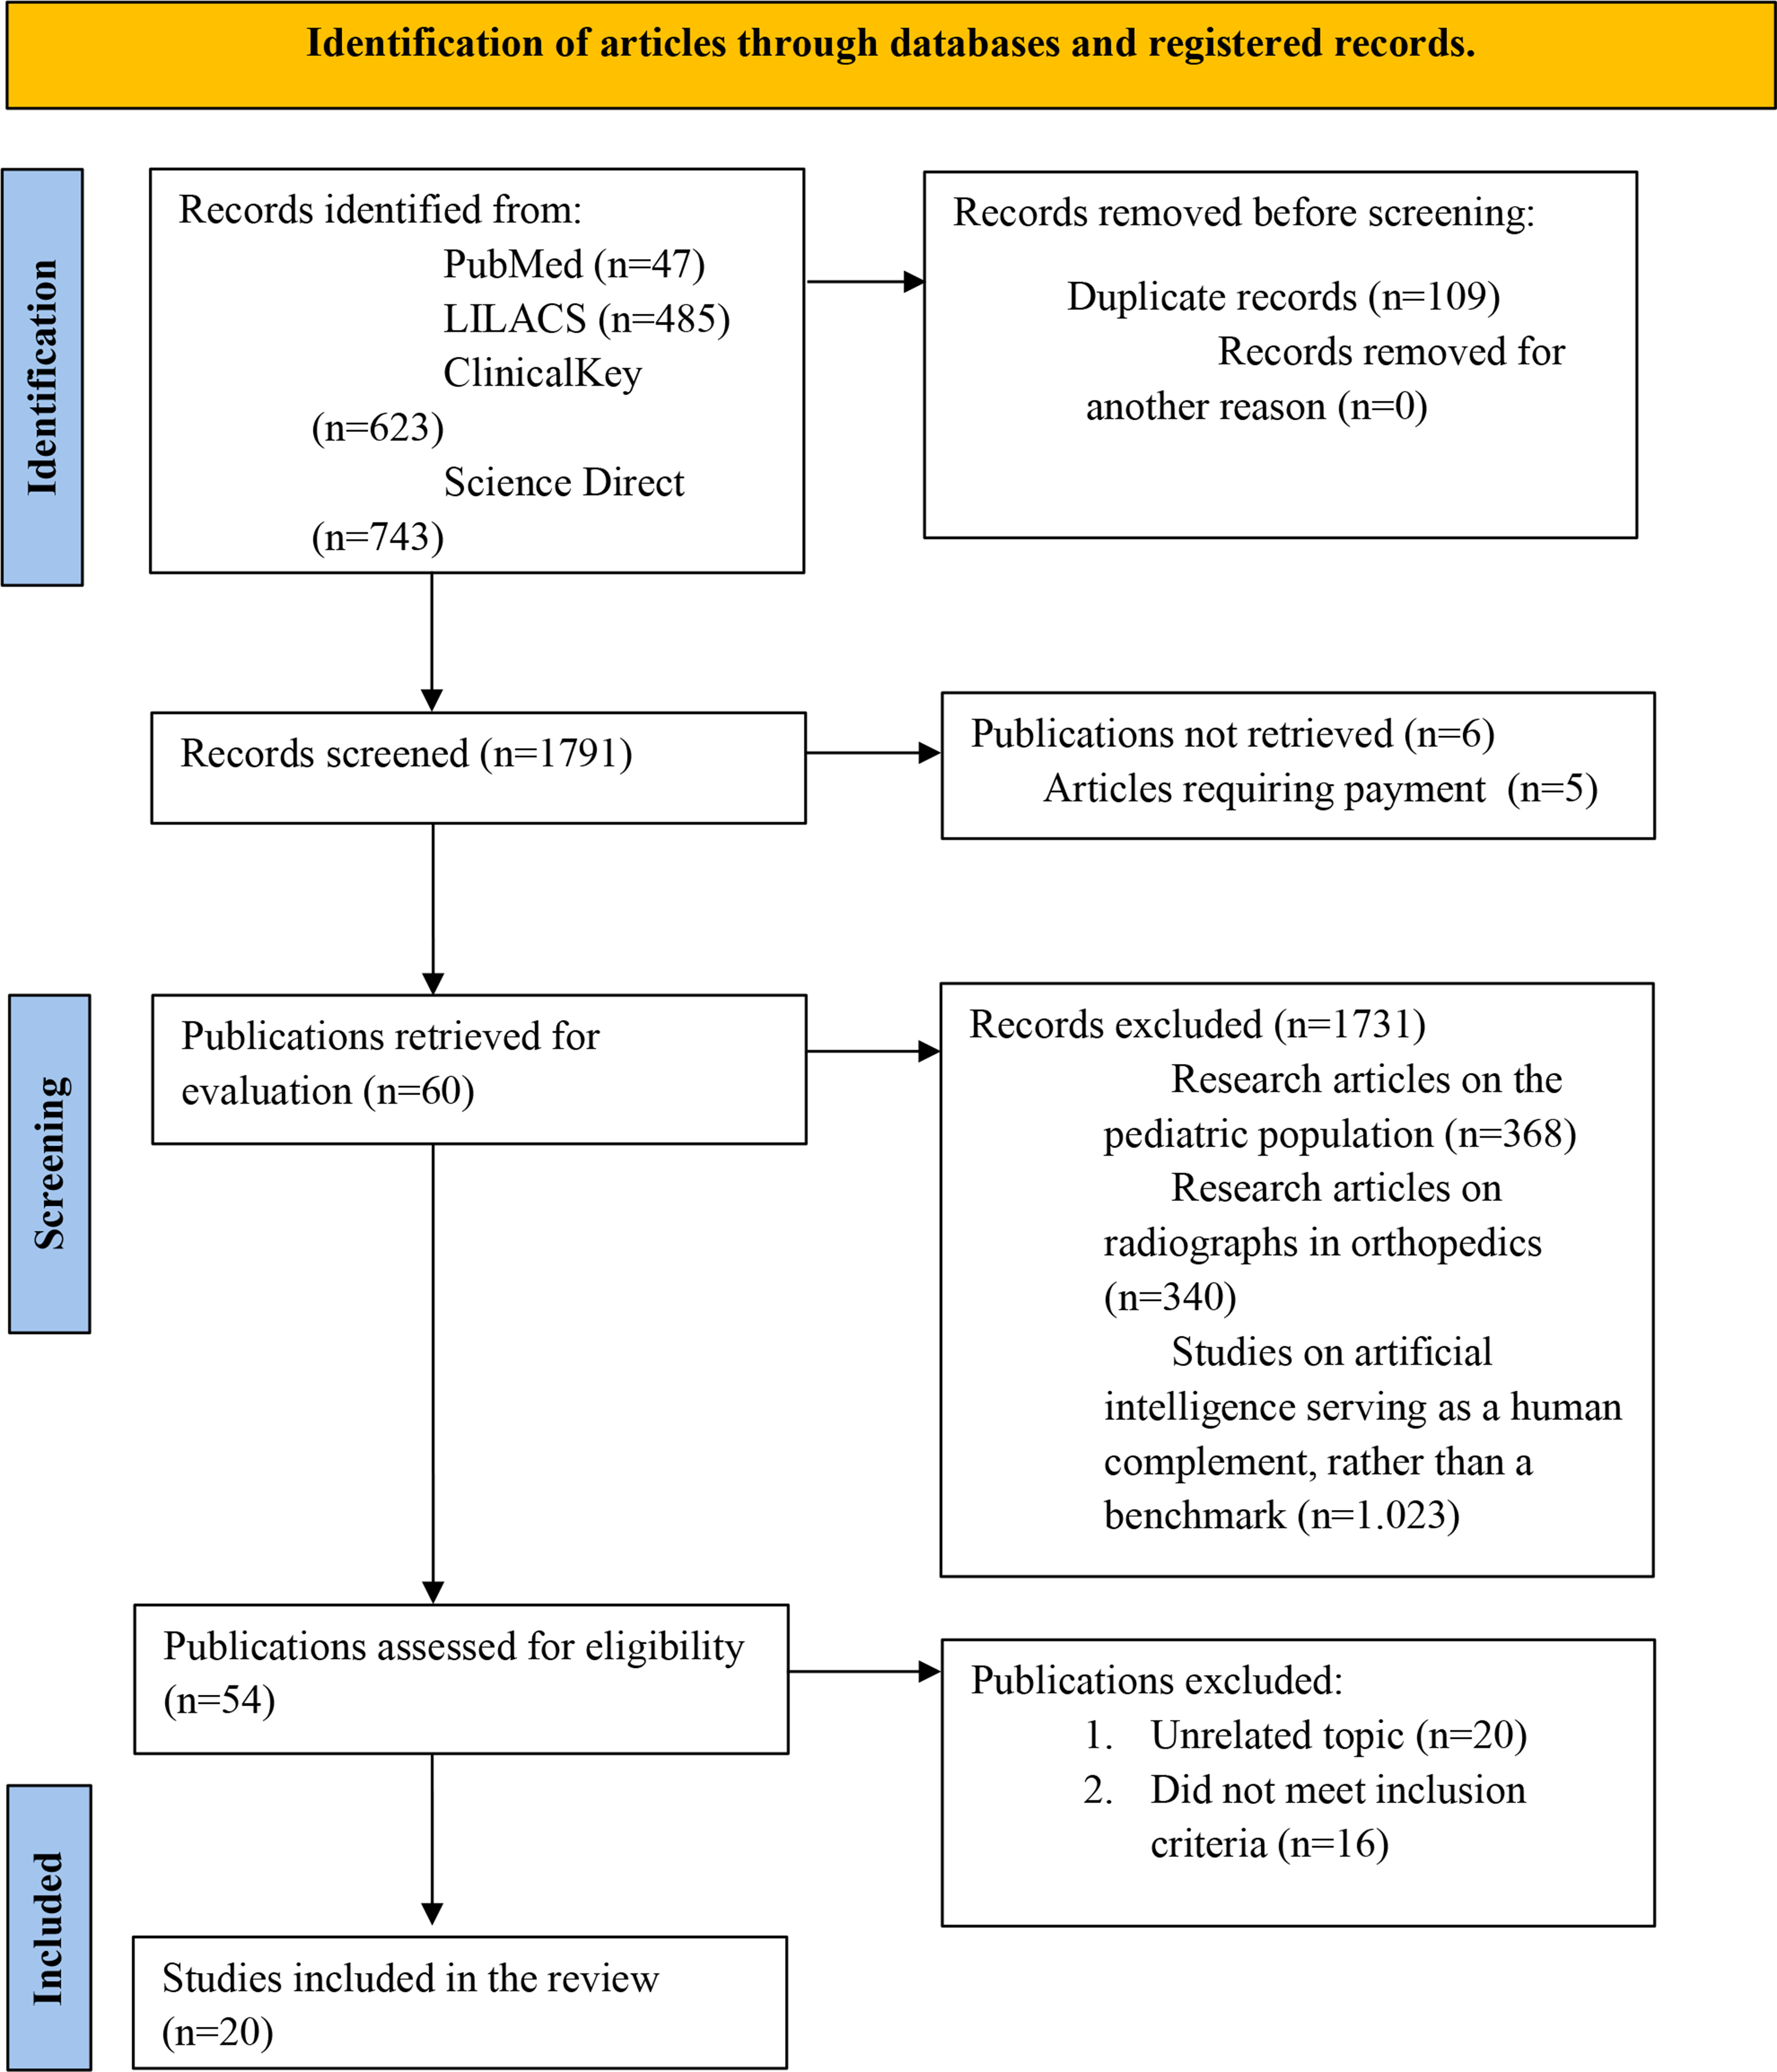
Comments (0)