
Remember me


This study integrated cross-sectional and longitudinal designs using data from the CHARLS [18]. As a nationally database, CHARLS collects health status and socioeconomic characteristics data among populations aged 45 years or above through standardized protocols, thereby providing robust interdisciplinary support for aging-related research. Researchers employed multistage probability-proportional-to-size (PPS) sampling strategy, which covered 150 counties or urban districts across 28 provinces. Initiated in 2011, the project has released four waves of follow-up data in 2013, 2015, 2018, and 2020. The study protocol was approved by the Biomedical Ethics Committee of Peking University (Approval: IRB00001052-11015), and written informed consent was obtained from all participants before data collection.
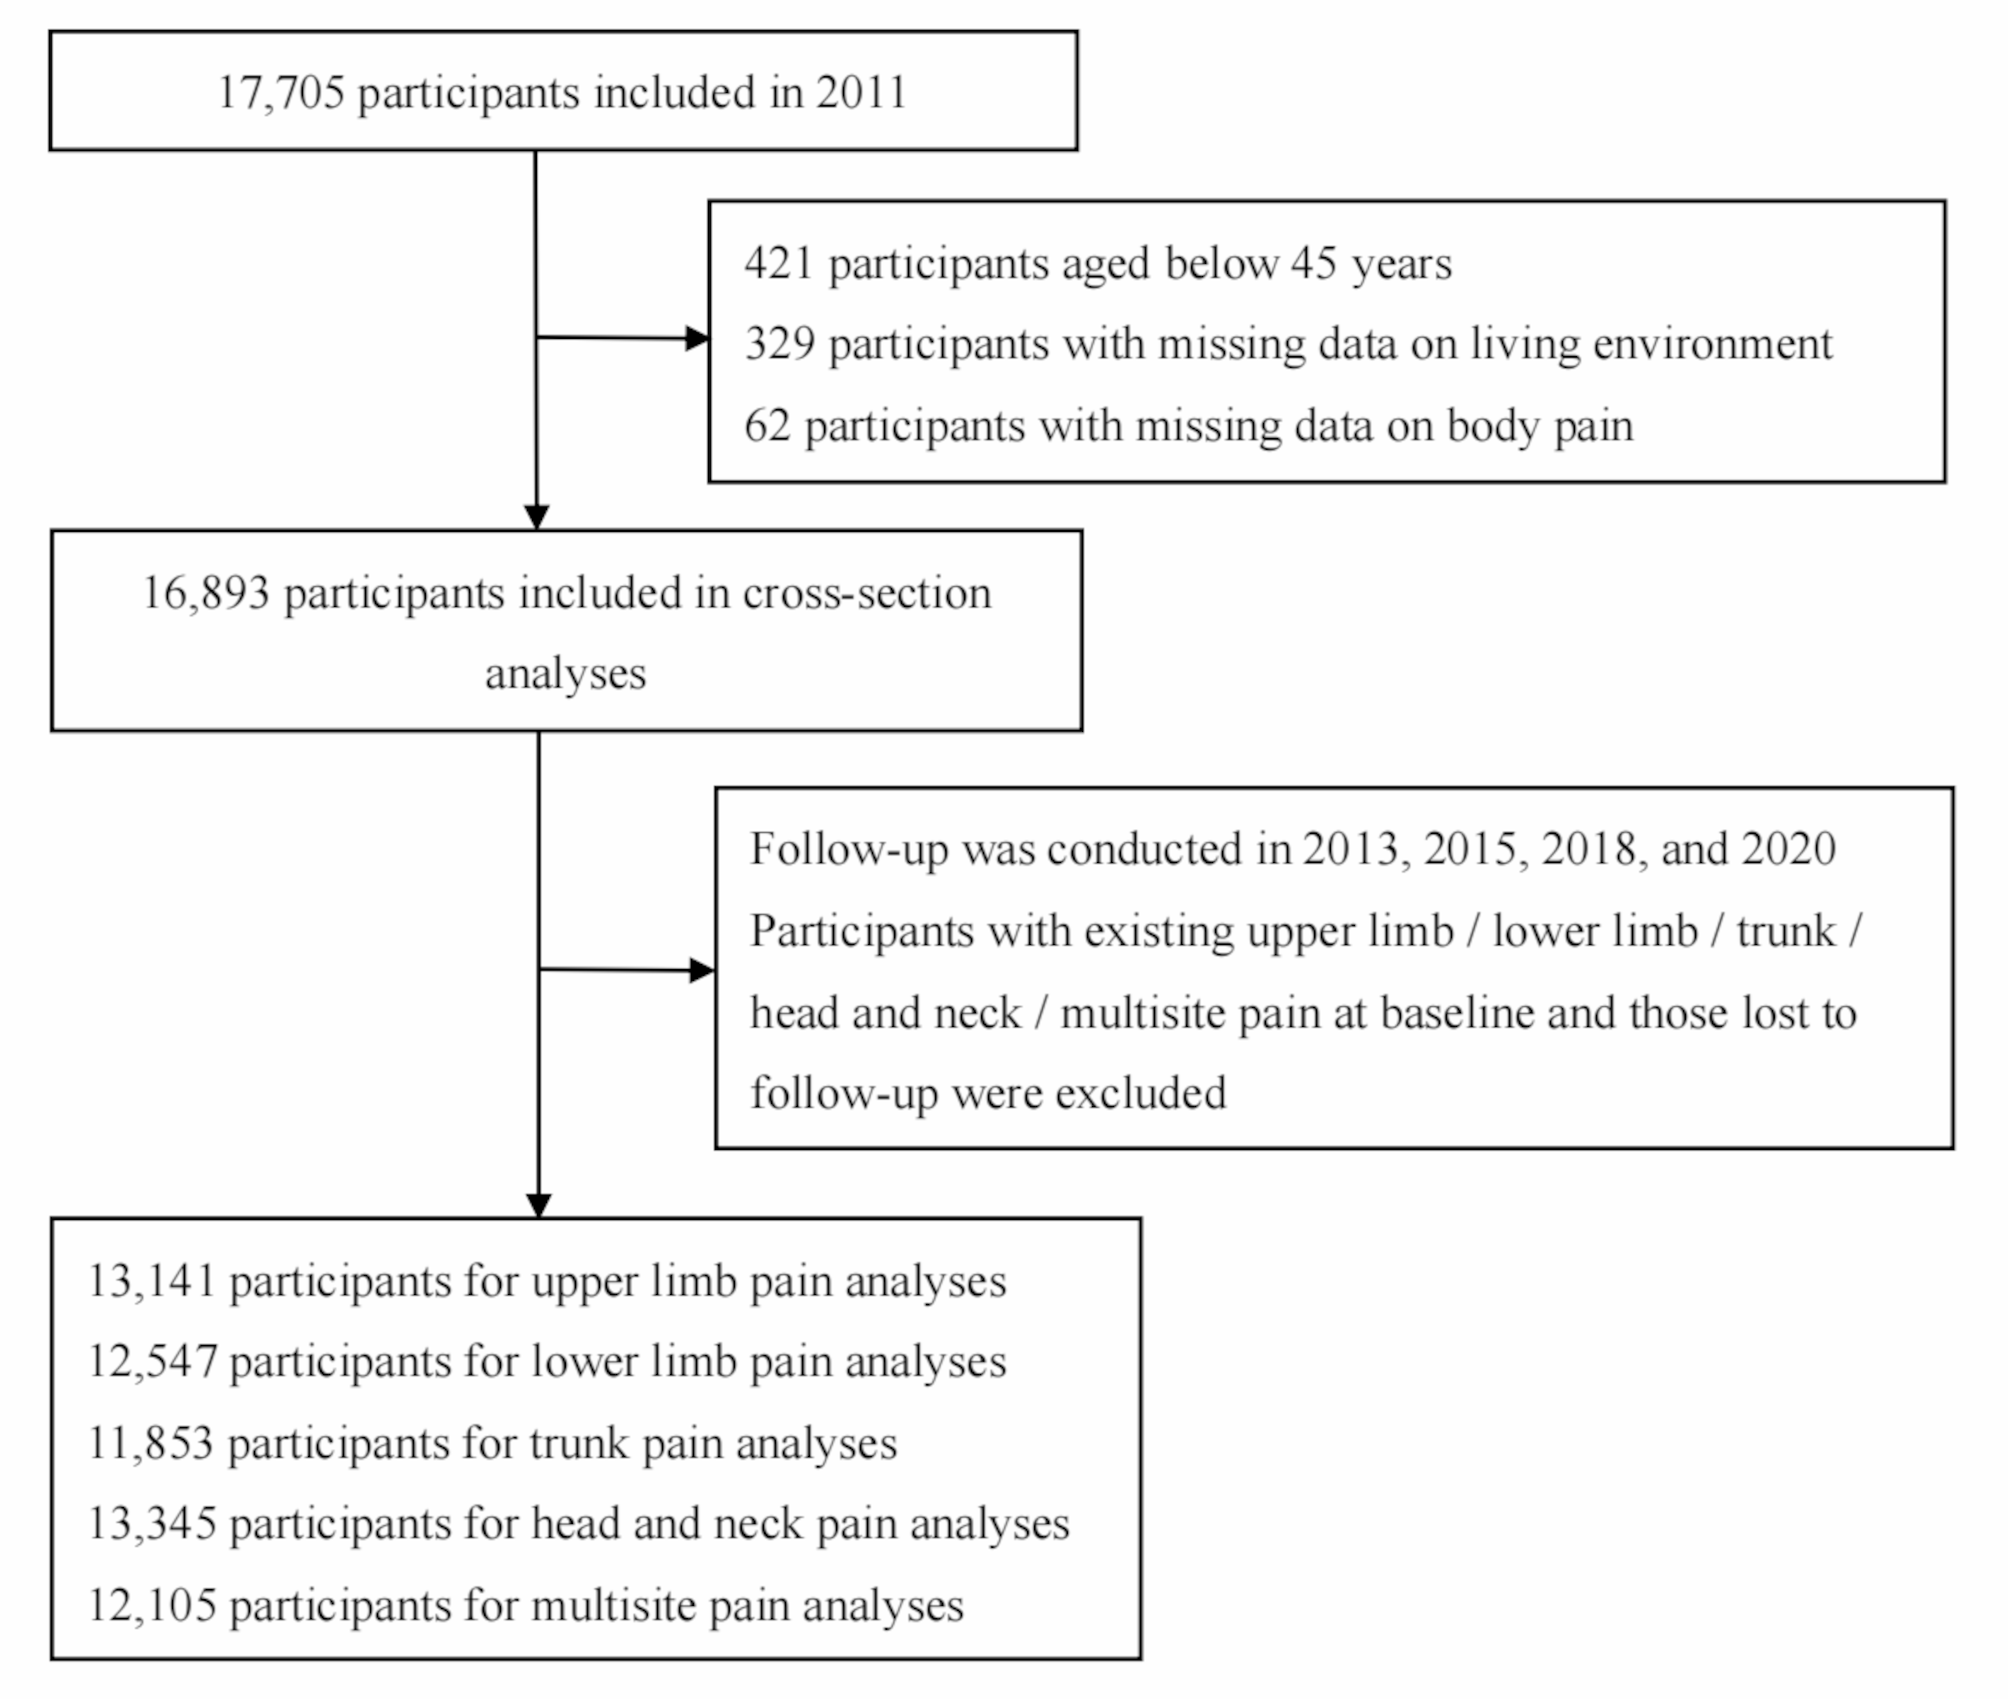
In this study, baseline data were used to assess environmental exposures and pain status (2011). Pain outcomes—including upper limb, lower limb, trunk, head-and-neck, and multisite pain—were tracked through four waves of follow-up data (2013–2020). For cross-sectional analyses, we excluded 421 participants aged below 45 years, 329 with missing environmental data, and 62 lacking pain-related information, resulting in a sample of 16,893 participants. In longitudinal analyses, individuals with pain at baseline and those missing follow-up data were further excluded. The final participant selection process is illustrated in Fig. 1.
Fig. 1
Flow diagram for participants included in the study
Assessment of living environmental qualityLiving environmental quality was assessed through five core indicators: building types, household temperatures, water sources, energy sources for cooking and heating, and outdoor PM2.5 exposure [19,20,21]. The scoring method and algorithm have been detail tabulated in Table S1, each environmental factor was dichotomously coded as follows: (1) Building types: multi-story structures = 0, single-story structures = 1; (2) Household temperatures: categorized based on interviewer-subjective evaluation as suitable = 0 or very hot, hot, cold, and very cold = 1; (3) Water sources: tap water = 0, non-tap water = 1; (4) Energy sources for cooking and heating: Households using clean fuels (e.g., solar, natural gas, liquefied petroleum gas, electricity) for both activities = 0; those using solid fuels (e.g., coal, crop residue, wood) for both activities = 2; and those with mixed usage (one clean, one solid) = 1; and (5) Outdoor PM2.5 exposure: annual mean concentrations were classified per standards of the Ministry of Ecology and Environment of China as < 35.0 µg/m³ = 0 or ≥ 35.0 µg/m³ = 1. PM2.5 concentration data were derived from the China High Air Pollutants (CHAP) database [22], which integrates multi-source observations including ground monitoring networks, satellite remote sensing products, atmospheric reanalysis, and model simulations to establish a high-resolution (1-km grid) exposure assessment system. Given individual exposure data privacy regulations, access was limited to city-level PM2.5 data, which served as a proxy for individual-level data [23].
The composite living environment score (range: 0–6) was calculated by summing the dichotomous codes, with higher scores indicating a greater cumulative burden of adverse environmental factors. Consistent with the established epidemiological framework [19, 20], the environment was classified into three levels: favorable (0–1 points), moderate (2–3 points), and unfavorable (4–6 points).
Assessment of painThis study operationalized body pain as primary outcome measures. Pain characteristics were assessed using standardized self-report questions: “Are you often troubled with any pains? On what part of your body do you feel pain? Please list all body areas where you are currently experiencing pain.” Based on anatomical distribution, 15 pain sites were categorized into four primary regions [24]: (1) upper limb (shoulder, arm, wrist, and fingers), (2) lower limb (leg, knees, ankle, and toes), (3) trunk (chest, stomach, back, waist, and buttocks), and (4) head and neck. Multisite pain was defined as concurrent pain occurring in two or more distinct anatomical regions [25].
CovariatesBased on prior knowledge [5, 26, 27], the following covariates were considered: sociodemographic characteristics included age, sex, residence (rural, urban), marital status (married, others), and educational status (illiteracy, primary school and below, and middle school and above; lifestyle habits included smoking status (never smokers, ever smokers) and drinking status (never drinkers, ever drinkers); chronic disease included hypertension, dyslipidemia, diabetes, cancer, chronic lung diseases, liver disease, heart attack, stroke, kidney disease, stomachache, psychiatric disease, memory-related disease, arthritis, and asthma. Chronic conditions were ascertained through self-reported physician-diagnosed information, assessed by the question: “Have you been diagnosed with any of the following conditions by a physician?“.
Statistical analysesData were described as mean ± standard deviation or frequency and percentage. Baseline participant characteristics were compared across groups defined by living environment quality, employing Chi-square tests for categorical data and one-way ANOVA for normally distributed continuous data as appropriate. Missing covariates (Table S2) were addressed through multiple imputations via chained equations [28], generating 50 imputed datasets. The most plausible dataset was selected for the final analysis. In cross-sectional analyses, logistic regression models were employed to estimate associations between living environment quality and pain, with results expressed as odds ratios (ORs) and 95% confidence intervals (CIs). While for longitudinal analyses, Cox proportional hazards models with follow-up time as the timescale were constructed, reporting hazard ratios (HRs) and 95% CIs. Follow-up time was measured as the interval between the first interview and either the pain event recording or the most recent interview. The proportional hazards assumption was assessed using Schoenfeld residuals. For covariates violating this assumption, stratification approach was implemented to address non-proportionality. Four models were constructed: Model 1 was an unadjusted model; Model 2 was adjusted for age, sex, residence, marital status, and education status; Model 3 was further adjusted for smoking and drinking status; and Model 4 was additionally adjusted for chronic disease conditions.
Kaplan-Meier curves were utilized to estimate cumulative incidence of pain stratified by living environment quality, between-group differences assessed via log-rank tests. Subgroup and interaction analyses were conducted to explore potential effect modifications by sociodemographic characteristics. To evaluate the robustness of findings, three sensitivity analyses were performed: First, analyses were repeated using complete-case datasets to mitigate potential bias from missing variables; Second, new-onset pain cases identified during the first follow-up wave were excluded to minimize confounding effects on causal associations; Third, neighborhood- and city-level measurements may violate the model’s independence assumption. We evaluated potential clustering effects at these levels by computing intraclass correlation coefficients (ICC).
All statistical analyses were conducted using SPSS version 25.0 and Stata version 17.0. A two-sided P-value < 0.05 was considered statistically significant throughout the study.
Comments (0)