
Remember me


This study was approved by the institutional review board of our hospital. The requirement for informed consent was waived due to its retrospective design.
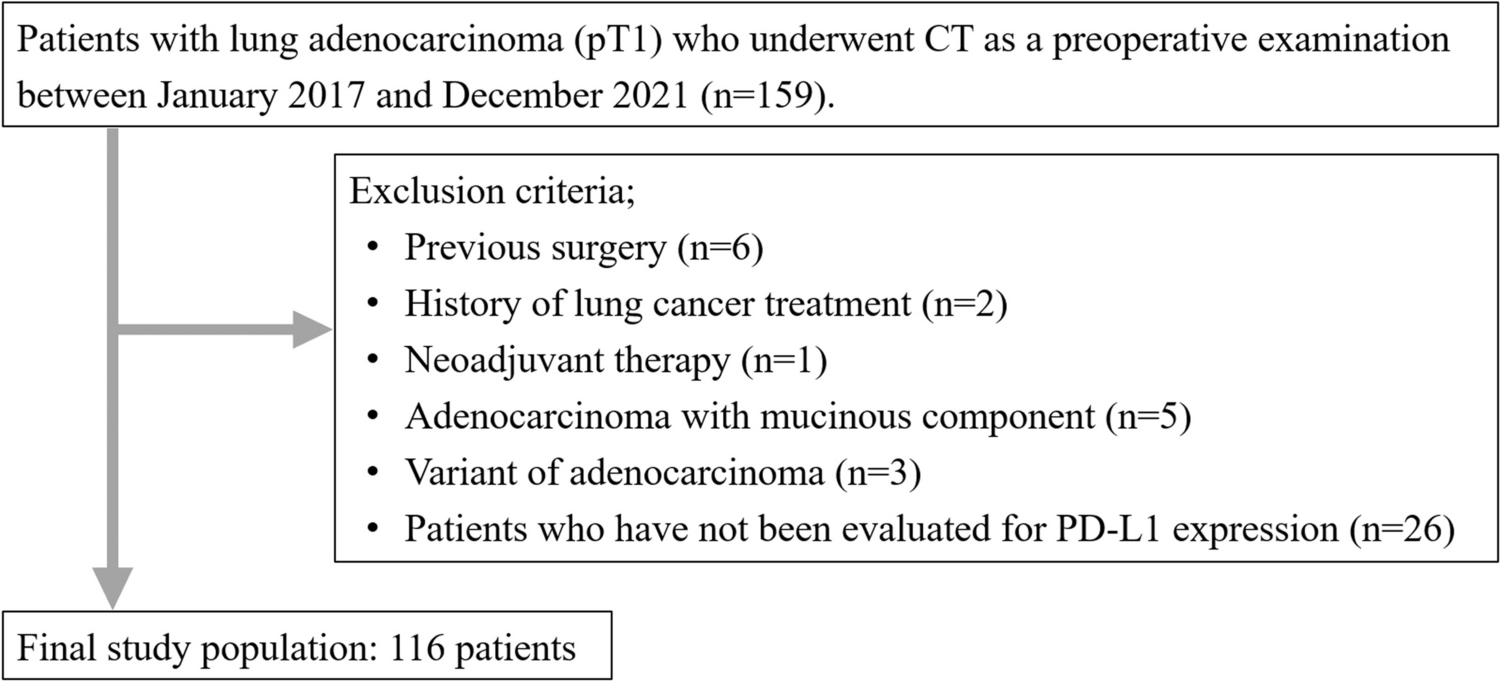
Study populationThis study included patients who underwent preoperative CT for lung cancer between January 2017 and December 2021. The inclusion criteria were patients who underwent CT imaging within two months before surgery and who were pathologically diagnosed with pT1 lung adenocarcinoma. During the study period, 159 patients met the inclusion criteria. Patients with history of previous lung operation (n = 6), lung cancer treatment (n = 2), neoadjuvant therapy (n = 1), adenocarcinoma with mucinous component (n = 5), variants of adenocarcinoma or other accompanying tumor components (n = 3; two cases with adenosquamous carcinoma and one case with adenocarcinoma with neuroendocrine feature), and patients in whom the expression of PD-L1 was not evaluated (n = 26) were excluded from the study (Fig. 1).
Fig. 1
Flowchart of the patient selection
Thus, the final study population consisted of 116 patients (male, n = 65; female, n = 51; mean age: 71.6 ± 9.0 [range: 37–85 years]) (Table 1). Smoking history was identified in 69 patients (59.5%; mean pack years: 38.7 ± 24.5). The diagnoses of lung adenocarcinoma included minimally invasive adenocarcinoma (MIA) (n = 15) and invasive adenocarcinoma (IAC) (n = 101). The analysis was further stratified based on the PD-L1 expression status. The PD-L1 expression status was classified based on the tumor proportion score (TPS) [17]. Eleven (9.5%) patients had TPS ≥ 50%, 45 (38.8%) patients had TPS 1–49%, and 60 (51.7%) patients had TPS < 1%. Pathological stages were determined based on the International Union Against Cancer 8 definitions.
Table 1 The clinical characteristics of patients with lung adenocarcinomaCT techniqueMultidetector-row CT (MDCT) examinations were performed using SOMATOM Force or Drive (Siemens Healthineers, Erlangen, Germany), or Aquilion Precision (Canon Medical Systems, Otawara, Japan). All scans were performed in a cephalocaudal direction. The imaging parameters for thin-section CT were as follows: tube voltage, 100 kVp; scan field of view, 320–360 mm; slice thickness, 1 mm. The tube current was determined using an automatic exposure-control system. CT images for lung windows were reconstructed using kernel Br64 and ADMIRE strength 1 for the Siemens CT systems and using kernel FC53 and AIDR 3D weak for the Canon CT systems. Monitors were used to view the CT image at lung settings (window width 1500 HU and window level, −600 HU).
CT image analysisTwo radiologists (M. N., with 1 year of experience and F. K., with 10 years of experience) classified the morphology of tumors into pure GGN, part-solid nodules, and solid nodules. Differences were resolved by consensus. The longest diameters of the overall tumor of the lung cancer (tumor diameter), including the solid and GGN components, and the longest diameters of the solid component (solid component diameter) were measured on any one of axial, sagittal, and coronal CT images by the two radiologists. The averages of the data were used in the analysis. From these CT measurements, the solid component diameter (%) was calculated as follows: solid component diameter/tumor diameter × 100 (%). All CT datasets were transferred to a dedicated lung application for the lungs (Volume Analyzer; SYNAPSE VINCENT, Fujifilm Corp, Tokyo, Japan). The tumor was dragged by one radiologist (F.K.) and the volume data including the tumor volume and the solid component volume were automatically analyzed. The results were confirmed by the radiologist (F.K.). The rate of the solid component volume was calculated as follows: solid component volume/tumor volume × 100 (%).
Statistical analysisData were analyzed using SPSS (ver. 27.0, IBM, Armonk, NY, USA). Continuous variables are presented as means ± standard deviations or medians with interquartile ranges (IQRs). To compare tumor morphology between the groups of TPS ≥ 50%, 1–49% and < 1%, we used Fisher’s exact probability test. An adjusted standardized residual of > 1.96 or < −1.96 was considered indicative of a group with a significantly higher or lower frequency, respectively. The Kruskal–Wallis test was used to compare the age, smoking history and CT measurements between the groups of TPS ≥ 50%, 1–49% and < 1%. If the Kruskal–Wallis test showed a statistically significant p-value, the Dunn-Bonferroni post-hoc method for all pairwise comparisons were performed. Additionally, receiver operating characteristic (ROC) curves were plotted and the areas under the curve (AUC) were calculated. Optimal cutoff values were obtained utilizing the maximized Youden index method based on the ROC analysis. Univariate and multiple linear regression analyses were also performed to examine the influencing factors of 50% and 1% PD-L1 expression. Statistical significance was set at p < 0.05.
Interobserver agreement between the two radiologists was calculated as the kappa value (κ) for the tumor morphology and as the intraclass correlation coefficient (ICC) for the tumor diameter and the solid component diameter as follows: slight (0.00–0.20), fair (0.21–0.40), moderate (0.41–0.60), substantial (0.61–0.80), or almost perfect (0.81–1.00).
Comments (0)