
Remember me

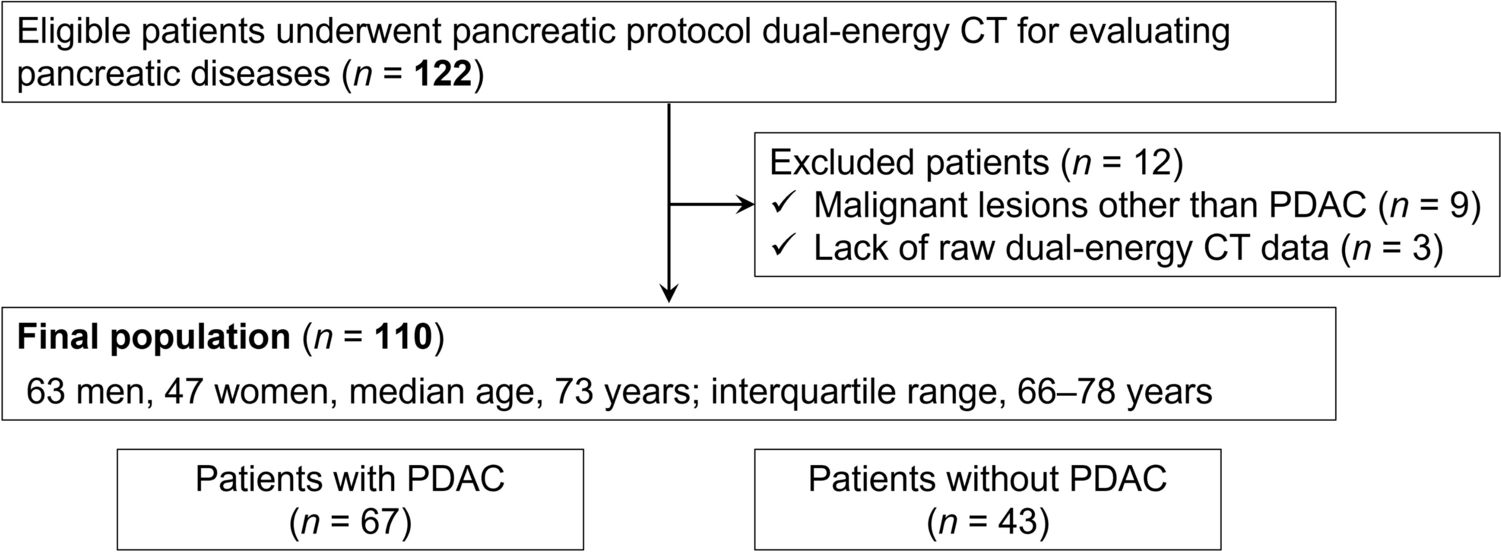

This retrospective study was approved by the institutional review board, with a waiver of the requirement for informed consent. The inclusion criteria were patients who underwent DECT including arterial and venous phases with suspected SBO and were deemed to have a possible or suspected ASBI. To identify eligible cases, we conducted a search of our radiology reporting system and medical records from January 2018 to February 2024 for reports containing the terms “ SBO “ or “suspected SBO “ (n = 1347). Among these, exclusion criteria were applied as follows: First, cases were excluded if imaging consisted only of non-contrast-enhanced CT (n = 370). Second, cases were excluded if only one phase, either arterial or venous, was available (n = 41). Third, we excluded cases where conventional visual CT findings did not suggest ASBI (n = 904). Finally, 32 patients with SBO in whom ASBI was suspected or considered possible based on conventional visual CT findings and who underwent DECT in both the arterial and venous phases were included in the final analysis (Fig. 1). The radiology reporting system was used to extract which conventional visual CT findings raised suspicion for ASBI, including reduced bowel enhancement, mural thickening, bowel-wall edema, unusual course of the mesenteric vasculature, diffuse mesenteric haziness, ascites, pneumatosis, and increased bowel wall attenuation on non-contrast-enhanced images. These findings were reviewed by two radiologists with 20 and 8 years of experience in abdominal imaging (N.M. and M.M., respectively), who also reviewed the corresponding CT images together. The presence or absence of each finding was confirmed by consensus for all included cases. There was no discrepancy between these interpretations and the original radiology reports. However, for cases not suspected of having ASBI based on conventional CT findings (n = 904), no such review was performed. Patient characteristics, including age, gender, surgery for the present disease, height, body weight, and white blood cell count, were obtained from the hospital information system. We categorized cases based on medical records into two groups: “surgically confirmed ASBI,” defined as cases with surgically confirmed small bowel necrosis, and “non-confirmed ASBI,” defined as cases that either improved with observation or had no small bowel necrosis upon surgical evaluation, including cases where strangulation release was performed. In this study, surgically confirmed small bowel necrosis was defined as ischemia (ASBI), and although some cases in the “non-confirmed ASBI” group may have had ischemia at the time of CT imaging, they were classified as “non-confirmed ASBI”.
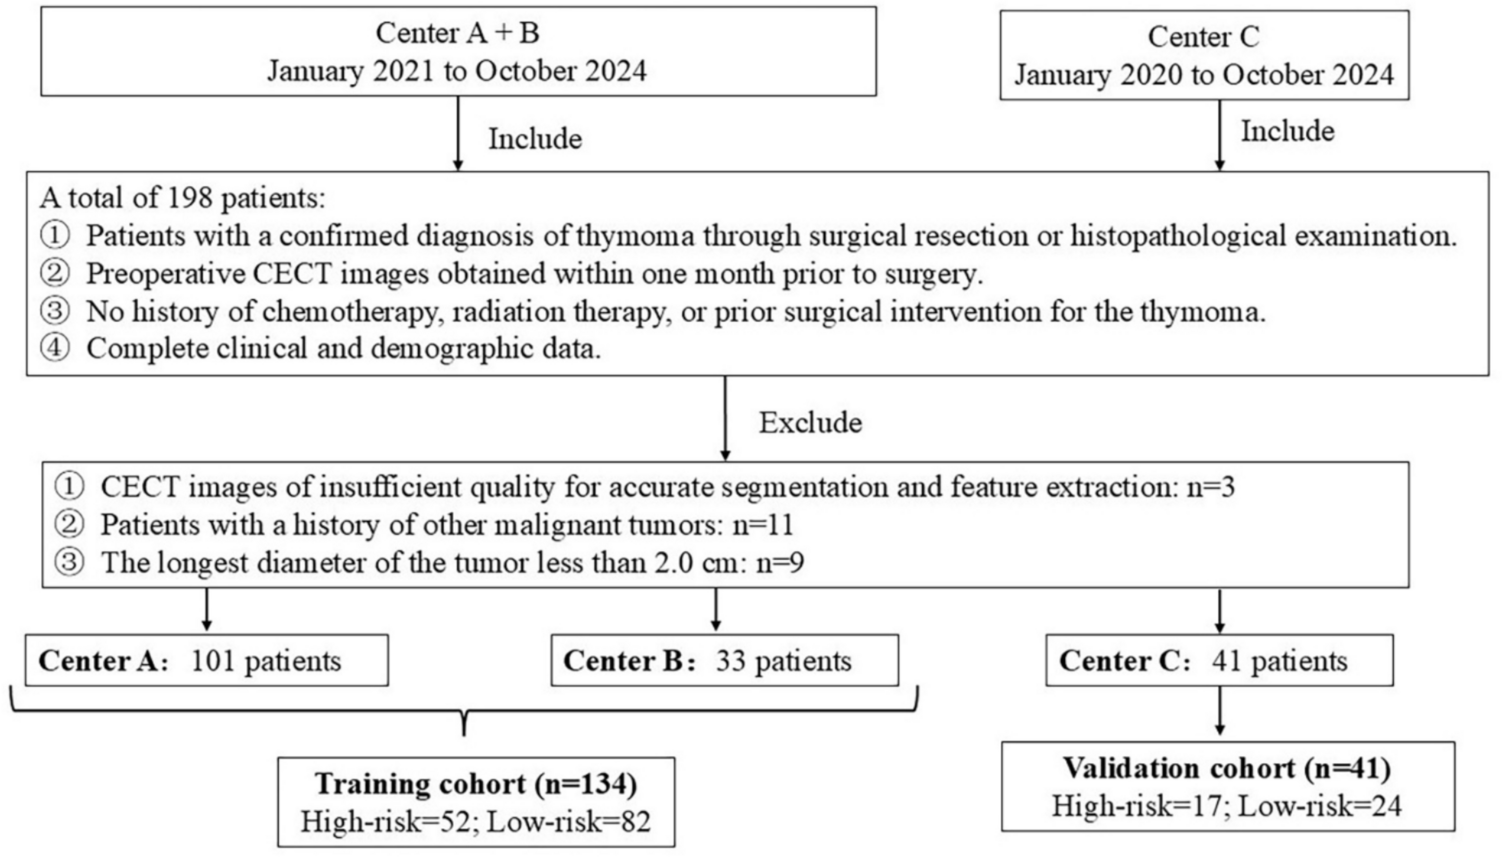
Fig. 1
Flowchart illustrating the selection process for the study population. Among 1347 patients with small bowel obstruction (SBO) or suspected SBO, cases were excluded according to the following criteria: those with non-contrast-enhanced CT only (n = 370), those with imaging limited to a single phase (arterial or venous; n = 41), and those where conventional visual CT findings did not suggest acute small bowel ischemia (ASBI) (n = 904). Following the application of these criteria, 32 patients with SBO in whom ASBI was suspected or considered possible based on conventional visual CT findings and who underwent dual-energy CT (DECT) in both the arterial and venous phases were included in the final analysis
Image acquisitionAll patients were scanned using a Revolution CT scanner (GE Healthcare Japan, Tokyo, Japan), a fast kV-switching Dual-Energy CT system. The imaging protocol consisted of non-contrast-enhanced, arterial phase, and venous phase acquisitions without the use of oral contrast material. DECT data were acquired with fast kV-switching (80/140 kV) using Gemstone Spectral Imaging (GSI) mode, using a detector configuration of 128 × 0.625 mm and a Noise Index of 9.7. The reference tube current was set at 202.5 mAs (405 mA × 0.5 s), and the gantry rotation time was 0.5 s. The helical pitch was fixed at 0.922, and the field of view (FOV) was 34.5 cm. Images were reconstructed at two different time points for each acquisition phase. For images obtained 40 s after contrast injection (arterial phase), the reconstructed section thickness was 2.5 mm and 1.25 mm, using deep learning image reconstruction (DLIR) at low and medium strength levels. For images acquired 100 s after contrast injection (venous phase), the reconstructed section thickness was 5.0 mm and 1.25 mm, also utilizing DLIR at low and medium strength levels. Nonionic, low-osmolality, iodine-based contrast agents were used: Iopamidol (Iopamidol®, Fuji Pharma Co., Ltd., 300–370 mgI/mL), Iomeprol (Iomeron®, Bracco Imaging, 300–350 mgI/mL), Iopromide (Iopromide®, Bayer AG, 300–370 mgI/mL), and Ioversol (Optiray®, Guerbet, 320–350 mgI/mL). Specific agent and concentration were selected according to availability and patient condition, and the iodine dose was adjusted to approximately 500–600 mgI/kg body weight. The injection rates ranged from 1.6 to 3.1 mL/s, with a total contrast medium volume of 75–120 mL adjusted based on the patient body weight. Detailed iodine dose, injection rate of contrast material, volume of contrast material, and injection time were obtained from the radiology information system.
Image analysisDECT data were post-processed using dedicated software (AW Server 3.2 Ext.2.0, GE Healthcare Japan, Tokyo, Japan). The 70-keV VMI, 40-keV VMI, and iodine-map images were generated for both the arterial and venous phases. Iodine maps were automatically generated using the Gemstone Spectral Imaging (GSI) software integrated into the CT scanner (GE Healthcare). The GSI technique employs a fast kV-switching dual-energy acquisition method (80/140 kVp), allowing for material decomposition based on the energy-dependent attenuation properties of iodine. Iodine quantity (μg/cm3) was calculated using a two-material decomposition algorithm, which assumes water and iodine as basis materials. The algorithm estimates the iodine content for each voxel by analyzing the attenuation differences between low- and high-energy data. The resulting iodine maps were post-processed and visualized using the AW Server (GE Healthcare). The maps were then exported as monochromatic DICOM images and transferred to a Synapse Picture Archiving and Communication System (PACS) viewer (Fujifilm Medical Co., Ltd., Tokyo, Japan). The 70-keV VMI in DECT was made as a comparable alternative to conventional 120-kVp CT [21, 22]. These images were reconstructed with a slice thickness of 1.25 mm. The CT images were retrospectively reviewed by two radiologists with 20 and 8 years of experience (* and **, respectively) in abdominal imaging. For each phase of each case, the two radiologists independently placed ten cursors on voxels of the small bowel wall that appeared to have reduced contrast enhancement (Fig. 2 and 3), ensuring that the cursors were placed at the same anatomical locations on the 70-keV images, 40-keV images, and iodine maps within each phase. In cases where reduced bowel enhancement was not clearly observed, the cursor was placed on the segment of the bowel wall that appeared to have the relatively lowest enhancement, based on visual assessment. Cursor placement was performed in the same manner for both the arterial and venous phases. However, manual adjustments were made in cases of bowel wall motion. In cases where the bowel wall was thickened, the cursors were positioned on the mucosal side. When the bowel wall was not thickened, the wall was indeed very thin; however, the cursor was still placed as close to the mucosal side as possible. The CT values or iodine quantities measured at these ten locations were averaged for analysis. To assess intra-observer reliability, the two observers performed a second round of cursor placements after a one-month interval. Inter-observer reliability between the two readers was assessed using the intra-class correlation coefficient (ICC). Intra-observer reliability for each reader was also evaluated using the ICC. An r value of 1.0 was deemed to indicate perfect agreement; 0.81–0.99, almost perfect agreement; 0.61–0.80, substantial agreement; 0.41–0.60, moderate agreement; 0.21–0.40, fair agreement; and 0.20 or less, slight agreement.
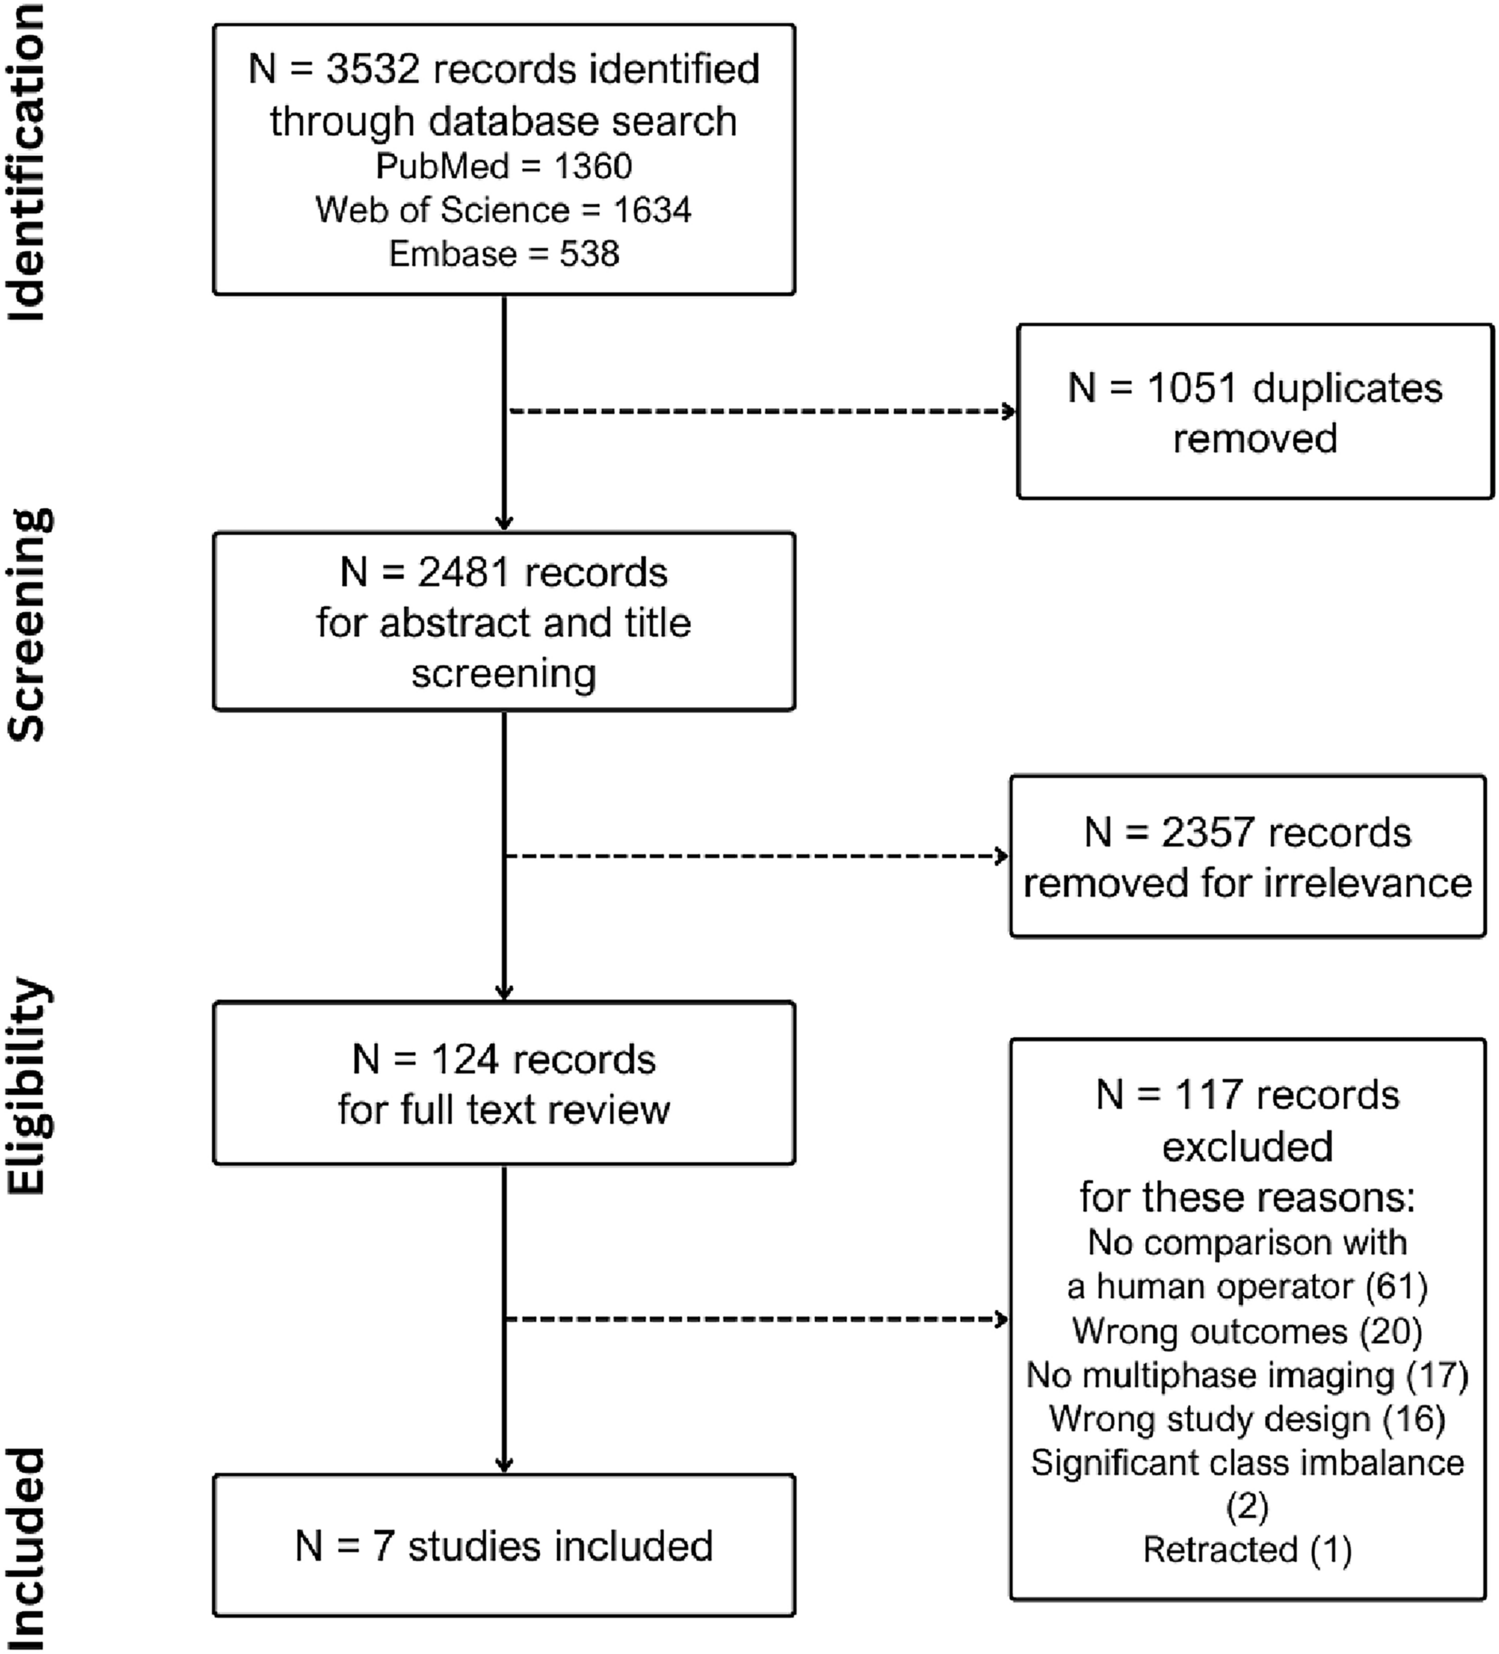
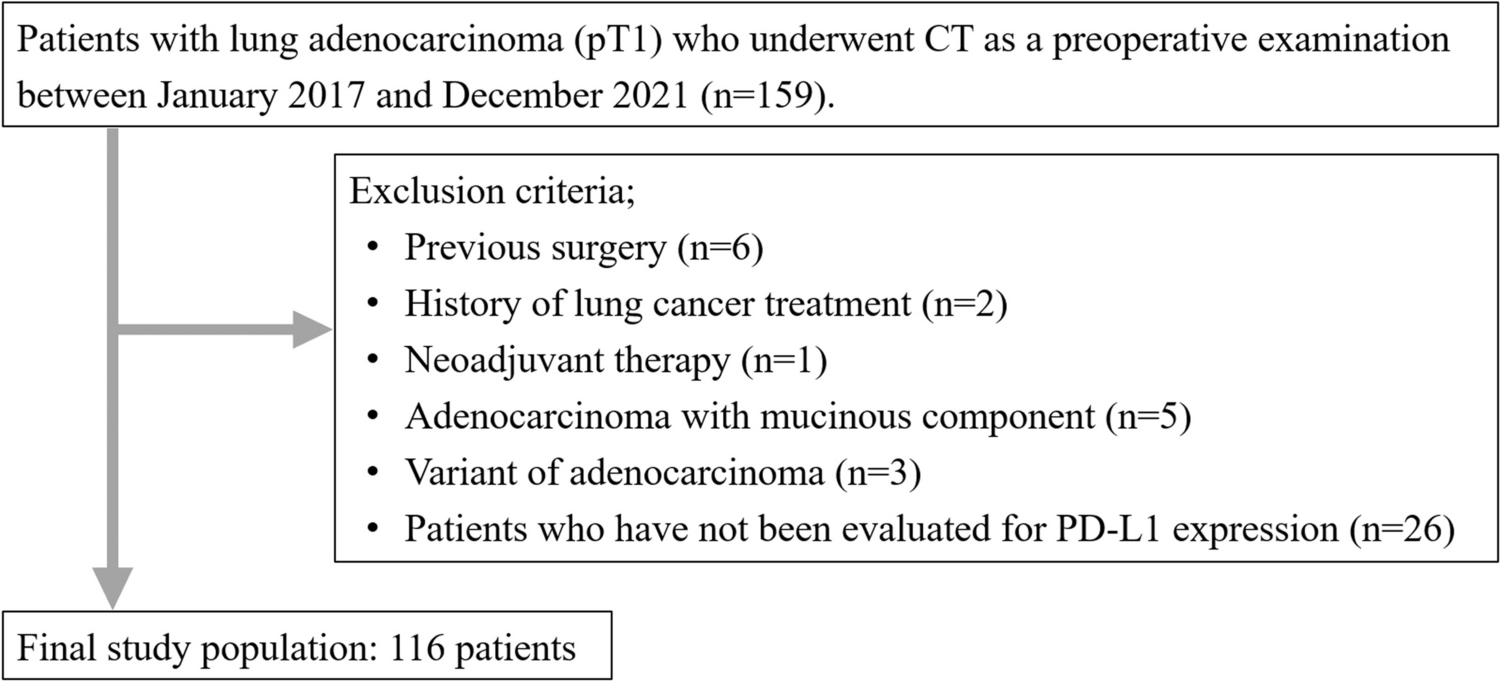
Fig. 2
Representative images from a 54-year-old woman with surgically confirmed acute small bowel ischemia (ASBI) who required resection of 50 cm of small bowel due to necrosis. The two radiologists independently placed ten cursors on the small bowel wall in areas appearing to have reduced contrast enhancement in the arterial phase (a–c 70-keV, 40-keV, iodine quantity) and venous phase (d–f 70-keV, 40-keV, iodine quantity), ensuring that the cursors were placed at the same anatomical locations on the 70-keV images, 40-keV images, and iodine maps within each phase. In this slice, four cursors are shown. The mean CT values in the arterial phase were 27.0 HU at 70-keV and 51.3 HU at 40-keV, with a mean iodine quantity of 4.0 μg/cm3. In the venous phase, the mean CT values were 35.7 HU at 70-keV and 53.4 HU at 40-keV, with a mean iodine quantity of 4.0 μg/cm3
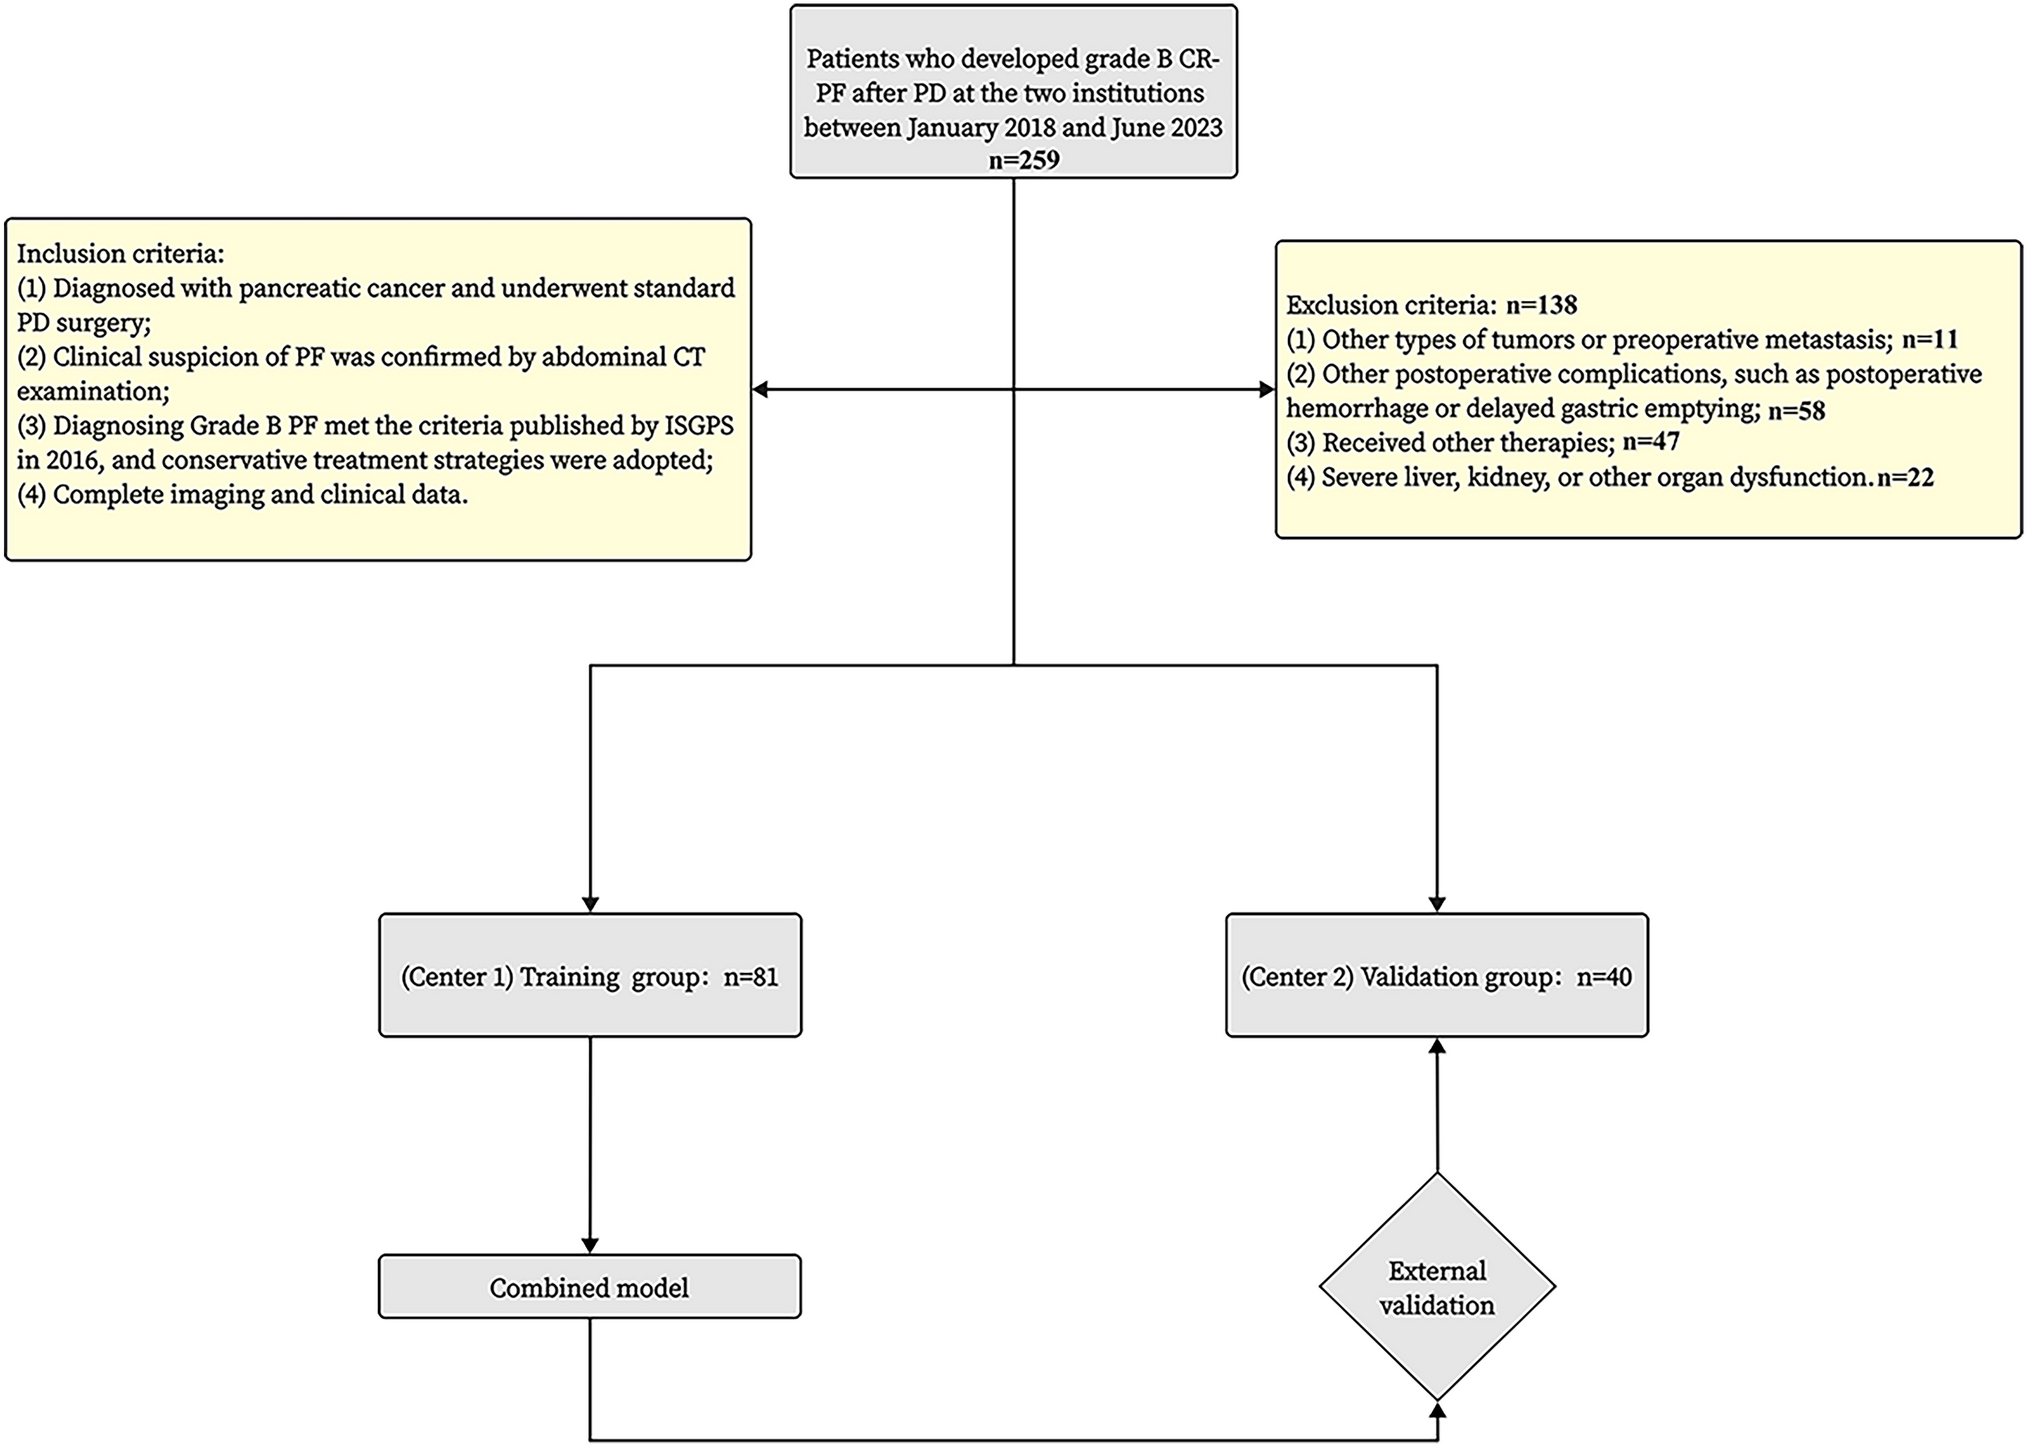
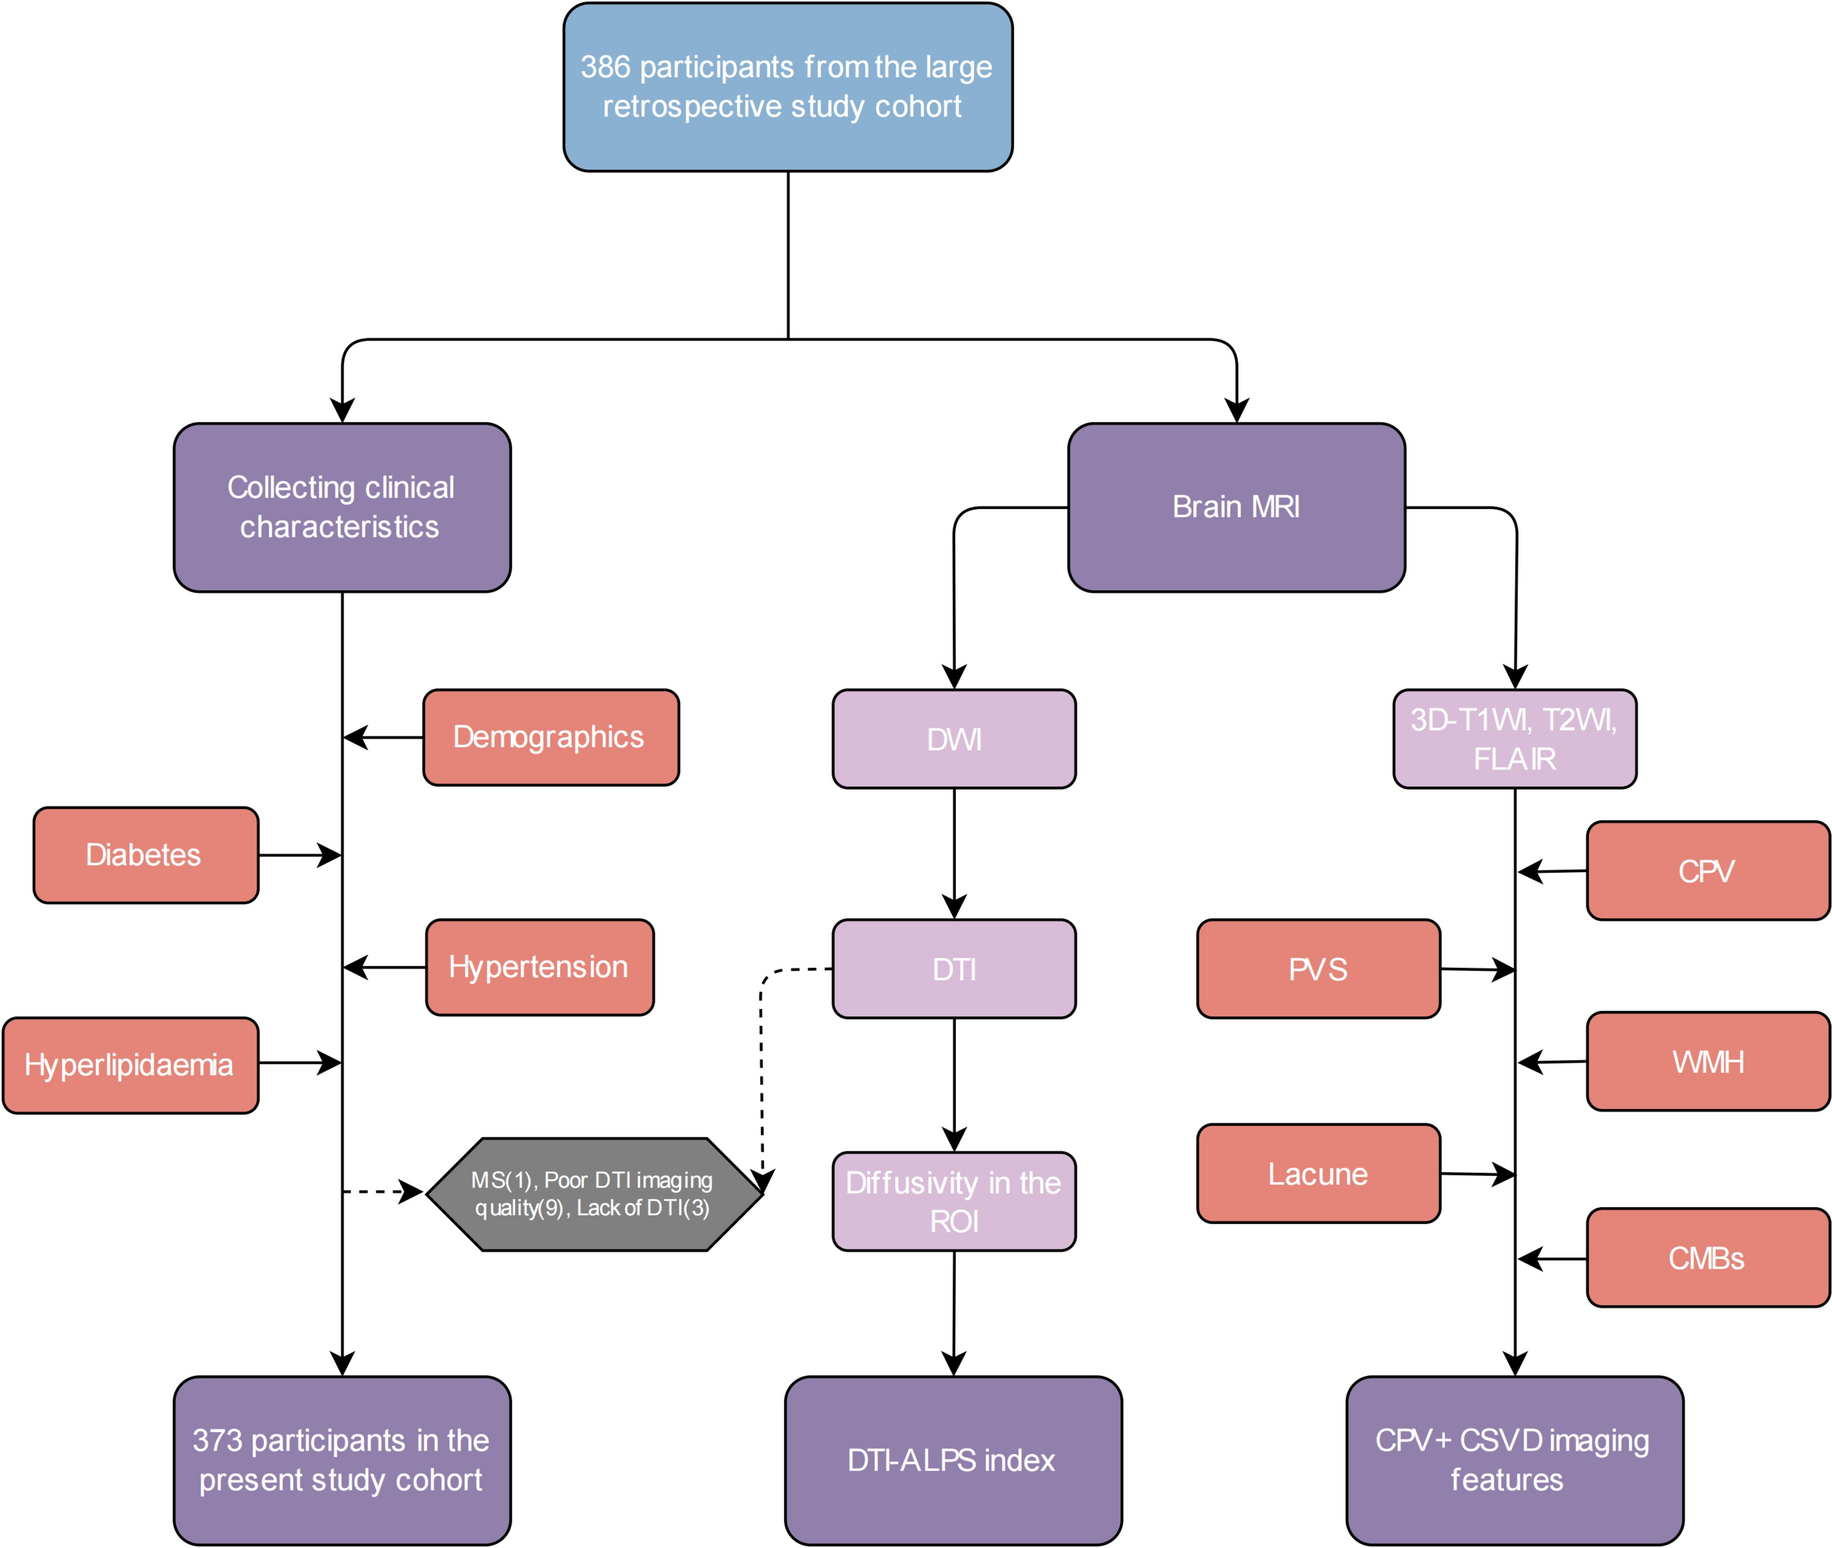
Fig. 3
Representative images from a 40-year-old man in the non-confirmed acute small bowel ischemia (ASBI) group who improved with conservative management (fasting). Ten cursors were placed on the small bowel wall in areas appearing to have reduced contrast enhancement in the arterial phase (a–c 70-keV, 40-keV, iodine quantity) and venous phase (d–f 70-keV, 40-keV, iodine quantity). In this slice, three cursors are shown as examples. In the arterial phase, the mean CT values were 48.0 HU at 70-keV and 105.2 HU at 40-keV, with a mean iodine quantity of 9.9 μg/cm3. In the venous phase, the mean CT values were 47.8 HU at 70-keV and 84.6 HU at 40-keV, with a mean iodine quantity of 12.0 μg/cm3
Statistical analysisContinuous variables, including age, height, body weight, white blood cell count (WBC), injection rate of contrast material, volume of contrast material, injection time, CT values in 70-keV and 40-keV VMI, and iodine quantities at arterial and venous phases, were compared between surgically confirmed ASBI and non-confirmed ASBI groups using the Mann–Whitney U test. In addition, iodine dose per kilogram of body weight (mgI/kg) was calculated for each patient and compared between the surgically confirmed ASBI group and the non-confirmed group using the Mann–Whitney U test. Categorical variables, such as gender, surgery, and the presence or absence of conventional visual CT findings, were compared between the two groups using the chi-square test. Receiver operating characteristic (ROC) curve analysis was performed to assess the diagnostic performance of CT values in 70-keV and 40-keV VMI, as well as iodine quantities, at the arterial and venous phases. The area under the curve (AUC) of the ROC curve for CT values in 40-keV VMI and iodine quantities were compared to that for CT values in 70-keV VMI at the arterial and venous phases, as 70-keV VMI in DECT is recognized as a comparable alternative to conventional 120-kVp CT [21, 22]. In this process, we assessed whether DECT demonstrated significant advantages over conventional CT in detecting ASBI. Additionally, the highest AUC observed in the arterial phase was compared to the highest AUC observed in the venous phase. All statistical analyses were conducted using JMP Pro 17 (SAS Institute Inc., Cary, NC, USA). A p value < 0.05 was considered statistically significant.
Comments (0)