
Remember me
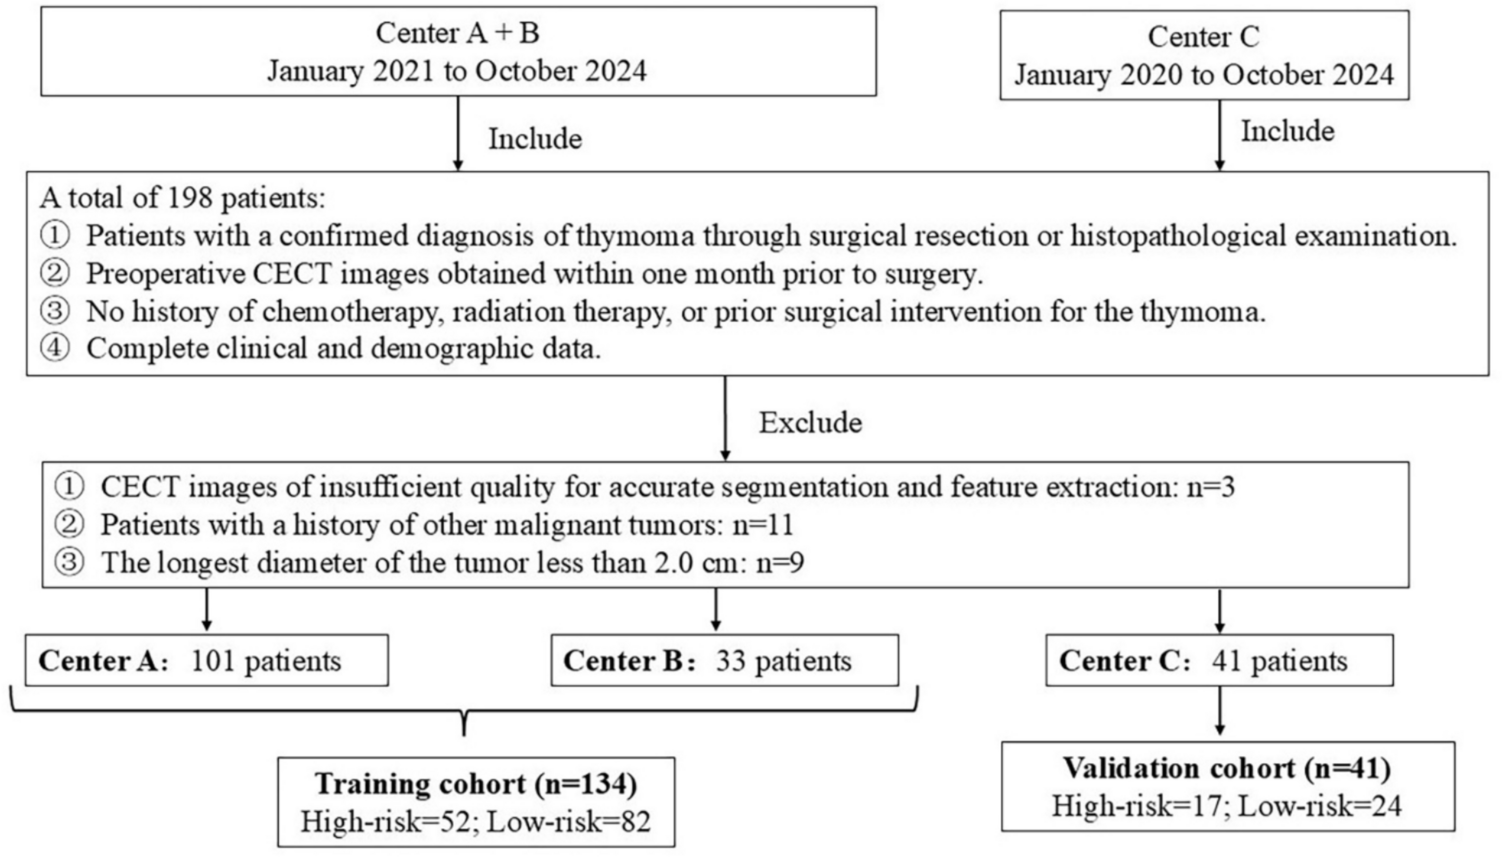


Gadoxetic acid-enhanced MRI enables the comprehensive assessment of liver lesions through its distinct biphasic enhancement pattern. Following intravenous administration, gadoxetic acid initially behaves similarly to extracellular contrast agents, providing valuable perfusion information essential for characterizing lesion enhancement patterns during the dynamic phases (arterial, portal venous, and transitional) (Fig. 1) [6]. Subsequently, the hepatobiliary phase (HBP), typically acquired 15–20 min post-injection, offers a distinct advantage by reflecting the unique hepatocyte-specific uptake of the agent [7].
Fig. 1
Comparison of the dynamic contrast-enhanced MRI using two different contrast agents. A 73-year-old man with pancreatic adenocarcinoma (not shown) underwent two MRI examinations within 1 week, each utilizing a different contrast agent. The first MRI was performed using an extracellular contrast agent (ECA) (a–c), and the second using gadoxetic acid (d–g). In the late hepatic arterial phase, both ECA (a) and gadoxetic acid (d) demonstrate marked arterial enhancement and early portal vein opacification (arrows). Although gadoxetic acid uptake in the hepatic parenchyma may begin as early as the portal venous phase, the appearance of the portal venous phase with ECA (b) and gadoxetic acid (e) is similar, with the middle hepatic veins (arrows) being hyperintense relative to the background parenchyma. At approximately 3 min post-injection, the delayed phase with ECA (c) and transitional phase with gadoxetic acid (f) are acquired. During this phase, gadoxetic acid distributes into both the extracellular and intracellular spaces, rendering the middle hepatic vein (arrow) isointense to the background parenchyma. In contrast, the middle hepatic vein (arrow) remains hyperintense to the background parenchyma on the delayed phase with ECA (c). In the hepatobiliary phase (g), gadoxetic acid is predominantly cleared from the extracellular space and accumulates mainly in the intracellular space and bile ducts. Consequently, the liver parenchyma appears more enhanced than the intrahepatic vessels (black arrow), and gadoxetic acid is visualized within the bile ducts (white arrow)
Mechanism of hepatocyte uptake and biliary excretion leading to hepatobiliary phaseGadoxetic acid undergoes a complex hepatocellular uptake and biliary excretion process. After circulating through the vascular compartment similar to conventional extracellular contrast agents during the dynamic phases, gadoxetic acid is selectively taken up from the sinusoidal blood by functioning hepatocytes via organic anion transporting polypeptide (OATP)1B3 on the basolateral membrane. Once internalized, it is transported across the hepatocyte and actively excreted into bile canaliculi through multidrug resistance-associated protein 2 (MRP2) on the apical membrane. This hepatocyte-specific uptake and biliary excretion mechanism results in progressive liver parenchymal enhancement, while non-hepatocytic lesions remain hypointense, creating the characteristic high lesion-to-liver contrast observed in the HBP [6]. This high-contrast imaging not only enhances lesion detection sensitivity but also enables precise lesion characterization based on the distinct signal intensity patterns observed during HBP.
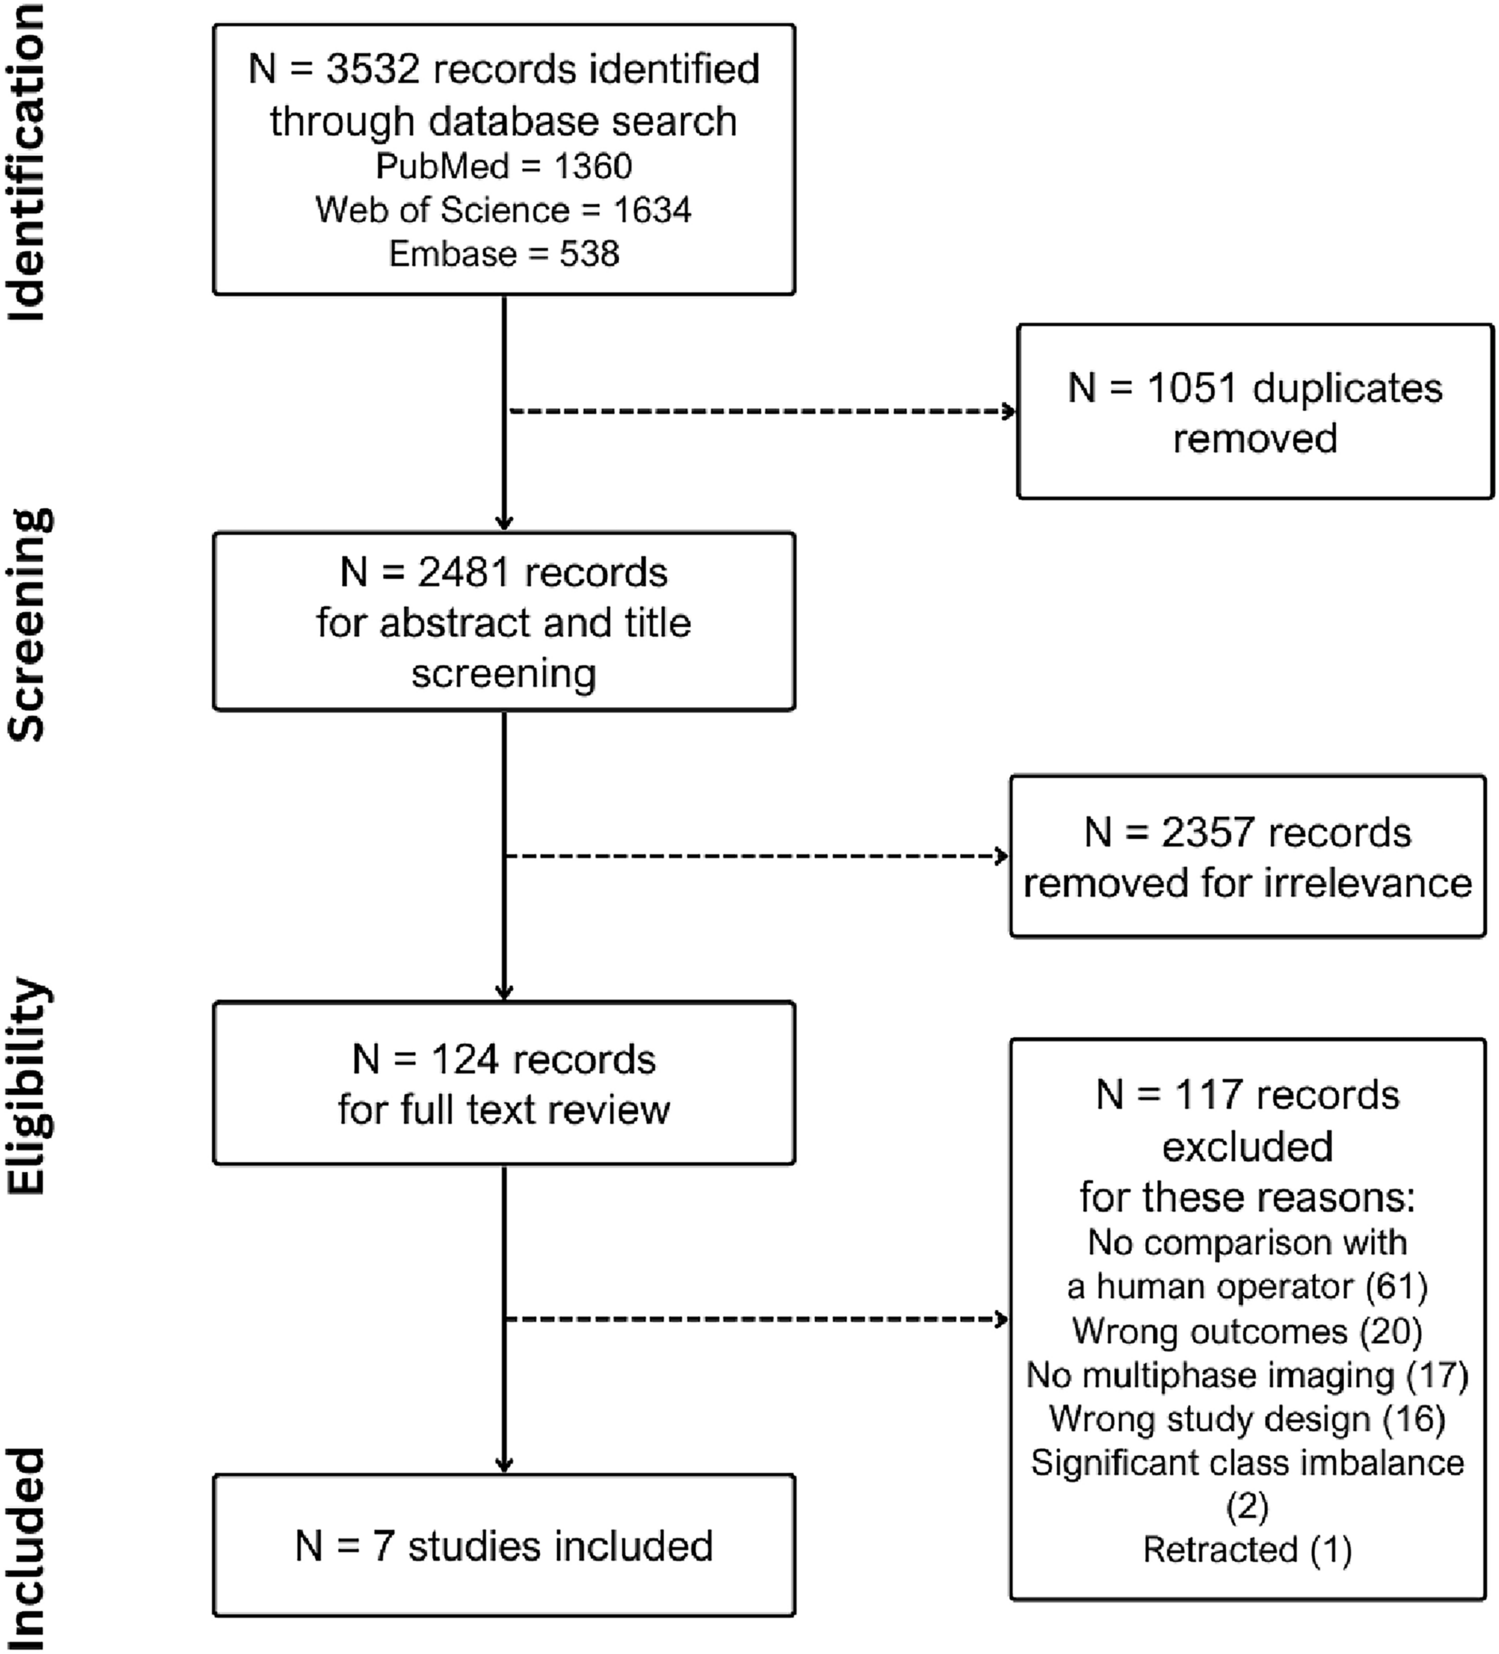
Role in HCC diagnosisTypical HCC imaging findingsTypical HCC demonstrates non-rim arterial phase hyperenhancement (APHE), portal venous washout, and HBP hypointensity. HBP hypointensity, observed in 85–95% of HCCs, reflects impaired hepatocyte function and reduced gadoxetic acid uptake (Fig. 2). Together, these findings constitute the characteristic imaging signature of HCC on gadoxetic acid-enhanced MRI [8]. The high specificity of these features is incorporated into the Liver Imaging Reporting and Data System (LI-RADS) framework as major diagnostic features [8].
Fig. 2
Hepatocellular carcinoma in a 79-year-old man, showing typical imaging findings. A nodule (arrowheads) located in segment 4 appears clearly hyperintense on fat-suppressed T2-weighted images (a) and demonstrates diffusion restriction on diffusion-weighted images (b). The nodule displays hypointensity on pre-contrast image (c), non-rim arterial phase hyperenhancement (d) with portal venous washout (e), and clear hypointensity on the hepatobiliary phase (f). The nodule was pathologically proven to be hepatocellular carcinoma following surgical resection
Beyond the major features, ancillary findings such as the presence of a non-enhancing capsule, fat in mass (Fig. 3), mosaic architecture (Fig. 4), nodule-in-nodule (Fig. 5), and blood products in mass (Fig. 4) strongly support HCC diagnosis [8]. Other supportive findings include subthreshold growth, diffusion restriction (Figs. 2 and 4), mild-to-moderate T2 hyperintensity (Figs. 2, 4, and 5), fat or iron sparing, and transitional phase or HBP hypointensity (Figs. 2, 3, 4, 5) [8]. These features are particularly valuable when lesions do not exhibit the typical vascular profile of HCC. Thus, the diagnostic utility of gadoxetic acid-enhanced MRI lies not solely in the hepatobiliary phase but in the comprehensive evaluation across dynamic contrast-enhanced phases and supplementary sequences such as diffusion-weighted imaging.
Fig. 3
Fat-containing hepatocellular carcinoma in a 74-year-old man. Opposed-phase (a) and in-phase (b) images depicting signal loss within the nodule (arrowheads). The nodule (arrowheads) appears isointense relative to the background liver parenchyma on the pre-contrast image (c) and does not exhibit non-rim arterial phase hyperenhancement on the arterial phase image (d). It shows hypointensity on the transitional phase image (e) and clear hypointensity on the hepatobiliary phase image (f). Histopathological examination following surgical resection confirmed the diagnosis of hepatocellular carcinoma
Fig. 4
Hepatocellular carcinoma in a 73-year-old man. The mass (arrowheads) in segment 8 displays inhomogeneous hyperintensity on fat-suppressed T2-weighted imaging (a) and inhomogeneous diffusion restriction on diffusion-weighted imaging (b). A part of the mass shows a reduced apparent diffusion coefficient value compared to the background liver parenchyma (c). Pre-contrast image reveals intralesional blood products (arrow) (d). The arterial phase image is compromised by transient severe motion, making reliable evaluation of non-rim arterial phase hyperenhancement difficult (e). On the hepatobiliary phase, the lesion appears hypointense, except for areas corresponding to hemorrhage (f). Histopathological analysis following biopsy confirmed the diagnosis of hepatocellular carcinoma
Fig. 5
Hepatocellular carcinoma with a nodule-in-nodule appearance in an 82-year-old woman. A nodule (arrowheads) in segment 3 displays homogeneous hyperintensity on fat-suppressed T2-weighted imaging (a) and homogeneous diffusion restriction on diffusion-weighted imaging (b). The nodule appears hypointense relative to the background liver on the pre-contrast image (c). In the arterial phase (d), a portion of the nodule exhibits hyperenhancement, consistent with a nodule-in-nodule appearance (arrows). The nodule appears hypoenhancing relative to the background liver on the transitional phase image (e), and the nodule-in-nodule appearance is again evident on the hepatobiliary phase image (arrow) (f)
Differentiation from other hepatocellular lesionsEarly HCC and high-grade dysplastic nodules (HGDN)HBP hypointense nodules without APHE are a unique finding on gadoxetic acid-enhanced MRI. Pathologic assessment reveals that approximately 74% of such nodules represent early HCCs, while 10% are dysplastic nodules (Fig. 6) [9].
Fig. 6
Hepatobiliary phase hypointense nodule without arterial phase hyperenhancement in a 69-year-old man with hepatitis B virus-related cirrhosis. A nodule (arrowhead) appears hypointense relative to the surrounding liver on the hepatobiliary phase image (f). It shows mild hypointensity on the transitional phase image (e; arrowhead), but no arterial phase hyperenhancement (c) or portal venous washout (d). The lesion is inconspicuous on fat-suppressed T2-weighted (a) and pre-contrast T1-weighted images (b)
Hepatocarcinogenesis progresses in a multistep sequence: from low-grade dysplastic nodule (LGDN) to HGDN, early HCC, well-differentiated HCC, nodule-in-nodule HCC, and ultimately, moderately differentiated HCC. Early HCC represents the earliest morphologically recognizable stage, characterized by subtle architectural changes and minimal cytological atypia, while hepatocellular function is relatively preserved. On gadoxetic acid-enhanced MRI, early HCCs typically appear hypointense during the HBP due to decreased expression of OATP1B3, which mediates gadoxetic acid uptake [9, 10].
Unlike progressed HCCs, which demonstrate characteristic non-rim APHE due to neoangiogenesis and arterial supply predominance, early HCC often lacks APHE, reflecting the minimal or no vascular changes in the early stages of hepatocarcinogenesis [9].
HGDNs typically exhibit iso- or hypointensity on HBP imaging and generally do not show APHE, although mild hyperintensity may be seen in cases with preserved hepatocyte function [9].
Importantly, of these HBP hypointense nodules without APHE, approximately 8% are LGDNs or regenerative nodules that do not require aggressive treatment [11]. While elevated α-fetoprotein levels and certain MRI features, including well-defined margin (odds ratio [OR], 5.5), hypointensity on pre-contrast T1-weighted imaging (OR, 3.2), intermediate hyperintensity on T2-weighted imaging (OR, 3.4), and restricted diffusion (OR, 1.9), may help differentiate advanced HCC from LGDNs or regenerative nodules, careful interpretation is required [11]. LI-RADS considers APHE as an important finding that enhances the specificity of HCC diagnosis [8].
Focal nodular hyperplasia (FNH) and FNH-like lesionDifferentiating gadoxetic acid-enhanced hyperintense HCCs from FNH can be challenging owing to overlapping imaging features, as both may exhibit non-rim APHE (Fig. 7) [12]. Key differentiating features that favor hyperintense HCC include a lower apparent diffusion coefficient (ADC), portal venous phase washout pattern, the presence of a capsule-like rim, and a mosaic appearance [8]. Conversely, a central scar is characteristic of FNH [12].
Fig. 7
Focal nodular hyperplasia in a 47-year-old woman. A nodule (arrowheads) in segment 8 shows mild hyperintensity on the fat-suppressed T2-weighted image (a) and the pre-contrast image (b). The nodule displays non-rim arterial phase hyperenhancement (c) without portal venous washout (d), and prolonged hyperenhancement in the transitional phase (e). On the hepatobiliary phase image, the nodule appears distinctly hyperintense relative to the background liver (f). Typical imaging findings led to the diagnosis of focal nodular hyperplasia
FNH-like lesions occur in highly diverse pathological settings and present additional diagnostic complexity, particularly in cirrhotic livers, as they may mimic HCC on imaging. Up to 30% of FNH-like lesions in patients with cirrhosis demonstrate HBP hypointensity (Fig. 8) [13], and in one study, three of nine (33%) FNH-like lesions would have been misdiagnosed as HCC using standard diagnostic criteria [14]. Independent predictors of FNH-like lesions include small size (< 1.6 cm), iso- or hypointensity on diffusion-weighted MRI, and absence of portal venous washout. If all three criteria are met, then a 100% specificity for FNH-like lesions can be achieved [13].
Fig. 8
Focal nodular hyperplasia (FNH)-like lesions in a 23-year-old man with alcoholic liver disease. Multiple FNH-like lesions were identified in a 23-year-old man with alcoholic liver disease. A nodule in segment 5 displayed hyperintensity on fat-suppressed T2- and diffusion-weighted images (a, b; arrowheads). The nodule demonstrated non-rim arterial phase hyperenhancement (c; arrowhead) without washout on the portal venous phase (d) and prolonged enhancement in the transitional phase (e; arrowheads). In the hepatobiliary phase, the nodule appeared hypointense relative to the background liver (f; arrowhead). No central scar was observed. The nodule was pathologically confirmed to be an FNH-like lesion on biopsy. In contrast, other nodules showed typical hyperintensity in the hepatobiliary phase compared to the background liver (f; arrow)
In addition, FNH-like lesions specifically occurring in alcoholic cirrhosis demonstrate key differentiating imaging features on imaging, including hypervascularity despite small size, hyperintensity on T1-weighted images, no signal drop on chemical shift images, and incomplete gadoxetic acid uptake on hepatobiliary phase [15].
Hepatocellular adenomas (HCAs)Differentiating HCA from HCC presents diagnostic challenges due to overlapping imaging features, particularly non-rim APHE. However, HCC typically exhibits washout during the portal venous phase [8], whereas HCA generally shows persistent enhancement [16]. HCA imaging features vary by molecular subtype, and key clinical differentiating features include occurrence in non-cirrhotic livers and younger patients with oral contraceptive history.
HNF1α-inactivated HCA (H-HCA) demonstrates signal dropout on chemical shift imaging due to intralesional fat, its most distinctive feature. H-HCAs exhibit non-rim APHE but become hypoenhancing during the portal venous phase, mimicking washout, and are markedly hypointense on HBP (Fig. 9). The characteristically mild arterial enhancement can aid differential diagnosis [16].
Fig. 9
Hepatocyte nuclear factor 1α (HNF-1α)-inactivated hepatocellular adenoma in a 27-year-old woman. Opposed-phase (a) and in-phase (b) images depict the presence of intralesional fat (arrowheads). The nodule (arrowheads) appears hypointense relative to the background liver parenchyma on the pre-contrast image (c), shows mild arterial phase hyperenhancement (d) with portal venous washout (e), and clear hypointensity on the hepatobiliary phase image (f). Histopathological analysis following biopsy confirmed the diagnosis of HNF-1α-inactivated hepatocellular adenoma
I-HCAs typically exhibit persistent enhancement rather than washout. The “atoll sign” occurs in only 30% but demonstrates high specificity when present (Fig. 10) [16].
Fig. 10
Inflammatory hepatocellular adenomas in a 21-year-old man with glycogen storage disease type I. A mass (arrowheads) located in segment 8 shows clear hyperintensity on fat-suppressed T2-weighted image, with an atoll sign evident (a). The mass displays hyperintensity on pre-contrast image (b), non-rim arterial phase hyperenhancement (c) without portal venous washout (d), and hyperenhancement on the transitional phase image (e). The mass shows homogeneous hypointensity on the hepatobiliary phase image (f). Multiple additional small nodules (arrows), suspicious for hepatocellular adenoma, are also noted throughout images (a–f)
β-Catenin-mutated HCA (β-HCA) presents significant diagnostic challenges due to imaging similarities with HCC, exhibiting non-rim APHE and HBP hyperintensity. The absence of washout serves as a key differentiating feature (Fig. 11). β-HCAs demonstrate substantially higher malignant potential, with exon 3-mutated β-HCAs showing a 20–40% transformation rate [16]. Exon 3 mutations show strong, diffuse glutamine synthetase (GS) expression, while other mutations show patchy staining [17]. Theoretically, exon 3-mutated HCAs should show distinct HBP hyperintensity, but this relationship requires further investigation [16].
Fig. 11
β-Catenin-mutated hepatocellular adenoma in a 23-year-old man. A mass (arrowheads) located in the lateral segment demonstrates an isointense signal on both the fat-suppressed T2-weighted image (a) and the pre-contrast image (b). The mass displays non-rim arterial phase hyperenhancement (c) without portal venous washout (d) and hypointensity on the transitional phase image (e). The mass shows homogeneous hyperintensity on the hepatobiliary phase image (f). The nodule was pathologically proven to be β-catenin-mutated hepatocellular adenoma following surgical resection. Imaging characteristics do not reliably differentiate this lesion from hepatocellular carcinoma; however, the absence of portal venous washout may serve as a useful distinguishing feature
Differentiation from other liver tumorsIntrahepatic cholangiocarcinoma (iCCA)Non-HCC malignancies, including iCCA, frequently exhibit a targetoid imaging appearance, characterized by rim APHE, Peripheral “washout,” Delayed central enhancement, targetoid restriction on diffusion-weighted image, and targetoid transitional phase or HBP (Fig. 12) [7]. These targetoid imaging appearances are a key imaging feature for distinguishing iCCA from HCC on gadoxetic acid-enhanced MRI.
Fig. 12
Two types of mass-forming intrahepatic cholangiocarcinoma (ICC) in a 63-year-old woman (a–d) and a 69-year-old man with hepatitis C virus-related cirrhosis (e–h). In the 63-year-old woman, ICC at the posterior segment (arrowheads) shows hyperintensity on fat-suppressed T2-weighted imaging (a), target appearance in the arterial phase (b), and portal venous phase (c), as well as intermediate signal intensity or target appearance (arrow) in the hepatobiliary phase (d), a pattern referred to as “cloud enhancement.” In the 69-year-old man, ICC at the anterior segment (arrowheads) shows hyperintensity on fat-suppressed T2-weighted imaging (e), arterial phase hyperenhancement (f) with portal venous washout (g), and hypointensity in the hepatobiliary phase (h). Differentiation from hepatocellular carcinoma is challenging based on imaging features
The targetoid appearance in the HBP, also referred to as “cloud enhancement,” is attributed to contrast retention within the expanded extracellular volume caused by fibrous stroma, similar to that observed with conventional extracellular contrast agents [18]. However, diagnostic challenges arise because atypical HCCs with prominent fibrosis or central scars can mimic iCCA, and “small duct type” iCCAs can exhibit non-rim APHE and diffusion restriction, resembling HCC (Fig. 12) [19].
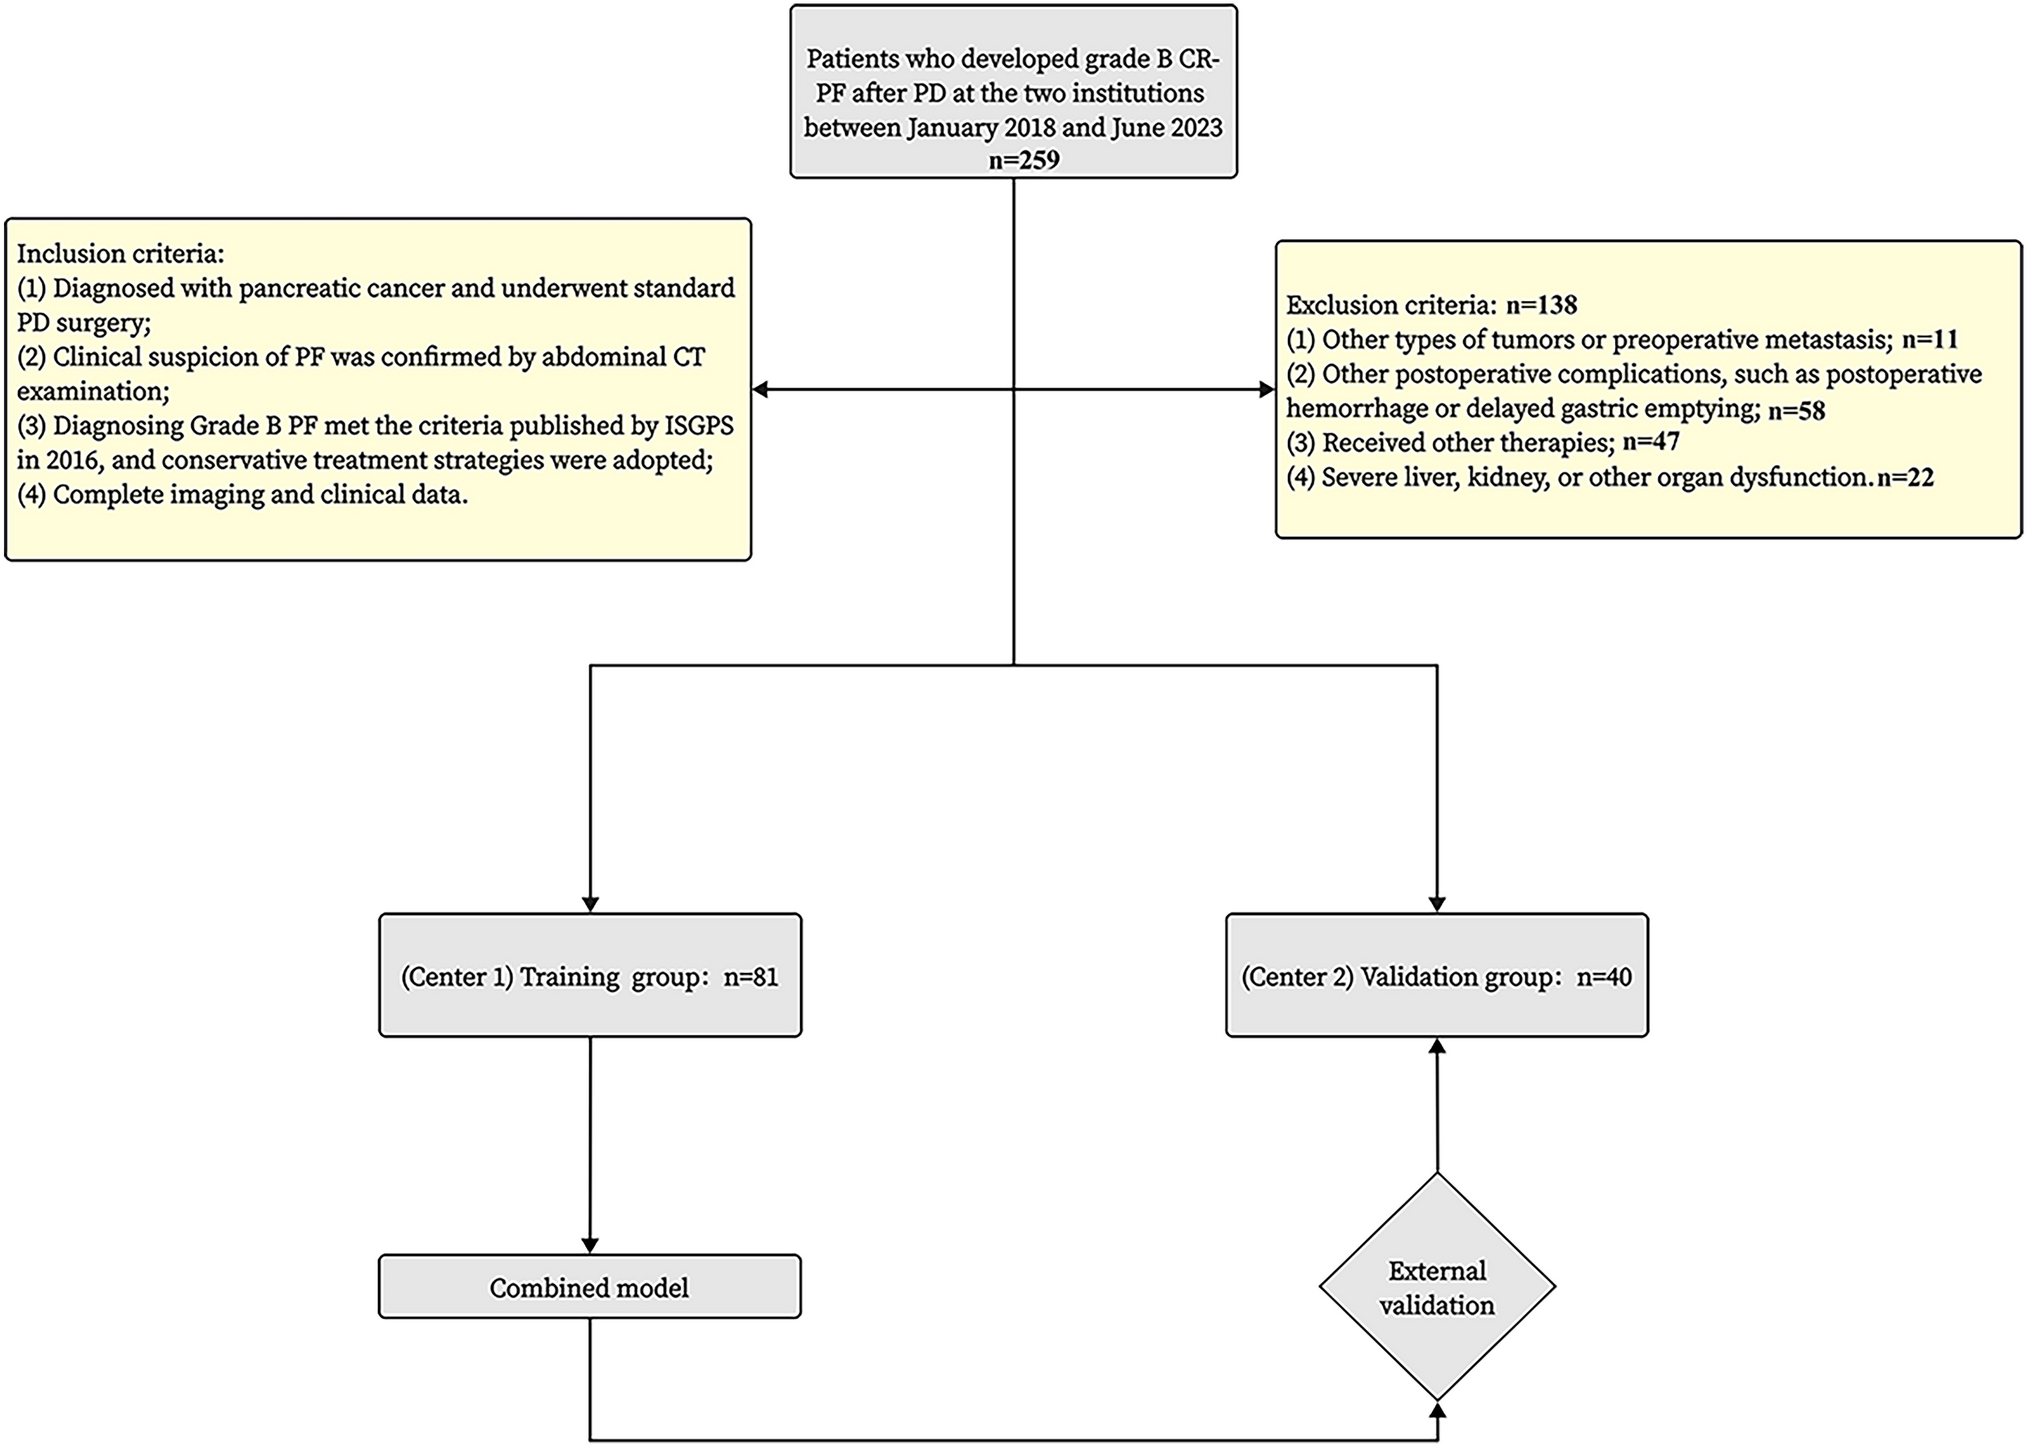
Liver metastasisHypovascular liver metastases show similar low signal intensity on HBP imaging; however, they typically exhibit rim APHE, allowing for differentiation [19]. Nevertheless, metastases from hypervascular primary tumors, such as neuroendocrine neoplasms or renal cell carcinoma, often demonstrate non-rim APHE with portal venous washout and HBP hypointensity, making differentiation challenging (Fig. 13) [20]. The existence or previous history of primary malignancy represents the most important diagnostic consideration.
Fig. 13
Liver metastasis and cavernous hemangioma in a 60-year-old woman with a history of pancreatic neuroendocrine neoplasm (G2). A small hypervascular liver metastasis (arrowheads) displays lower apparent diffusion coefficient values compared to the background liver (a). Hypervascular liver metastasis (arrowheads) displays slight hypointensity on the pre-contrast image (b), non-rim arterial phase hyperenhancement (c) with portal venous washout (d), hypointensity in the transitional phase (e), and clear hypointensity in the hepatobiliary phase (f). In contrast, a cavernous hemangioma (arrows) displays higher apparent diffusion coefficient values compared to the background liver (a). Hemangioma (arrow) displays hypointensity on the pre-contrast image (b), peripheral nodular enhancement during the arterial phase (c), and progressive centripetal fill-in in the portal venous phase (d). In the transitional phase (e), hemangioma exhibits pseudo-washout and appears distinctly hypointense in the hepatobiliary phase (f)
Role in HCC surveillanceComparison of gadoxetic acid-enhanced MRI with ultrasound and CT in surveillance programsThe primary objective of HCC surveillance programs is early detection—ideally at very early or early stages—when curative treatments are most feasible and effective. Biannual US remains the standard surveillance method owing to its accessibility, safety, and low cost. However, US frequently suffers from low sensitivity and a high rate of technically inadequate examinations, limiting its effectiveness [4, 5, 21].
Gadoxetic acid-enhanced MRI demonstrates superior diagnostic performance compared to conventional modalities, including US and contrast-enhanced CT or MRI with extracellular contrast agents. While contrast-enhanced US achieved 84% sensitivity, gadoxetic acid-enhanced MRI provided the highest pooled per-lesion sensitivity (86%) and positive predictive value (94%) [22]. This advantage is particularly pronounced for lesions < 30 mm, where gadoxetic acid-enhanced MRI shows significantly higher sensitivity than contrast-enhanced US while maintaining comparable specificity [23].
In high-risk populations, surveillance with gadoxetic acid-enhanced MRI yielded a higher HCC detection rate (86.0%) and lower false-positive findings (3.0%) compared to US (27.9% and 5.6%, respectively) [4]. Similarly, meta-analyses demonstrate superior performance over contrast-enhanced CT, with a pooled sensitivity of 0.91 for gadoxetic acid-enhanced MRI using 3 T scanners versus 0.74 for CT [
Comments (0)