
Remember me


To understand how an extra copy of Hsa21 changes the abundance of proteins within the brain in the context of AD, we quantified the abundance of proteins by label-free mass spectrometry of the frozen frontal cortex (BA10) in individuals with DSAD, EOAD, and HA controls. We identified 2855 proteins with 2 or more unique peptides in the study; we observed that 241 proteins were significantly different between case types (Supplementary Information 1; Tables 4, 5, 6, Fig. 1).
Table 4 Significantly increased chromosome 21 encoded proteins in DSAD frontal cortexTable 5 Significantly increased non-chromosome 21 encoded proteins in DSAD frontal cortexTable 6 Significantly decreased non-chromosome 21 encoded proteins in DSAD frontal cortexFig. 1
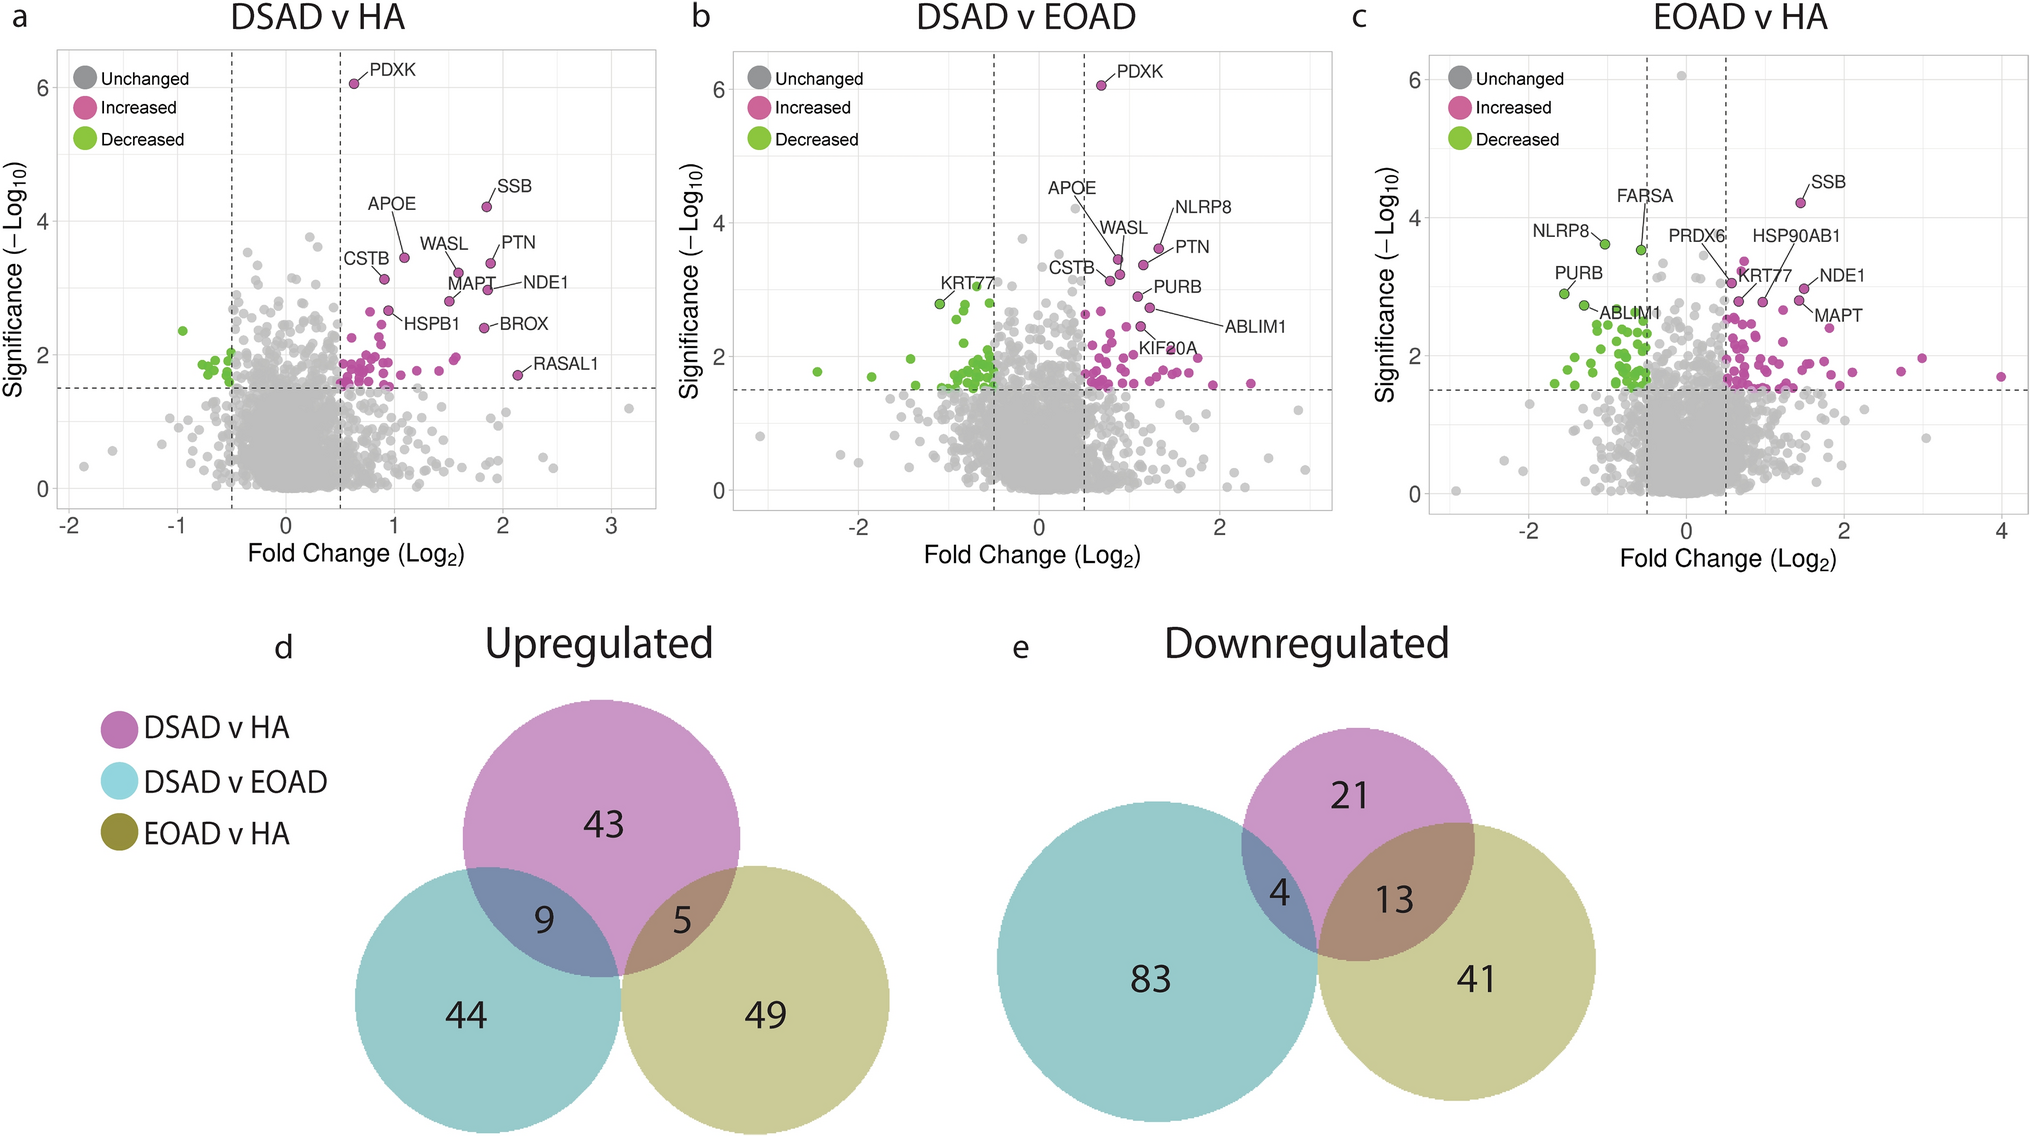
Up- and downregulated proteins between DSAD, EOAD, and HA control frontal cortex by label-free proteomics. Volcano plots show Log2(Fold-change) between case types, a DSAD compared with HA control, b DSAD compared with EOAD, and c EOAD compared with HA control, plotted against − Log10(ANOVA p), using fold-change threshold of ± 0.5 and a significance threshold of 1.5, created using VolcaNoseR [19]. The top 10 dysregulated proteins are labelled on each plot. Venn diagrams, created in BioVenn [30], demonstrate the common d upregulated and e downregulated proteins across the three comparisons of DSAD v HA, DSAD v EOAD, and EOAD v HA. Discovery cohort n = 4 HA, n = 8 DSAD, n = 3 EOAD
In this study, we primarily aimed to identify proteins that had altered abundance due to trisomy 21. Thus, we first focused on Hsa21-encoded proteins within the dataset which we hypothesised would have increased abundance due to the dosage imbalance caused by the extra copy of Hsa21. We identified 23 Hsa21-encoded proteins (Supplementary Information 1) and found that 7 of these were significantly increased in DSAD cases compared with either HA or cases of EOAD (Table 4). These findings were consistent with previous reports of increased abundance of APP (amyloid precursor protein), S100B (S100 calcium-binding protein B), and SYNJ1 (synaptojanin-1) in the frontal cortex and CSTB (cystatin-B) in the temporal cortex of people with DSAD [45, 58, 71]. Our finding of raised PDXK (pyridoxal kinase), contrasts with a previous report that the protein was not elevated in the brains of individuals with DS at ~ 19 week gestation [62], but is consistent with a recent proteomics report [43]. Raised abundance of CBR1 (carbonyl reductase 1) and PFKL (6-phosphofructokinase) in the brain of individuals with DSAD has recently been reported [43]. We notably detected multiple Hsa21-encoded proteins, such as CCT8 and USP16, in the frontal cortex with similar abundance in all three case types (CCT8 HA x̄ = 62,003, DSAD x̄ = 64,142, EOAD x̄ = 62,610, and USP16 HA x̄ = 868, DSAD x̄ = 873, EOAD x̄ = 844) (Supplementary Information 1). Thus, an additional copy of a Hsa21 gene due to trisomy does not always result in an elevation of protein abundance.
To identify proteins encoded by genes on other chromosomes with altered abundance in DSAD compared to EOAD or HA controls, we examined all significantly changed proteins (Supplementary Information 1) that were altered ± 1.25-fold. This identified 71 upregulated proteins that were not encoded by Hsa21 (Table 5, Fig. 1a–d). Notably, we identified that APOE (apolipoprotein E), encoded on chromosome 19, was upregulated in DSAD compared to both EOAD and HA controls (Table 5, Fig. 1a, b). APOE is a lipoprotein involved in the transport of cholesterol and phospholipids between cells, and allelic variation in the APOE gene is a strong genetic risk factor for AD [16, 44]. We identified 64 unique peptides that mapped to APOE, and 16 of these were significantly elevated in DSAD cases, suggesting that upregulation of the proteins’ abundance in the frontal cortex is caused by trisomy of Hsa21 (Supplementary Information 1). Similarly, we also identified that LRP1 (Prolow-density lipoprotein receptor-related protein 1), ATOX1 (Copper transport protein ATOX1), and EIF4E (Eukaryotic translation initiation factor 4E) were elevated in DSAD compared with both HA and EOAD controls, indicating that their upregulation is likely to be driven by trisomy 21.
We also identified 67 proteins encoded by chromosomes other than Hsa21 that were downregulated in DSAD compared to EOAD or HA controls (Table 6). This included UQCRB (Cytochrome b-c1 complex subunit 7), and STX1B (Syntaxin-1B) that were downregulated in the brains of individuals with DSAD compared with both EOAD and HA groups (Table 6, Fig. 1). Our analysis found 5 proteins that were commonly upregulated, and 13 proteins that were commonly downregulated, in DSAD compared with HA, and EOAD compared with HA, suggesting that these proteins were dysregulated due to similar mechanisms of AD (Fig. 1d, e).
To further understand these data, IPA was used to identify altered canonical pathways when comparing DSAD with HA, DSAD with EOAD, and EOAD with HA. Considerable overlap in the pathways altered was observed when comparing DSAD with HA, and EOAD with HA, including upregulation of both neutrophil degranulation and mitochondrial dysfunction, and a downregulation of oxidative phosphorylation (Supplementary Fig. 1). This highlights mechanistic overlaps between AD in people who have DS and individuals in the general population.
The transcriptome is altered in the frontal cortex of individuals with DSAD compared with EOAD and HA in a range of cell typesTo determine which cell types may contribute to the identified changes in protein abundance in DSAD, we undertook a snRNAseq study in the same cases which underwent proteomic analysis (discovery cohort, Table 1). We sequenced the transcriptome of nuclei gathered from the 16 cases. After quality control preprocessing, we recovered a total of 89,649 nuclei across all samples of which we identified a total of 38 molecularly unique clusters (Fig. 2a). Less than 5000 nuclei were obtained from four cases; two DSAD cases (DSAD6, DSAD8) and two EOAD cases (EOAD2, EOAD3), but we have included these cases in our analysis to maintain a balanced sample size (Fig. 2b, Supplementary Information 2). RNA integrity was not found to correlate with the number of nuclei recovered (Pearson’s R = 0.2255 p = 0.4382) (Supplementary Table 2). We noted that for multiple cell types, less than 10 nuclei were recovered from some cases; thus, any identified differential expression should be treated as preliminary and requires independent validation (Fig. 2a, b, Supplementary Information 2).
Fig. 2
Single-nuclei RNA-sequencing demonstrates differential expression of chromosome 21 genes in a broad range of cell types, and upregulation of APOE in astrocytes, endothelial cells, and pericytes, in DSAD compared with EOAD and HA controls. a Annotated UMAP demonstrates nuclei clusters identified. b UMAP demonstrates the identified nuclei by case type. c–j UMAP demonstrates the molecular identity of each cluster; neurons (RBFOX3), excitatory neurons (SATB2), inhibitory neurons (GAD2), pericytes (PDGFRB), oligodendrocytes (MOBP), astrocytes (ALDH1L1), microglia (TYROBP), and endothelial cells (CD34). This is further elaborated on in k with a dot plot showing multiple cellular markers used to identify cell clusters. l The total number of differentially expressed genes (DEGs) detected across nuclei clusters (magenta = upregulated, green = downregulated). m, n Hsa21-encoded genes identified in the proteomics dataset, and other commonly investigated Hsa21 genes, are significantly upregulated across multiple cell types in DSAD compared to EOAD and HA, respectively. o–q Non-Hsa21 genes which were significantly different between DSAD and both HA and EOAD case types in the proteomic study are represented in dot plots. o, q APOE is significantly upregulated in astrocytes in DSAD compared to HA, and in astrocytes, endothelial cells and pericytes in DSAD compared to EOAD. Discovery cohort n = 4 HA, n = 8 DSAD, n = 4 EOAD
Of the 38 clusters, we identified all the main neural cell types (Fig. 2c–k). This included eight excitatory neuronal clusters, four distinct inhibitory neuronal clusters (VIP, SST, PVALB, and LAMP5), as well as glial cells; 13 oligodendrocyte, two microglial, four astrocytic, and two oligodendrocyte precursor cell (OPCs) clusters. We also collected nuclei expressing endothelial cell, T cell, fibroblast, and pericyte markers. Differential transcript expression identified increased transcriptomic variability in the astrocytic and excitatory neuron clusters of DSAD when compared to EOAD and HA groups, with fewer but significant changes in transcript expression seen in microglia, isolated oligodendrocytes, and OPCs clusters (Fig. 2l).
We found increased expression of the Hsa21 genes that also had elevated protein levels in our proteomic study, as well as other Hsa21 genes that we did not identify by mass spectrometry in our proteomic analysis, in DSAD cases compared with euploid controls (Fig. 2m, n). We observed an elevation of Hsa21 transcript expression in a range of cell types in DSAD cases compared to HA or EOAD controls. Consistent with a previous report, we found elevated expression of APP in many cell types in the frontal cortex (Fig. 2m, n) [51]. Re-analysis of a previously published snRNAseq dataset, also showed the significant upregulation in APP expression in astrocytes and microglia in DSAD compared to healthy controls [41]. Using immunofluorescence co-staining, we found evidence of APP staining within GFAP positive cells in HA, DSAD, and EOAD cases, suggesting that APP protein can be produced in astrocytes (Supplementary Fig. 2), consistent with a recent report in trisomy 21 iPSC-derived astrocytes that showed upregulation of APP [64]. Together, these data highlight that further research on the effect of elevation of this key AD protein in the development of DSAD in cells other than neurons is warranted.
Of the Hsa21 proteins we identified to have increased abundance in our proteomic study, CSTB was found to have elevated expression in subtypes of astrocytes, and PDKX was raised in a broad range of cell types (Fig. 2m, n). SYNJ1 had increased expression in multiple excitatory and inhibitory neuronal populations, as well as populations of oligodendrocyte precursor cells (OPCs). CBR1 expression was found to be elevated by trisomy of Hsa21 in a subtype of astrocytes and excitatory neurons (Fig. 2m, n). S100B had increased expression in astrocytes and OPCs, and PFKL in a subtype of astrocytes, OPCs, and excitatory neurons (Fig. 2m, n). Although CCT8 and USP16 were not observed to have changed abundance at the protein level (Supplementary Information 1), expressions of these Hsa21 genes were elevated in several cell types in the cases of DSAD, demonstrating that altered transcript abundance does not always result in changes to protein levels due to endogenous regulatory mechanisms (Fig. 2m, n). These data are consistent with a previous report comparing bulk proteomics and bulk RNAseq in brain samples from young individuals with DS compared with euploid-matched controls, which also reported a discordance between transcript and protein levels [56]. Moreover, the protein products of some genes that were significantly increased in expression in DSAD in a broad range of cell types, such as NCAM2 and SON, were not identified in our mass spectrometry, showing discordance between snRNAseq and proteomic results. This may be affected by the sensitivity and depth of coverage of these experiments, and further validation is required to study targets not identified within these studies. A few Hsa21 genes have significantly altered expression between EOAD and HA in both the proteomic and transcriptomic datasets, showing the specific effect of three copies of Hsa21 on the expression of genes on this chromosome (Supplementary Fig. 3, Table 4).
To understand the cell types that may be contributing to the observed wider dysregulation of the proteome we observed in DSAD, we similarly analysed the cell types in which non-Hsa21 proteins had altered transcript expression (Fig. 2o–q). For this study, we focused on proteins we found to be commonly up- or downregulated in DSAD compared to both EOAD and HA groups. This analysis identified that APOE expression was upregulated in endothelial (CD34 expressing, Fig. 2j), pericytic (PDGFRB expressing, Fig. 2f), and astrocytic (AQP4, ALDH1L or GFAP expressing, Fig. 2h) nuclei in DSAD compared to EOAD, and in a second subtype of astrocytes in DSAD compared to HA (Fig. 2n). In support of these data, re-analysis of a previously published snRNAseq dataset showed the upregulated expression of APOE in astrocytes in DSAD compared to healthy controls [49]. Thus, these cells may be the source of the increased abundance of the protein we observed in the frontal cortex of individuals who had DSAD. Moreover, we observed a decrease in the expression of APOE in a subtype of microglia (CX3CR1, ITGAM, AIF1, or P2RY12 expressing, Fig. 2i) when comparing DSAD and EOAD.
To further understand cellular changes that may contribute to elevated APOE transcript in DSAD, we used IPA to identify pathways that differed between case types. We focused this analysis on the cell types in which we had observed increased APOE expression. In astrocyte cluster 2, we found many common pathways changed in both the DSAD with HA, and DSAD with EOAD comparisons. In contrast, we observed little overlap in perturbed pathways between the DSAD with HA, and EOAD with HA comparisons. This indicates that the changes in this astrocyte subtype are likely to be driven by trisomy 21 rather than being a result of general AD pathology (Supplementary Fig. 4). Upregulated pathways included phagosome formation, serotonin receptor signalling, and protein ubiquitination pathways (Supplementary Fig. 4). In the endothelial cell cluster, IPA of DSAD compared with HA and DSAD compared with EOAD indicated an upregulation in synaptogenesis signalling and mitochondrial dysfunction pathways in both comparisons (Supplementary Fig. 5). In endothelial cells, we also observed some overlap between upregulated pathways between the DSAD with HA and the EOAD with HA comparisons. This indicates that the changes in endothelial cells we observed may be in part the result of AD pathology. In the pericyte cell cluster, fewer pathways have enough enriched transcripts to predict the direction of change in the DSAD with HA and EOAD with HA comparisons, limiting the interpretation of these data (Supplementary Fig. 6). Overall, this analysis indicates that trisomy of chromosome 21 may alter the biology of a subtype of astrocytes in the context of AD pathology, and both AD pathology and trisomy of chromosome 21 may affect the biology of endothelial cells.
APOE abundance is increased in DSAD compared to AD in the frontal cortexOur proteomic and transcriptomic study indicated that trisomy 21 leads to raised APOE abundance in the brains of people with DSAD. APOE has a known key role in AD-related processes including amyloid-β clearance and aggregation, the immune response to pathology, tau pathology development, and the maintenance of cerebrovascular homeostasis [44]. The isoform variation of the protein is associated with an increased risk of developing AD in the general population [11, 16, 44]. Moreover, very limited data show that this protein has a different abundance in DSAD. Thus, we focused on validating our observed APOE omics changes to provide new insight into DSAD.
Our initial data indicated that trisomy 21 may cause an increase in APOE protein in individuals with DSAD compared to individuals who are not trisomic for Hsa21. To validate this hypothesis, we quantified APOE abundance in two larger case series of human post-mortem samples, including both our discovery cohort (Table 1) and validation cohort A (Table 2), by western blot using two different anti-APOE antibodies which bind to epitopes in different parts of the APOE protein sequence (Polyclonal Goat, Calbiochem, 178479; Polyclonal Rabbit anti-APOE, C-terminus epitope, Sigma, SAB2701946). Consistent with our proteomic result, our western blot analysis using both antibodies showed that APOE abundance was significantly higher in DSAD compared to EOAD (Fig. 3a, b, e, f). To determine if a difference in the abundance of APOE transcript was observed between these cases in total tissue, we undertook RT-qPCR on total RNA isolated from the frontal cortex in discovery and validation cohort A samples. Using this method, we found that APOE transcript was higher in DSAD and HA controls compared with EOAD (Fig. 3 i). To further understand the variability in APOE transcript we observed, we measured the RIN of the RNA samples (Supplementary Table 2). RIN was variable but was not affected by age, sex or PMI. RIN was affected by case type [univariate ANOVA, F(2,35) = 8.967, p < 0.001], such that EOAD had the lowest mean RIN at 3.4, with DSAD and HA samples having mean RIN of 5.1 and 5.3, respectively. RIN was also affected by Braak and Braak NFT stage [univariate ANOVA, F(1,35) = 5.453, p = 0.025].
Fig. 3
APOE abundance is increased in DSAD compared to matched cases of EOAD at protein and transcript level, independent of APOE genotype. a–d Representative western blots for APOE (Calbiochem, 178,479), APOE C-terminal (Sigma, SAB2701946), and Revert 700 total protein stain (Licor bio, 926–11,016) in frontal cortex samples from a, b discovery and validation cohort A (n = 14 HA, n = 18 DSAD, n = 14 EOAD), and c, d validation cohort B (n = 6 YC, n = 6 DS, n = 10 DSAD, n = 10 LOAD). e Case type significantly alters APOE abundance (Calbiochem) [Univariate ANOVA F(2,43) = 4.381, p = 0.019], with APOE abundance significantly higher in DSAD than EOAD (post hoc comparison with Bonferroni p = 0.015). f Case type significantly alters APOE abundance (Sigma) [Univariate ANOVA F(2,43) = 4.696, p = 0.014], with APOE abundance significantly higher in DSAD than EOAD (post hoc comparison with Bonferroni p = 0.012). No effect of sex, age at death, or PMI was found for either antibody in the discovery and validation A cohorts. g Case type significantly alters APOE abundance (Calbiochem), in validation cohort B [Univariate ANOVA, F(3,28) = 5.541, p = 0.004], with APOE abundance significantly higher in DSAD than YC (post hoc correction with Bonferroni, p = 0.033) and in DSAD than LOAD (p = 0.005). No effect of sex, age at death, or PMI was found. h Case type significantly alters APOE abundance (Sigma), in validation cohort B [Univariate ANOVA, F(3,28) = 6.099, p = 0.003], with APOE being significantly higher in DS than LOAD (post hoc comparison with Bonferroni, p = 0.002), and in DSAD than LOAD (p = 0.040). A significant interaction of age at death and case type was identified (F(1,22) = 6.169, p = 0.021), but no effect of sex or PMI were identified. i In qPCR from bulk frontal cortex tissue homogenate, case type alters APOE expression [Univariate ANOVA F(2,38) = 5.373, p = 0.009], with higher APOE expression in HA and DSAD than EOAD (post hoc comparison with Bonferroni p = 0.004 and p = 0.033 respectively). APOE abundance by APOE genotype as detected by western blot (j, l) APOE (Calbiochem) (k, m), and APOE (Sigma), and by n mass spectrometry. l, m APOE genotype only available for DSAD and LOAD groups, so only these cases included in analysis. APOE genotype had no effect on APOE abundance by western blot (j) (Calbiochem) in discovery and validation cohort A [Univariate ANOVA, F(3,42) = 0.333, p = 0.802], k (Sigma) in discovery and validation cohort A [Univariate ANOVA, F(3,42) = 0.624, p = 0.604], l (Calbiochem) in validation cohort B [Univariate ANOVA, F(5,26) = 1.142, p = 0.364], m (Sigma) in validation cohort B (Univariate ANOVA, F(5,26) = 1.488, p = 0.228), n or by mass spectrometry [Univariate ANOVA F(2,12) = 0.055, p = 0.947]. e, f, i, j, k Discovery and validation cohort A, n = 14 HA, n = 18 DSAD, n = 14 EOAD; g, h, l, m validation cohort B, n = 6 YC, n = 6 DS, n = 10 DSAD, n = 10 LOAD, (n) discovery cohort, n = 4 HA, n = 10 DSAD, n = 4 EOAD. Data expressed as mean ± SEM, *p < 0.05, **p < 0.01
In our initial study, we compared DSAD with age-matched cases of EOAD from the general population, to control for the young age of onset that occurs in DSAD, and the known effects of ageing on the proteome [4]. These cases of euploid EOAD may not be typical of AD more broadly, and the young age of onset of disease may be the result of genetic or environmental risk factors. To address this limitation, we wanted to determine if the observed increased in APOE in DSAD compared to EOAD was also true for other types of AD, such as LOAD, which have a significantly later age of disease onset. We therefore expanded our study to examine if APOE abundance was altered in further samples from individuals who had DSAD compared with LOAD samples [Validation cohort B, Table 3, DSAD (n = 10) and LOAD (n = 10)]. These cases were not matched for age because of the different age of onset of these two forms of AD. Moreover, we also wanted to understand if increased APOE was caused by trisomy 21 alone, or due to an interaction of trisomy 21 and AD. Thus, we also expand our study to examine APOE abundance in samples from young individuals with DS, prior to AD onset compared with age-matched euploid samples [Validation cohort B, Table 3, DS (n = 6) and age-matched controls (YC) (n = 6)].
We found that APOE abundance is significantly higher in DSAD than LOAD (Fig. 3c, d, g, h), supporting our initial findings that APOE is increased in DSAD compared to AD without DS. Moreover, we show that APOE abundance is significantly higher in DSAD than in YC (Calbiochem antibody only) (Fig. 3g). Whether APOE is increased in the brains of young individuals with DS, before the onset of AD, is still unclear. No significant changes between DS and YC were detected using either antibody (Fig. 3g, h). However, we show that APOE abundance is higher in DS than in LOAD (Sigma antibody only), with values comparable to the DSAD group (Fig. 3h). Overall, we are underpowered for our frontal cortex YC and DS cases in this study, due to the low number of samples to which we had access. To address this limitation, we measured APOE abundance in posterior cingulate cortex samples of YC and DS cases (n = 11 per group) (Supplementary Table 1). No significant difference in APOE abundance was identified between YC and DS cases using either antibody, but we find a significant effect of age at death, and a negative correlation between age at death and APOE abundance in these samples (Supplementary Fig. 7a–f). Whether an increase in APOE abundance is specific to DSAD cases or is only a region-specific phenotype in the frontal cortex requires further investigation.
We also had the opportunity to measure APOE abundance in the frontal cortex from an individual who had partial trisomy without the APP gene region [12]. As only one case of partial trisomy 21 was included, conclusions on APOE abundance in this individual cannot be made; however, APOE abundance in this sample was comparable to DS and DSAD (Supplementary Fig. 8).
To understand the spatial pattern of APOE in each of the case types, immunohistochemistry was carried out for APOE. As previously reported [39], APOE staining resembles the pattern of amyloid-β plaque pathology in DSAD and EOAD cases, with minimal staining in HA cases (Supplementary Fig. 9). We also found that in DSAD cases, APOE also stains leptomeningeal and parenchymal vessel structures, which may reflect antibody binding to the amyloid found in the vessels due to CAA, which has a high occurrence in DSAD [25, 26, 36, 40], or staining of vascular cells.
Differences in APOE abundance between DSAD and EOAD are not the result of technical outliersFor western blots carried out on the discovery and validation A cohorts of HA, DSAD, and EOAD samples, three cases had significantly lower total protein abundance than other cases. This resulted in three technical outliers (as measured by the ROUT method Q = 1%) for these western blots, two in the DSAD group, and one in the HA group, with higher abundances than other samples. To understand the effect of these technical outliers on our overall results, we repeated the statistical analysis removing the three cases. When removed from univariate ANOVA analysis, we continued to see a significant effect of case type on APOE abundance (Calbiochem) [Univariate ANOVA, F(2,40) = 5.005, p = 0.011)] with DSAD being significantly higher than EOAD (post hoc correction with Bonferroni, p = 0.010). A significant interaction of case type and sex was found (F(2,21) = 4.992, p = 0.017), but no effect of age at death, APOE genotype or PMI was found. We also continue to see a significant effect of case type on APOE abundance (Sigma) [Univariate ANOVA, F(2, 43) = 15.386, p < 0.001] with APOE being significantly higher in DSAD than EOAD (post hoc correction with Bonferroni, p < 0.001), and APOE being significantly lower in EOAD than HA (post hoc correction with Bonferroni, p = 0.011). A significant effect of PMI was identified (F(1,21) = 4.708, p = 0.042). No effect of sex, age at death, or APOE genotype were identified. Thus, differences in protein abundance between cases did not alter our finding that APOE abundance is elevated in DSAD compared to matched cases of EOAD.
APOE abundance and APOE genotypeAPOE genotype is known to influence AD risk, and our study contained a range of APOE genotypes. Thus, we examined the effect of APOE genotype on APOE abundance. No effect of APOE genotype was identified by western blot using either APOE antibody across cohorts, or by mass spectrometry proteomics (Fig. 3j–n). However, our proteomic study was underpowered to make pairwise comparisons between all APOE genotypes (Fig. 3n), as we only had one APOE ε2ε3 case, ten APOE ε3ε3 cases, and four APOE ε3ε4 cases; thus, further investigation is necessary to interpret the effect of APOE genotype on APOE abundance as detected by mass spectrometry. In our western blot study of validation cohort B, we did not have APOE genotype data on YC or DS cases, and so, only DSAD and LOAD cases were included in the analysis. In these groups, only one APOE ε2ε2, one APOE ε2ε3, and two APOE ε2ε4 cases were included, and so, we were underpowered to assess the effects of these genotypes on APOE abundance (Fig. 3l, m). However, the data we have indicate that the observed increase in APOE abundance in DSAD may not relate to APOE genotype.
APOE abundance correlates with the abundance of APP, APP-CTFs, and amyloid-β, in the frontal cortex of DSAD and EOAD casesWe hypothesised that the increased abundance of APOE in the frontal cortex of individuals with DSAD was due to having an additional copy of a gene or genes on Hsa21. To identify which Hsa21-encoded proteins might contribute to this, we undertook correlation analysis of APOE and Hsa21-encoded proteins within our proteomic dataset. When all cases were included, APOE abundance significantly correlates with the abundances of APP, PDXK, S100B, CSTB, and SYNJ1 (Table 7). To determine if the DSAD cases were driving the correlations we observed between these Hsa21 candidates and APOE abundance, we analysed only EOAD and HA cases (euploid cases), excluding the DSAD cases. In this sub-analysis, only the correlation between APOE and APP (Slope = 2.984, Pearson’s R = 0.8442, F(1,5) = 12.41, p = 0.0169), and APOE and S100B (Slope = 8.939, Pearson’s R = 0.7859, F(1,5) = 8.077, p = 0.0362) replicated (Table 7). Thus, we took these two proteins forward as lead Hsa21 candidates to investigate their role in increased APOE in DSAD compared with EOAD.
Table 7 Correlation of the abundance of chromosome 21 encoded proteins and APOE in cases of HA, DSAD, and EOAD frontal cortexWe hypothesised that raised APOE in individuals with DSAD is the result of raised abundance of APP or/and S100B. We tested this by western blot and correlation analysis of APP and S100B with APOE abundance in our discovery cohort and validation cohort A samples. Consistent with our proteomic analysis and a previous report [58], we found that APP abundance was increased in the DSAD frontal cortex (Fig. 4d, e). In contrast, we did not find a significant increase in S100B abundance in the frontal cortex of DSAD cases (Fig. 4a, b). Consistent with our proteomic data correlation analysis (Table 7), we found a significant positive correlation between APOE abundance and full-length APP. We also found that APP had increased expression in the same cell types as APOE in our snRNAseq transcriptomic study (Fig. 3m, n). However, in contrast to our proteomic data, by western blot, we found a significant negative correlation between APOE and S100B abundance (Fig. 4c, h).
Fig. 4
The abundance of APOE correlates with full-length APP, APP C-terminal fragments, and amyloid-β40 in frontal cortex. a Representative western blot for S100B (Abcam, ab41548) and Revert 700 total protein stain (Licor bio, 926–11,016) in frontal cortex samples from the discovery cohort and validation cohort A. b Relative S100B abundance does not significantly differ between case types [Univariate ANOVA, F(2,38) = 2.188, p = 0.126]. c S100B abundance negatively correlates with APOE abundance [Slope = − 0.8321, Pearson’s R = − 0.5074, F(1,41) = 14.21, p = 0.0005]. d Representative western blot for APP (Abcam, Y188) showing bands representing full-length APP (FL-APP), APP-C-terminal fragment-α (CTF-α), APP-C-terminal fragment-β (CTF-β), and Revert 700 total protein stain (Licor bio, 926–11,016) in frontal cortex samples from the discovery cohort and validation cohort A. e FL-APP abundance is significantly different between case types [Univariate ANOVA, F(2,38) = 7.155, p = 0.002], being elevated in DSAD compared to EOAD (post hoc correction with Bonferroni, p < 0.0001), and tending to be elevated in DSAD compared to HA (p = 0.081). f CTF-α abundance differed between case types [Univariate ANOVA, F(2,38) = 7.025, p = 0.003] with elevated abundance in DSAD compared with EOAD (post hoc correction with Bonferroni, p = 0.001) and DSAD compared with HA (p = 0.038). g CTF-β abundance differed between case types [Univariate ANOVA, F(2,38) = 5.493, p = 0.008] with elevated expression in DSAD compared with EOAD (post hoc correction with Bonferroni, p = 0.003) and tending to be elevated in DSAD compared to HA (p = 0.087). h Correlation of FL-APP with APOE (Calbiochem) western blot abundance showed a significant positive correlation [Slope = 1.358, Pearson’s R = 0.4806, F(1,41) = 12.32, p = 0.0011]. i Correlation of CTF-α with APOE (Calbiochem) western blot abundance showed a significant positive correlation [Slope = 0.2049, Pearson’s R = 0.3695, F(1,41) = 6.482, p = 0.0148]. j Correlation of CTF-β with APOE (Calbiochem) western blot abundance showed a significant positive correlation [Slope = 0.1040, Pearson’s R = 0.3408, F(1,41) = 5.388, p = 0.0253]. k Correlation of FL-APP with APOE (Calbiochem) abundance in validation cohort B did not show a significant relationship [Slope = 0.2387, Pearson’s R = 0.2073, F(1,30) = 1.347, p = 0.2549], n = 6 YC, n = 6 DS, n = 10 DSAD, n = 10 LOAD. MSD amyloid-β multiplex assay was used to quantify the abundance of l–q amyloid-β42 and amyloid-β40 in (l, m) soluble (Tris-buffered salin
Comments (0)