
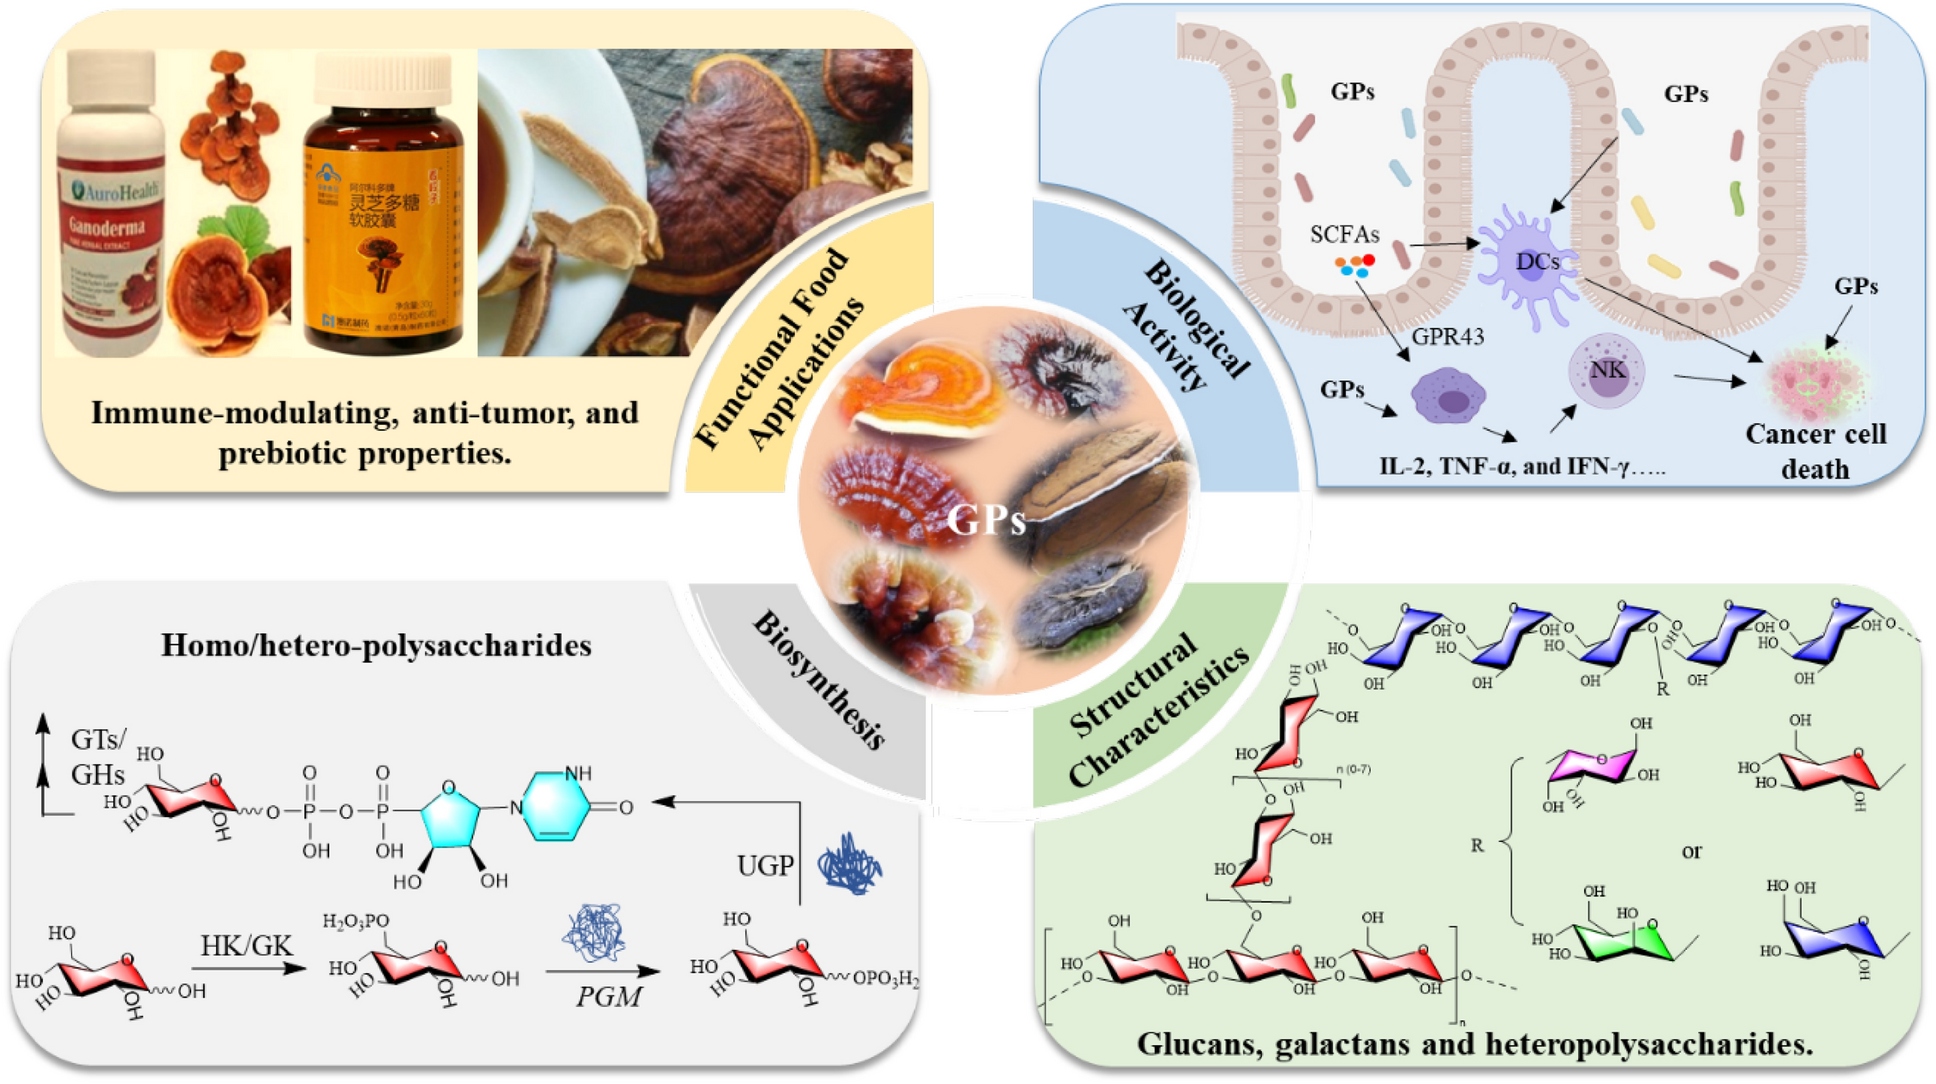
Remember me


To identify ribosomal proteins suitable for TRAP, we focused on those with exposed N-terminal regions, which facilitate efficient tagging and ribosome purification. We used PyMOL software to analyze the crystal structure of the human 80S ribosome (PDB ID: 4UG0) and predicted eight large subunit proteins that met these criteria: RPL7A, RPL10A, RPL11, RPL12, RPL19, RPL31, RPL35, and RPL36. Among these, RPL10A has been previously reported. Additionally, RPL10L was identified as not being exposed on the ribosomal surface (Fig. 1A). To compare the expression and enrichment efficiency of each subunit, we cloned the nine ribosomal large subunit proteins into vectors and transiently transfected them into HEK293T cells. After immunoprecipitation (IP), we detected both the large subunit protein RPL36 and the small subunit protein RPS6 via Western blotting, indicating successful enrichment of intact ribosomes (Fig. 1B and Figure S1A). Consistent with our predictions, RPL10L, which is not exposed on the ribosomal surface, showed the lowest enrichment level. Quantification of the grayscale intensity of the IP samples and input samples revealed that RPL31, RPL35, RPL36, and RPL19 had pronounced fold changes, meeting the requirements for application (Fig. 1C). To further verify that the large subunit proteins of each ribosome can be separated, we extracted RNA and detected the complete RNA components of the 28S, 18S and 5S (Fig. 1D). Under the same conditions, the total RNA amount enriched by RPL31, RPL35, RPL36, RPL19, RPL11, and RPL7A was significantly pronounced, consistent with the protein levels. We used real-time quantitative PCR (RT-qPCR) to detect the enrichment of 18S, GAPDH, P4HA2, and eIF4B genes in each sample (Fig. 1E and Figure S1B). These results suggest that RPL19 exhibits the most significant enrichment efficiency and will be used for subsequent experiments.
Fig. 1
The expression and enrichment efficiency of predicted large ribosomal subunit proteins. A Crystal structure of nine human large ribosomal subunit proteins. The N-terminal regions of RPL7A, RPL10A, RPL11, RPL12, RPL19, RPL31, RPL35, and RPL36 are exposed on the ribosomal surface. The N-terminal regions are indicated in blue, and the C-terminal regions are indicated in red. B–E Plasmids encoding nine predicted large ribosomal subunit proteins were transfected into 293 T cells, followed by collection of cells for endogenous immunoprecipitation as indicated. Cell lysates were used as the input (B). Relative protein expression was quantified using ImageJ software, with the ratio of immunoprecipitation signal (SBP of IP) to the input signal (SBP of input) depicted in a bar graph, n = 2 (C). RNA content was assessed by agarose gel electrophoresis (D). The enrichment of P4HA2 and eIF4B messenger RNA (mRNA) was analyzed by real-time polymerase chain reaction, n = 3 (E). Statistical analysis was performed using one-way ANOVA among multiple groups. Bars with asterisks indicate significant differences from the control at *p ≤ 0.05, **p ≤ 0.01, ***p ≤ 0.001, ****p ≤ 0.0001. Data are represented as mean ± SD
Thapsigargin is a sesquiterpene lactone isolated from the Mediterranean plant species Thapsia [30]. It induces apoptosis in various cell types through Ca2+-mediated mitochondrial permeability transition, and disturbances in Ca2+ storage and associated signaling can lead to endoplasmic reticulum (ER) stress [31]. The transcription factors CHOP and ATF4 are elevated in response to ER stress [32, 33]. To verify the optimization effect of TRAP method, we transfected RPL19 into HEK293T cells for 24 h, treated the cells with 1 μM thapsigargin for 10 h, and utilized TRAP to collect samples for detecting RNA alterations. As expected, protein levels of ATF4 and CHOP were significantly elevated (Figure S1C). In cell lysates, RNA levels of ATF4 increased by twofold, while RNA levels of CHOP increased by fivefold. However, in TRAP affinity-purified RNA, the ATF4 levels increased by twofold, while the CHOP levels increased by sevenfold (Figure S1D). These results strongly suggest that TRAP is more sensitive and rapid in detecting compound-induced RNA changes during a specific time period compared to total RNA.
2.2 Successful establishment of EGFP-RPL19 knock-in cell line using CRISPR technologyTo overcome the limitations of exogenous expression, we constructed stable cell lines using CRISPR knock-in technology [34]. The first exon of RPL19 contains a single start codon ATG, so we inserted an enhanced green fluorescent protein (EGFP) into the N-terminus of the second exon of RPL19, which was verified by PCR (Fig. 2A). After monoclonal screening and culture, we observed that the majority of green fluorescence was distributed in the cytoplasm, consistent with the typical ribosomal distribution (Figure S2A). PCR analysis of three monoclonal cell lines showed consistent bands at 1000 bp in all samples, confirming the successful insertion of the EGFP gene. The presence of two bands in each sample indicated heterozygosity (Figure S2B). Western blotting further confirmed successful insertion of the EGFP gene (Figure S2C). Among these, Clone #1 was selected for further investigation due to its high expression of the EGFP-RPL19 fusion protein.
Fig. 2
Establishment of the EGFP-RPL19 cell line using CRISPR knock-in technology. A Schematic representation of the experimental setup of constructing a cell line stably expressing EGFP-RPL19. B Polyribosome distribution of EGFP-RPL19 knock-in cell line (blue) and HEK293T WT cells (red). C, D Cell lysates from HEK293T and EGFP-RPL19 knock-in cells were immunoprecipitated using EGFP affinity beads. RNA was extracted from the cell lysates and the immunoprecipitated products. RNA content was assessed by agarose gel electrophoresis (C), and the expression of ribosomal proteins RPS3, RPL10A, RPL36, RPL19, and EGFP was analyzed by western blotting (D)
Next, we assessed whether the cell line could reliably and selectively enrich ribosomes and mRNA. The polysome profiling assay was used to separate all ribosomal components within cells. The results showed that the distributions of ribosomal components in the knock-in cells and the HEK293T wild-type (WT) cells were fundamentally consistent, particularly at the 40S, 60S, and 80S positions, where they almost completely overlapped (Fig. 2B). This indicates that the insertion of the EGFP gene does not impact the overall translation level of the cell. We then conducted an IP assay to assess the specificity and efficiency of ribosome enrichment in the EGFP-RPL19 knock-in cells. Agarose gel electrophoresis demonstrated that this cell line can effectively and selectively enrich RNA (Fig. 2C). Furthermore, western blotting analysis revealed that the 50 kDa EGFP-RPL19 fusion protein, free RPL19 protein, and other ribosomal proteins (RPL36, RPL10A, and RPS3) were specifically enriched in the knock-in cells, but not in the HEK293T WT cells, underscoring the specificity of ribosomal protein enrichment in the EGFP-RPL19 cells (Fig. 2D). The specificity was further confirmed by silver staining experiments (Figure S2D). In summary, we have successfully established an EGFP-RPL19 knock-in cell line using CRISPR technology, addressing the challenges of non-specific enrichment and complex background commonly associated with the TRAP method. This cell line reliably enriches ribosomes and mRNA, maintaining consistent ribosomal component distribution and specific protein enrichment.
2.3 Feasibility of RPL19-TRAPKI-Seq in drug mechanism researchRNA-Seq is a powerful method for transcriptome profiling using deep-sequencing technologies. Our previous results demonstrated that the EGFP-RPL19 knock-in cell line functions as an optimized TRAP system for ribosome purification. We hypothesized that integrating this optimized TRAP method with RNA-Seq (RPL19-TRAPKI-Seq) would expedite mechanism elucidation. As shown in the flowchart, TRAP is employed to purify the translating mRNA, which is then sequenced to identify the mechanism (Fig. 3A). To investigate this hypothesis, we used rapamycin, a macrolide compound, known to inhibit translation and induce autophagy by targeting mTOR [35,36,37]. We treated EGFP-RPL19 knock-in cells with 100 nM rapamycin for 6 h. Then, we lysed the cells and extracted total mRNA from one portion of the supernatant, while enriching ribosome-bound mRNA using EGFP beads from another portion to obtain TRAP mRNA. RNA-Seq analysis generated volcano plots for both total mRNA and TRAP mRNA (Fig. 3B, C). At the total mRNA level, 437 genes were up-regulated and 988 were down-regulated. For TRAP mRNA, 94 genes were up-regulated and 134 were down-regulated, with 27 genes up-regulated and 38 down-regulated in both datasets (Fig. 3D).
Fig. 3
RPL19-TRAPKI-Seq for studying the mechanism of action of small molecules. A Flowchart of RPL19-TRAPKI-Seq to investigate the mechanism of action of active small molecule drugs. B, C Volcano plots of the up- and down-regulated genes in total RNA (B) and TRAP RNA (C) after rapamycin treatment. D Venn diagram illustrating the number of up- and down-regulated genes in total RNA and TRAP RNA after rapamycin treatment. E, F Differentially expressed genes of total RNA (E) and TRAP RNA (F) were enriched using KEGG pathways, and the number of genes was counted and represented in a bar graph. KEGG, Kyoto Encyclopedia of Genes and Genomes
KEGG enrichment analysis of differentially expressed genes revealed that rapamycin treatment affects multiple pathways, including ribosome biogenesis, RNA transport, Huntington's disease, Hippo signaling, and the spliceosome pathway (Fig. 3E). TRAP mRNA enrichment data showed differentially expressed genes clustered in four pathways: ribosome biogenesis, amino sugar and nucleotide sugar metabolism, biosynthesis of antibiotics, and spliceosomes pathways (Fig. 3F). Downregulation in 'ribosome biogenesis' and 'spliceosomes' clearly indicates rapamycin’s inhibitory effect on translation[38, 39]. The overlapping genes in 'biosynthesis of antibiotics' and 'amino sugar and nucleotide sugar metabolism' include enzymes related to glucose and energy metabolism, indicating inhibition of the energy metabolism pathway, a critical component of mTOR function. These findings confirm that mTOR is the endogenous target of rapamycin. Thus, we have established RPL19-TRAPKI-Seq as a novel, efficient, and cost-effective system that minimizes background interference in small molecule drug mechanism research, verified by rapamycin.
2.4 RPL19-TRAPKI-Seq reveals disruption of oxidative phosphorylation by the antitumor compound SBF-1OSW-1, a steroidal saponin from O. saundersiae [40], exhibits potent cytotoxicity, outperforming clinical anti-cancer drugs such as etoposide, doxorubicin and methotrexate [41, 42]. Its analog, SBF-1, shows similar or superior antitumor activity and is easier to synthesize [43]. We employed RPL19-TRAPKI-Seq to investigate SBF-1’s mechanism of action. In EGFP-RPL19 knock-in cells, the IC50 value of SBF-1 was 1.763 nM (Figure S3B). Treatment with 20 nM SBF-1 for 6 h (Figure S3C, S3D) revealed 339 up-regulated and 943 down-regulated genes in total mRNA. Regarding TRAP mRNA, 32 genes were up-regulated and 186 genes were down-regulated, with 20 genes up-regulated and 49 down-regulated in both datasets (Figure S3E). KEGG enrichment analysis of TRAP mRNA changes (Fig. 4A) identified eight pathways: Ribosome, Oxidative phosphorylation, Parkinson's disease, Huntington's disease, Alzheimer's disease, MAPK signaling pathway, NAFLD, and Amphetamine addiction (Fig. 4B). Differentially expressed genes in these pathways indicated that SBF-1 affects protein complexes I/III in oxidative phosphorylation, corroborated by consistent down-regulation of mitochondria-related genes in TRAP mRNA (Fig. 4C, D). Given that oxidative phosphorylation is a critical process for cellular energy production and that its disruption is known to induce cell death, particularly in cancer cells, we hypothesized that SBF-1 exerts its cytotoxic effects by targeting this pathway. Further analysis using MitoSox Red and MitoTracker Deep Red showed that increasing SBF-1 concentrations significantly reduced mitochondrial oxygen consumption and membrane potential (Fig. 4E, F). These results demonstrate that SBF-1 induces cell death by disrupting oxidative phosphorylation and inhibiting mitochondrial respiration.
Fig. 4
SBF-1 disrupts cellular oxidative phosphorylation. A, B Differentially expressed genes in total RNA (A) and TRAP RNA (B) after SBF-1 treatment were enriched using KEGG pathways, and the number of genes is represented in a bar graph. C, D Relative ratios of mitochondria-related differentially expressed genes in total RNA (C) and TRAP RNA (D) after SBF-1 treatment, based on RNA-sequencing data. E, F Representative histograms (left) and quantifications (right) of the mean fluorescence intensity (MFI) of MitoSOX Red (E) and MitoTracker™ Deep Red (F) at different concentrations of SBF-1, n = 3. Numbers in graphs indicate the mean fluorescence intensity (MFI). Statistical analysis was performed using one-way ANOVA among multiple groups. Bars with asterisks indicate significant differences from the control at *p ≤ 0.05, **p ≤ 0.01, ***p ≤ 0.001. Data are represented as mean ± SD
Comments (0)