Data Collection and Differentially Expressed Genes (DEGs) Identification
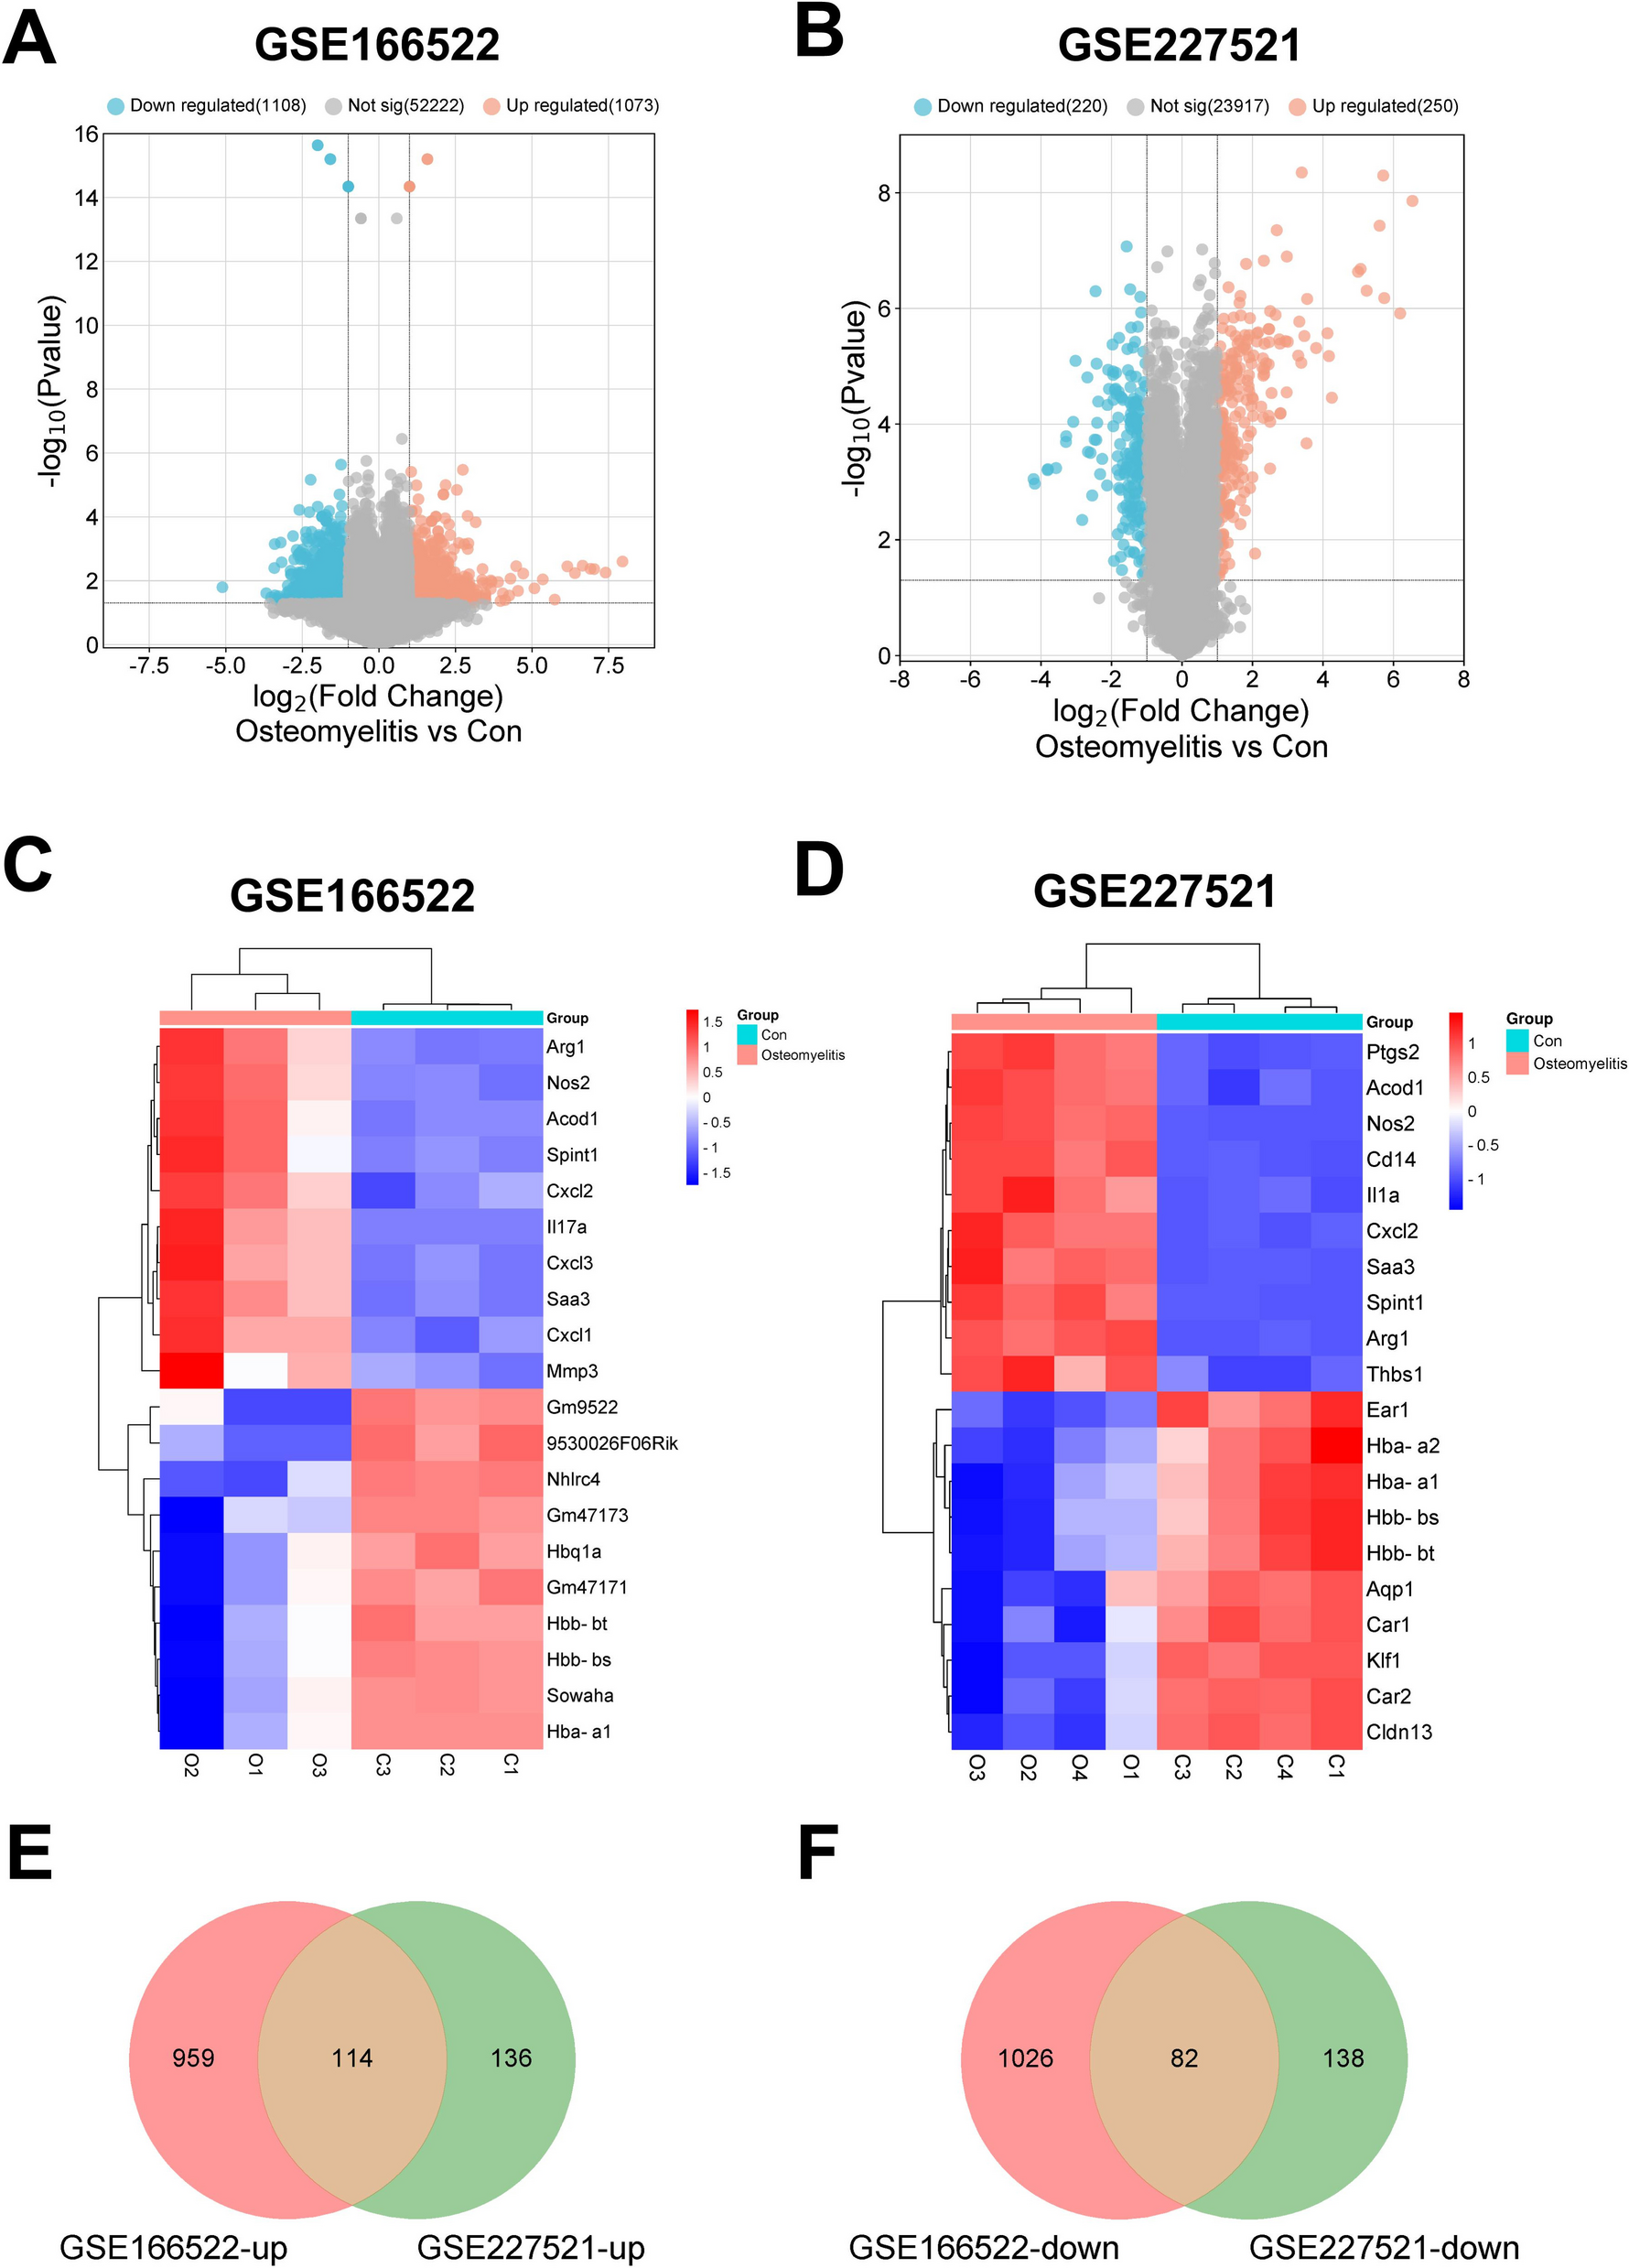
The gene expression profiles analyzed in this study were downloaded from the Gene Expression Omnibus (GEO database (https://www.ncbi.nih.gov/geo/). Osteomyelitis-related datasets were searched in the GEO database using the keywords “osteomyelitis” and “Staphylococcus aureus”, and two high-throughput sequencing datasets (GSE166522 and GSE227521) were identified. Three S. aureus osteomyelitis mice and three normal control mice from the GSE166522 dataset [GPL24247,Illumina NovaSeq 6000 (Mus musculus)] [18] and four S. aureus osteomyelitis mice and four normal control mice from the GSE227521 dataset [GPL21103,Illumina HiSeq 4000 (Mus musculus)] were enrolled in this study. DEGs between osteomyelitis samples and normal controls were identified by the GEO2R online tool (https://www.ncbi.nlm.nih.gov/geo/geo2r/) according to p < 0.05 and |logFC| ≥ 1. Volcano plots were generated with the ggplot2 package, and heatmaps of DEGs were produced using the pheatmap package in R software (version 4.2.3). Common DEGs among the datasets were identified using Venn software online (http://bioinformatics.psb.ugent.be/webtools/Venn/).
Functional Enrichment Analysis for DEGs
The Gene Ontology (GO) and Kyoto Encyclopedia of Genes and Genomes (KEGG) analyses were conducted in the DAVID database (https://david.ncifcrf.gov/). Biological attributes of common DEGs, including biological processes (BP), cellular components (CC), molecular functions (MF), and pathways were distinguished and enriched. Statistical significance was defined as a p < 0.05.
Protein-protein Interaction (PPI) Construction and Hub Genes Analysis
By inputting the DEGs list into the STRING software (https://string-db.org/) online, the PPI network for common DEGs was established (medium confidence 0.4). Visualization of the PPI network was carried out with Cytoscape software (version 3.7.2), and the modules of the PPI network were extracted using Molecular Complex Detection (MCODE). The MCODE parameters were set as follows: a degree cut-off of 2, a node score cut-off of 0.2, a k-core value of 2, and a maximum depth of 100. The top six highest-scoring genes in the most significant module were considered hub genes.
Bioinformatics Analysis for Hub Genes
Based on the GSE227521 dataset, hub genes were subjected to expression distribution and GO annotation analyses using ggridges and circlize packages in R software, respectively. A matrix plot between hub genes was plotted via the corrplot package. In addition, receiver operating characteristic (ROC) curves for hub genes were plotted using the GSE166522 and GSE227521 datasets with the pROC package. The area under the curve (AUC) was calculated to evaluate the diagnostic performance of hub genes, with an AUC > 0.7 considered to indicate good diagnostic ability.
S. Aureus -induced Mouse Model of Osteomyelitis
Specific pathogen-free (SPF) grade C57BL/6 male mice (weighing 20–24 g, 6–8 weeks old) were acquired from SPF Biotechnology Co., (Beijing, China). The mice were acclimated for one week in a controlled environment with a temperature of 23 ± 2°C, humidity of 55 ± 10%, and a 12-h light/dark cycle (lights on from 7:00 am to 7:00 pm). They were provided with normal food and water. This research was conducted in strict compliance with the NIH guidelines for the care and use of laboratory animals (eighth edition, NIH). Mice were randomly divided into the Sham, Osteomyelitis, and Osteomyelitis + etoricoxib (PTGS2 inhibitor) groups, with 6 mice in each group. The osteomyelitis mouse model was induced by S. aureus (ATCC 25923). The bacteria were grown overnight at 37°C in BBL Trypticase Soy Broth with continuous shaking and then incubated for 3 h at 37°C to promote exponential growth. To simulate osteomyelitis model in vivo, a total of 2 μL of the bacterial suspension (106 CFU), resuspended in PBS, was injected into the tibia. In the Sham group, the equivalent volume of PBS was injected into the tibia. Mice in the Osteomyelitis + etoricoxib group were injected intraperitoneally with etoricoxib (10 mg/kg) once every three days for a total of four injections following the construction of the osteomyelitis model. Etoricoxib and the carrier (a 40% ethanol-saline solution) were freshly prepared before each injection. Etoricoxib was dissolved in the carrier solution and then placed in a warm bath until fully dissolved. Four weeks after inducing osteomyelitis, the mice were euthanized by cervical dislocation, and serum and tibial tissues were collected for subsequent experiments.
Histological Evaluation
Tissue samples underwent fixation in 4% formaldehyde for 48 h and decalcification in 10% ethylenediaminetetraacetic acid (pH=7.2), followed by routine dehydration, paraffin embedding, and serial sectioning into 4-μm sections. Hematoxyline and eosin (HE) staining was conducted on the sections using Gills hematoxylin and 1% eosin (Muto Pure Chemicals, Tokyo, Japan). For tartrate-resistant acid phosphatase (TRAP) staining, the sections were immersed in TRAP solution and incubated at 37°C for 50 min. The osteoclasts were observed under the microscope until they turned burgundy-red, after which the nuclei were stained with hematoxylin. The mounted sections were photographed with a light microscope (Olympus, Tokyo, Japan) for histological evaluation.
Cell Culture
The osteoblastic cell line MC3T3-E1 was purchased from Icellbioscience Biotechnology Co., Ltd. (Shanghai, China). The cells were cultured in DMEM containing 10% fetal bovine serum (FBS) and 1% penicillin-streptomycin, and maintained at 37°C with 5% CO2.
Cell Treatment
MC3T3-E1 cells were categorized into eight groups, including control, lipopolysaccharide (LPS), LPS + si-NC, LPS + si-PTGS2, LPS + si-NC + IL-17A, LPS + si-PTGS2 + IL-17A, LPS + si-NC + secukinumab (Sec), and LPS + si-PTGS2 + Sec groups. Cells were treated with 100 ng/mL LPS for 24 h to induce osteomyelitis model in vitro. In the LPS + si-PTGS2 and LPS + si-NC groups, cells were transfected with siRNA against PTGS2 (si-PTGS2-1, si-PTGS2-2, and si-PTGS2-3; GenePharma, Shanghai, China) or a negative control scrambled siRNA (si-NC) with Lipofectamine™ 3000 (Thermo Fisher Scientific, Waltham, MA, USA) following the guidelines provided by the manufacturer. Briefly, MC3T3-E1 cells were seeded into six-well plates. Upon reaching 30–50% confluence, transfection with siRNA was performed. The efficiency of PTGS2 silencing was measured by reverse transcription-quantitative-PCR (RT-qPCR) or western blot 48 h after transfection.
Additionally, to assess the effect of the IL-17 pathway on osteomyelitis, LPS-induced MC3T3-E1 cells were exposed to IL-17A (50 nM; Peprotech Inc., Rocky Hill, NJ, USA) for 24 h. In the LPS + si-NC + Sec and LPS + si-PTGS2 + Sec groups, cells were treated with 20 μg/mL secukinumab for 24 h.
Cell Counting Kit-8 (CCK-8) Assay
Measurement of cell proliferation was performed by CCK-8 kit (Beyotime, Shanghai, China). Briefly, a cell suspension of 200 μg/ml (5 × 10³ cells/well) was inoculated into 96-well plates and cultured for 24 h at 37°C with 5% CO2. Then, 90 μL of fresh culture medium and 10 μL of CCK-8 reagent were added to each well. Following a 1-h incubation, the absorbance was measured at 450 nm by a microplate reader (Thermo Fisher Scientific).
Apoptosis Analysis
Flow cytometry analysis was executed to measure and quantify apoptosis with the Annexin V-FITC apoptosis detection kit (Beyotime). The resuspended cells (5× 10⁴) were centrifuged at 1,000 × g for 5 min. After removing the supernatant, 195 μL of Annexin V-FITC conjugate was introduced to gently resuspend the cells. Then, 5 μL of Annexin V-FITC and 10 μL of propidium iodide staining solution were added, and cells were incubated for 20 min in the dark. Flow cytometry analysis was performed using a FACSCalibur flow cytometer (BD, Franklin Lakes, NJ, USA), and the resulting data were assessed with FlowJo software (Tree Star, San Carlos, CA, USA).
Enzyme-linked Immunosorbent Assay (ELISA)
Levels of inflammatory factors [tumor necrosis factor alpha (TNF-α), interleukin-1beta (IL-1β), and interleukin-6 (IL-6)], oxidative stress factors [reactive oxygen species (ROS), malondialdehyde (MDA), and glutathione (GSH)], and iron in mouse serum and cell supernatants were detected by enzyme-linked immunosorbent assay (ELISA) kits (Esebio Biotechnology Co., Ltd., Shanghai, China) based on the manufacturer's guidelines. These factor levels were calculated based on the optical density at 450 nm, which was detected by a microplate reader (Thermo Fisher Scientific).
Western Blot Analysis
Extraction of proteins was carried out by RIPA reagent, followed by measurement with a BCA Protein Assay kit (Beyotime). The proteins were separated on a 10% SDS-PAGE gel and then transferred onto a PVDF membrane. The membrane underwent blocking through incubation with 5% skim milk for 2 h. Then, the membranes were incubated with a 2000-fold dilution of specific primary antibodies, including anti-GPX4 (ab273582; Abcam), anti-SLC7A11 (ab307601; Abcam), anti-PTGS2 (ab179800; Abcam), anti-IL-17A (ab318150; Abcam), anti-ACT1 (ab137395; Abcam), and anti-GAPDH (ab137395; Abcam) at 4˚C overnight. The membranes were incubated with the corresponding horseradish peroxidase-conjugated secondary antibodies for 1 h at 37°C. Then, the membrane was developed with ECL kit (Amersham, Little Chalfont, UK), and the protein bands were captured by a Tanon 5200 chemiluminescent imaging system (Tanon, Shanghai, China). The gray values of protein bands were measured using ImageJ software (NIH, Bethesda, MD, USA).
RT-qPCR
Total RNA was isolated using TRIzol Reagent (Thermo Fisher Scientific). RNA was reverse-transcribed into cDNA with a HiScript III 1st Strand cDNA Synthesis Kit (Vazyme, Nanjing, China). RT-qPCR was performed on a 7500 real-time PCR System (Thermo Fisher Scientific), using ChamQ Universal SYBR qPCR Master Mix (Vazyme). Gene expression was quantified using the 2-ΔΔCt method. Supplementary Table 1 contains the primer sequences.
Statistical Analysis
Statistical analyses were performed using GraphPad Prism 7.0 (GraphPad Software, San Diego, CA, USA). Data are presented as mean ± SD. To assess differences between two groups, a t-test was used, while one-way analysis of variance (ANOVA) was used for multiple group comparisons, followed by Tukey’s test. Statistical significance was set at p < 0.05.


Comments (0)