
Remember me


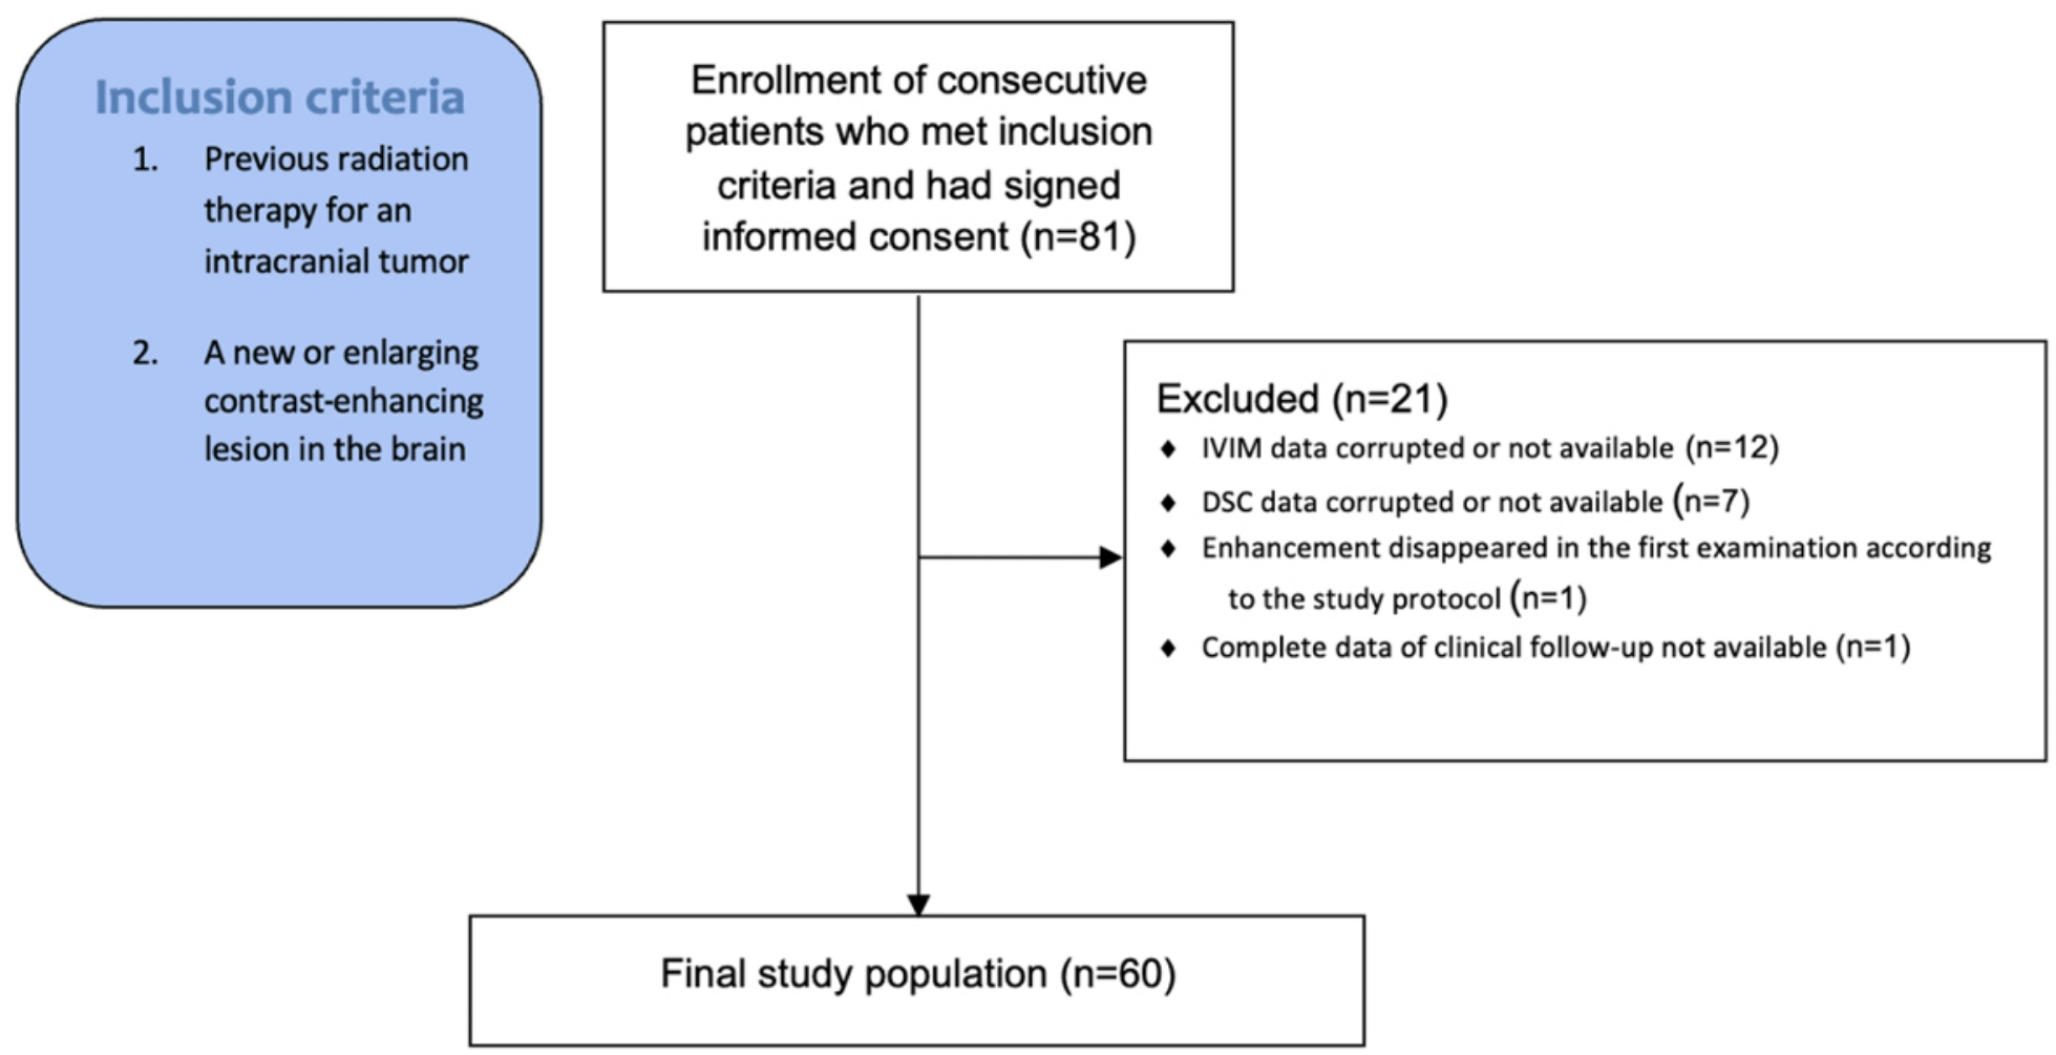
The Institutional Review Board of Seoul National University Hospital approved this retrospective study (IRB No. 2111-167-1276) and waived the requirement for written informed consent. We included consecutive patients who underwent TOF-MRA with baseline and accelerated scans from July 2022 to March 2023. These patients were included if they (a) were suspected of cerebrovascular diseases, including ischemic stroke, hemorrhage, aneurysm, and cerebrovascular steno-occlusion, (b) were older than 18 years of age. The exclusion criteria were as follows: (a) severe susceptibility artifacts due to intracranial surgical clip or embolic materials, and (b) insufficient scan range that failed to visualize cortical branches of intracranial vessels (Fig. 1).
Fig. 1
Flowchart shows the patient selection. Con = conventional, DL = deep learning
MR AcquisitionsMRI examinations were performed using either a 1.5-T scanner (Ingenia, Philips Healthcare, Best, Netherlands) or a 3-T scanner (Magnetom Skyra; Siemens AG Healthcare, Erlangen, Germany). All patients were imaged using two MRA sequences in the same session following a single protocol: baseline (TOF-Base) and accelerated scans (TOF-Accel). For the 3-T setting, protocols were categorized into routine- and high-resolution (HR) protocols. TOF-Accel reduced scan time by 40%, with acquisition times of 198 s (TOF-Base) and 122 s (TOF-Accel) for the routine protocol, and 624 s (TOF-Base) and 372 s (TOF-Accel) for HR protocol. At 1.5-T, only the routine protocol was applied, achieving the same 40% reduction, with acquisition times of 306 s (TOF-Base) and 186 s (TOF-Accel). Scan parameters are listed in Table S1 in the Supplementary Material. The maximum intensity projection (MIP) images of TOF-Base (TOF-Con) were automatically generated using the MR workstation’s 3D image processing software. A schematic diagram of MR acquisition is provided in Fig. 2.
Fig. 2
Schematic diagram of TOF-MRA acquisition with routine and deep-learning based image enhancement algorithm. Con = conventional, Accel = accelerated, DL = deep learning, CNR = contrast-to-noise ratio, CR = contrast ratio, VS = vessel sharpness, FWHM = full-width half maximum
Deep learning-based image enhancementThis study utilized a commercially available, vendor-agnostic MR image enhancement software (SwiftMR, v2.0.1.0. AIRS Medical, Seoul, Korea). The model incorporates a DNN utilizing a 2D U-Net-based architecture [16] which is aimed to reduce image noise and improve the spatial resolution of images in the Digital Imaging and Communications in Medicine (DICOM) format. The foundational structure consists of convolutional block with 64 output channels including four down-sampling and up-sampling stages. Then the model is followed by 18 cascading convolutional blocks with down-sampling, up-sampling and feature concatenation layers, which sums up to three convolutional layers.
The software performs MR image denoising and resolution enhancement in a multi-dimensional manner enabled by training inputs generated from considerations such as undersampling patterns (uniform, random, kmax, partial Fourier, elliptical, etc.) and noise amount in the image. The foundational U-Net architecture was modified to accommodate diverse image acquisition scenarios by enabling contextual data such as the acquisition parameters defining the k-space sampling as auxiliary input, resulting in a Context-Enhanced U-Net (CE U-Net) which incorporates a dynamic modulation pathway to utilize these contextual information from the input DICOM images.
Separate networks are used for 2D and 3D input images, where super-resolution is enabled in the direction of slice encoding for 3D images, on top of in-plane super-resolution. Detailed information regarding the software’s structure, training scheme, data used during the training and validation stages can be found in [17].
The algorithm was applied to the source image of TOF-Accel (TOF-Swift), then the corresponding MIP (TOF-DL) was created by transferring the post-processed source image back to the MR workstation and applying the identical MIP algorithm.
Quantitative image quality analysisA board-certified radiologist with 4 years of neuroimaging experience (Y.H.J.) quantitatively assessed the following imaging metrics: signal-to-noise ratio (SNR), apparent contrast-to-noise ratio (CNR), contrast ratio (CR), vessel sharpness (VS), and full-width at half maximum (FWHM) of the vessel diameter. SNR, CNR and CR were calculated from the source images using circular regions of interest (ROIs) at the mid-basilar artery (ROIvessel) and brainstem (ROItissue) on the same slice. SNR was defined as the mean signal intensity (SI) of ROIvessel divided by its standard deviation (SD). CNR was the mean SI of ROIvessel divided by the SD of of ROItissue. CR was calculated as the difference in mean SI between ROIvessel and ROItissue, normalized by their sum [18].
VS was assessed using a line profile perpendicular to the right middle cerebral artery (MCA), with FIJI’s “Line profile” function (ImageJ 1.46r Wayne Rasband, National Institute of Health, USA) [18, 19]; if the right MCA was not visible, the contralateral vessel was selected. Data from the line profile were normalized using the min-max normalization method, and VS was computed as the mean of the absolute slopes of the anterior and posterior vessel walls. The FWHM was determined from the same line profile curve, measured in pixels at half the maximum curve value [18] (Fig. S1 in the Supplementary Material).
Qualitative image quality analysisFour board-certified neuroradiologists (Y.H.J., K.H.L., J.Y.L., and K.S.C., with 4, 5, 11, and 6 years of experience, respectively), blinded to the clinical information and imaging technique, independently evaluated a couple of TOF-MRA MIP image sets in a randomized crossover manner, with at least four weeks of time interval between each review. The readers scored the qualitative image parameters using a 5-point Likert scale.
First, the readers scored the following parameters: overall image quality, impression of the VS, visibility of small- and medium-sized vessels, intraluminal inhomogeneity, and background noise. Background noise refers to venous or extracranial vascular signals and unsuppressed skull base fat. Second, the readers scored the visualization of the following vessel segments: internal carotid artery (ICA) horizontal and vertical petrous segments, ICA-C4 (cavernous segment), ICA-C5 (clinoid segment), ICA-C6 (ophthalmic segment), ICA-C7 (communicating segment), ophthalmic artery (OA), MCA (M1-3 segments), anterior cerebral artery (ACA, A1-3 segments), posterior communicating artery (PcomA), posterior cerebral artery (PCA, P1-3 segments), basilar artery (BA), superior cerebellar artery (SCA), vertebral artery (VA), and posterior inferior cerebellar artery (PICA) [18, 20]. Both right and left sides were graded together. The detailed scoring systems are shown in Table S2 in the Supplementary Material.
Diagnostic test and reference standardA consensus by two experienced neuroradiologists (K.S.C. and K.M.K., with 6 and 15 years of experience, respectively) served as the reference standard, based on TOF-MRA (including source images) with or without digital subtraction angiography and CT angiography. All available clinical information was utilized to enhance diagnostic accuracy.
Being blinded to imaging protocols and clinical information, after at least a four-week washout period, three readers (Reader 1: Y.H.J., Reader 2: K.H.L, and Reader 3: J.Y.L), independently evaluated the presence of intracranial aneurysms and steno-occlusion using two MIP sets (TOF-Con and TOF-DL).
Statistical analysisQuantitative image metrics were compared using paired t-tests or Wilcoxon signed-rank tests, with effect sizes quantified using Cohen’s d (small: 0.20–0.50; moderate: 0.51–0.80; large: > 0.80). A cumulative link mixed model was used to compare the qualitative image parameters [21], with the cluster effect from multiple scorings by the four reviewers on the same patient modeled as random effects. This model tested the impact of imaging protocol, scan time, and field strength, including a subgroup analysis at 1.5-T and 3-T. The inter-reader agreement was examined using Kendall’s coefficient of concordance (W). W coefficient values were interpreted as poor (κ ≤ 0), slight (0 < κ ≤ 0.20), fair (0.20 < κ ≤ 0.40), moderate (0.40 < κ ≤ 0.60), substantial (0.60 < κ ≤ 0.80), and almost perfect (0.80 < κ ≤ 1.00) [22]. The diagnostic performance of the readers was evaluated using receiver operating characteristic (ROC) curve analysis, and the areas under the curve (AUC) were compared using the DeLong test [23]. Sensitivity, specificity, and diagnostic accuracy were also calculated.
Statistical analyses were performed using R language version 4.2.2 (R Core Team, 2020). p values < 0.05 were considered statistically significant.
Comments (0)