
Remember me


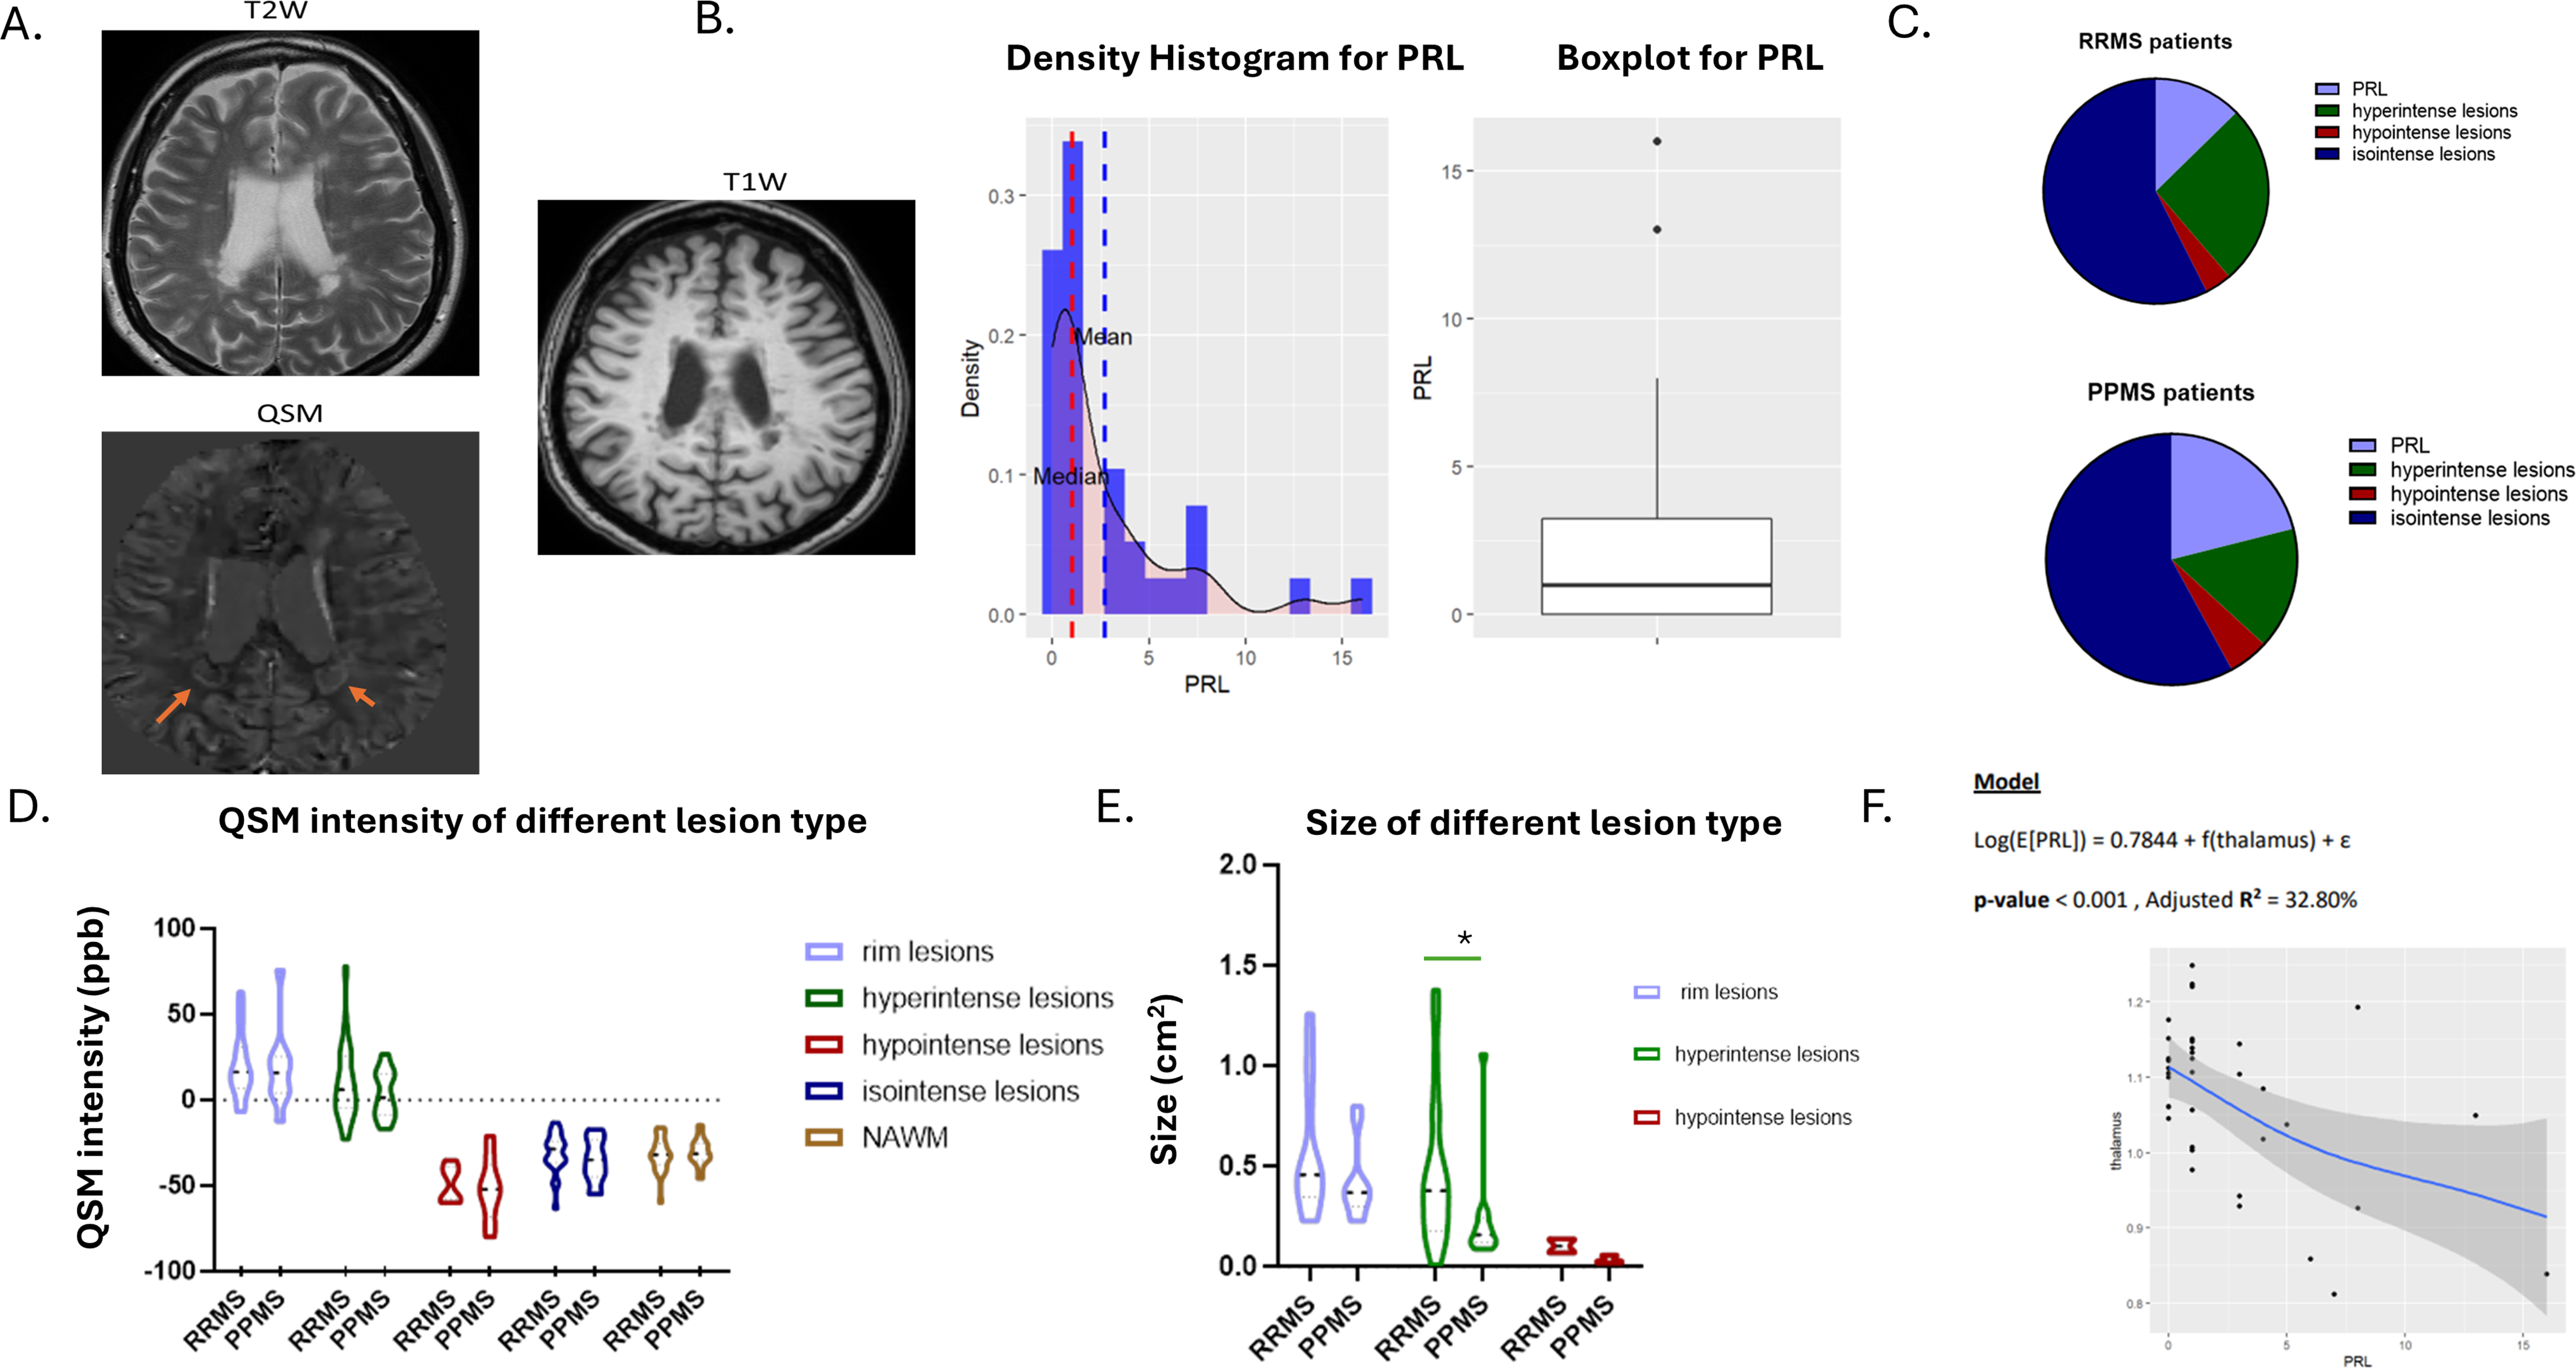
The mean number of brain FLAIR hyperintense white matter lesions per patient identified was 16, and none of the patients had evidence of Gd-enhancing lesions. The WMLs (white matter lesions) (n = 609) showed distinct characteristics within QSM maps and were classified as iso-intense lesions (n = 341, 55%), hypo‐intense lesions (n = 26, 4.2%), hyperintense lesions (n = 127, 21%), and rim + lesions (n = 115, 18%) (Fig. 1A-C). The number of QSM rim + lesions per patient ranged from zero to a maximum of 16 (mean = 3, SD;0.9). 10 out of 38 patients (26.3%) did not have any rim + lesions (Table-1).
Fig. 1
Quantitative susceptibility measures in QSM lesion types across MS disease subtypes and MRI correlations. (A) QSM lesion type. (B) Histogram of the number of PRL lesions in patients of the cohort, (C) Distribution of QSM lesion types (%) in RRMS and PPMS. (D) QSM intensity values among QSM lesion types in RRMS and PPMS. (E) QSM volume lesion among QSM lesion types in RRMS and PPMS. (F) Generalized Additive models (GAMs) of the thalamus and number of PRLs. *p < 0.05, PRL; Paramagnetic rim-lesions, QSM; quantitative susceptibility mapping, NAWM; normal-appearing white matter, PPMS; primary progressive MS, RRMS; relapsing remitting MS
Further, hypo-intense lesions in QSM images showed lower absolute magnetic susceptibility than iso‐intense lesions (p = 0.0002), iso‐intense lesions showed lower absolute magnetic susceptibility than hyperintense lesions (p < 0.0001), and hyperintense lesions showed lower absolute magnetic susceptibility than PRLs in the rim region (p = 0.02) (Fig. 1D and Supplementary Fig. 1).
Comparison of lesion size across QSM lesion typesPRL lesions were larger (as measured in QSM map) and showed the highest signal intensity in QSM than all other types of lesions. Hypo-intense lesions were smaller than hyperintense lesions (p = 0.0008), which in turn were smaller than PRLs (p = 0.007) (Fig. 1E and Supplementary Fig. 1).
Comparison of QSM lesion type frequency between RRMS and PPMSThere was no difference in the frequency of rim-lesions between patients with RRMS and those with PPMS (Table 1; Fig. 1C). In RRMS, an average of 2.4 rim + lesions (or PRL) were detected, whereas 4 rim + lesions were detected in PPMS (Table 1). The hyperintense lesion size (expressed as cm2) as well as the percentage of hyperintense lesions in RRMS were greater than in PPMS (p = 0.01 and 0.001, respectively) (Fig. 1E; Table 1). Moreover, a trend was observed toward fewer isointense (absolute number and percentage) lesions in RRMS than in PPMS (p = 0.04, p = 0.08, respectively) (Table-1). There was no difference in the QSM intensity of NAWM between RRMS and PPMS patients (Fig. 1D).
B. Leptomeningeal contrast enhancement and cortical lesionsLMCE was assessed in 3D-FLAIR post-gadolinium (3D-FLAIRGd) sequences (Fig. 2A-B). The presence of LMCE was detected in 37.5% of patients with RRMS and 53% of PPMS patients (Fig. 2C).
Fig. 2
Leptomeningeal enhancement and cortical thickness association in MS patients. (A) Leptomeningeal contrast-enhancement in an MS patient. From left to right, LMCE are visible on 3T postcontrast T2-FLAIR images, but not on pre-contrast T2-FLAIR (middle) or postcontrast T1-weighted images. (B) Histogram of the number of LMCE of patients in the cohort. (C) Number of LMCE in RRMS versus PPMS. (D) Presence of leukocortical and intracortical type of cortical lesion in 3T MRI 3D T1w and 3D FLAIR. (E) Cortical lesions (both leukocortical and intracortical/subpial) in patients with PPMS stratified based on the presence of LMCE. (F) Representative image from an MS patient derived for SPM12 CAT 12.8.2. Cortical thickness is presented in patients with and without foci. PRL; Paramagnetic rim-lesions; PPMS, primary progressive MS; RRMS, relapsing remitting MS; ppb, parts per billion, LMCE; leptomeningeal contrast-enhancement, LC; leukocortical lesions, IC; intracortical lesions, CCL; Cerebral cortical lesions, CAT; Computational Anatomy Toolbox
In the RRMS disease subgroup (n = 21), the number of LMCE had a statistically significant negative relationship with the presence of PRL [0.018 (r =- 0.51)]. Negative Binomial Regression analysis further strengthened that association as it showed that the estimation of PRL on LMCE = 0.53, CI: [0.25, 0.90], p-value = 0.048, meaning that the estimated effect of PRL on the number of LMCE is significant, with an incidence rate ratio (IRR) of 0.53 (Supplementary Material–General Additive Models). In the whole MS cohort, no correlation was found among LMCE and PRL.
We further evaluated in PPMS the type of cortical lesions (leukocortical and intracortical/subpial). The detection of intracortical/subpial (IC) and white-cortical (leukocortical) lesions (LC) was performed using the 3D-T1w sequence and FLAIR sequences (Fig. 2D). We found that patients with the presence of at least one LMCE showed only a trend, toward more total cortical lesions. The mean number of IC and LC in patients with at least one LMCE was 1.6 and 6.1, respectively, whereas in patients without LMCE was 0.57 and 2.4, respectively (Fig. 2D-E and Supplementary Fig. 2A).
C. MRI volumetry and association with lesion typesAssociation between QSM rim-lesions (PRL) and Gray matter damageThe mean global cortical thickness was lower in PPMS than in RRMS (p = 0.03). Regarding differences in deep gray matter fractions, PPMS showed slight thalamic (p = 0.04), pallidum (p = 0.004) and putamen (p = 0.03) atrophy and displayed higher disability scores than RRMS (p < 0.001) (Table-1).
We aimed to investigate the relationship of chronic active rim + lesions, identified as a high-intensity ring on QSM, with the clinical severity, disease type (RRMS and PPMS), and imaging markers of neurodegeneration.
In the entire mixed cohort of MS patients (n = 36), by applying robust linear regression, we found a positive correlation between PRL and disease duration in months (coef;0.017, p = 0.013) and various MRI features indicative of high lesion burden (e.g. volume of periventricular lesions; coef;2.97, p < 0.01 and Supplementary Tables 1–2). Moreover, we found a negative correlation of PRL with various MRI parameters indicative of neurodegeneration (e.g. volumes of thalamus; coef;-14.88, p < 0.01, Fig. 1F and Supplementary Tables 1–2). We further generated General Additive Models (GAMs), showing that volumetric analysis of the thalamus and pallidum exhibited the most significant effects on PRL (Supplementary Material–General Additive Models).
In the PPMS group (n = 15), the number of PRLs was significantly correlated with the volume of periventricular lesions (coef;3.09, p-value < 0.001), volume of the thalamus (coef;-19.01, p-value < 0.001), and volume of the pallidum (coef;-114.5, p-value < 0.001). There was a strong relationship between RRL and the number of juxtacortical lesions (coef;0.13, p = 0.006) (Supplementary Tables 3–4). In the RRMS group, the PRLs were correlated with the number of juxtacortical lesions (coef;0,13, p-value < 0.0001) and disease duration (coef;0.016, p-value < 0.001) (Supplementary Tables 5–6).
In the entire MS cohort, patients with more than 3 PRL had less regional cortical thickness in 3 areas (right superior temporal gyrus, left temporal lobe and post/paracentral area left) (age and the total intracranial cavity were used as covariates for normalization) (Fig. 3).
Fig. 3
Regional cortical thickness assessment by surface-based morphometry (SBM) analysis. A-C. Areas of significant cortical thickness differences in MS patients with > 3 PRL lesions vs. 3 PRL, threshold at p < 0.001 with family-wise error (FWE) correction for multiple comparisons at the vertex level, and with minimum extent cluster size correction (K = 21) at the cluster level. Cranial and lateral views are depicted. A. two areas with statistically significant difference in cortical thickness located in the (i) superior temporal gyrus and (ii) the temporal pole (p-FWE-corrected). B. The same regions are depicted as larger cluster areas (p-uncorrected). C. Another two regions with statistically significant difference are located in the post- and paracentral right gyrus (Right). D. Locations of significance, according to their MNI coordinates, based on Automated Anatomical Labeling and Yale BioImage Suite brain atlases. MNI, Montreal Neurological Institute. FEW, family-wise error; PRL, paramagnetic rim; R, right; L, left
Collectively, our findings demonstrate that chronic-active lesions, as identified in the QSM sequence by the presence of a hyperintense rim and hypo/isointense core, are associated with the extent of white matter lesions (especially juxtacortical lesion burden), regional cortical thickness, and subcortical gray matter atrophy, particularly in PPMS.
The other types of QSM lesions were less associated with gray matter volumes or cortical thickness. The only significant correlations were found among the total number of hyperintense lesions and the volume of thalamus (r=-0.432, p = 0.007), more evident in PPMS (r=-0.649, p = 0.014) and among the number of isointense lesions and the total cortical thickness (r=-0.451, p = 0.0045) (Supplementary Fig. 3).
Association between leptomeningeal LMCE and Gray matter damageWe further investigated the relationship between leptomeningeal enhancement and clinical severity, disease type (RRMS and PPMS), and imaging markers of neurodegeneration.
In the PPMS group (n = 15), the number of LMCE had a statistically significant relationship with “cortical thickness” [0.038 (r =-0.54)] and “age at disease diagnosis” [0.046 (r = 0.52)] and marginally with EDSS (Expanded Disability Status Scale) [p = 0.088 (r = 0.88)]. Patients with more than one LMCE had a lower total cortical thickness (Fig. 2F, Supplementary Tables 7 and Supplementary Material–General Additive Models).
Moreover, there was no strong correlation between cortical thickness and total number of cortical lesions (CCL = LC + IC) (r=-0.42, CI: -0.77, p = 0.12) (Supplementary Fig. 2B and data not shown).
EDSS correlates and correlation matrix for various clinical and MRI parametersIn the whole group of MS patients, the EDSS showed correlations with gray matter total volume, the volume of pallidum, the percentage of hyperintense lesions and the volume of hyperintense lesions (all p < 0,05). In the RRMS groups, EDSS correlated with the percentage of isointense lesions (p = 0.023) and the volume of deep white matter lesions (p = 0.039). In the PPMS group, no significant correlations were found (Supplementary Table 8).
Serum levels of the cytokines CXCL13 and IL-21 did not exhibit any significant correlation with disease parameters or MRI biomarkers in the entire study cohort. PRL lesions in PPMS were associated with cytokine CXCL13 levels (r = 0.73, p = 0.05). Other important associations were observed between QSM intensity in NAWM and the volume of the thalamus and pallidum (for both r=-0.47) (Supplementary Fig. 4).
D. Predictors of cortical thickness in Ms patientsRandom Forest is an ensemble machine learning method known for its robustness and accuracy, that involves building multiple decision trees and combining their outputs. The diagram in Fig. 4 presents the variable importance as determined by the random Forest model for predicting cortical thickness. This indicates that the increasing age, total lesion volume (especially juxtacortical lesions), QSM parameters (like: QSM intensity of NAWM), type of disease (PPMS vs. RRMS) and the presence of LMCE are the most significant predictors. The Percent Increase in Mean Squared Error (%IncMSE) presents the importance of a feature: the larger the increase, the more important the feature is to the model’s predictive accuracy.
Fig. 4
Random Forest informative predictors of cortical thickness in MS patients. Distribution of variable importance of demographic, clinical, and MRI features to explain cortical thickness. EDSS = Expanded Disability Status Scale; MS = multiple sclerosis; QSM = quantitative susceptibility mapping; NAWM, normal appearing white matter
E. Longitudinal evaluation of lesions and assessment of the role of B cell depleting therapiesOcrelizumab was administered for a mean time of 13.98 months (SD:12.22) in eleven patients (5 PPMS and 6 RRMS), and they underwent two MRI scans during follow-up to assess specific radiological features. Comparing values before and after treatment, we found that patients did not manifest significant clinical deterioration (mean EDSS before anti-CD20; 2.4, after anti-CD20; 2.7) and the total number of lesions remained stable after 1.112 years of follow-up (SD: 0.94). Also, patients after treatment showed an increased percentage of PRL lesions (p-value = 0.015). Interestingly, the QSM intensity in the rim of lesions increased (p-value = 0.0078) (Table 2; Fig. 5). No difference was found regarding the number of LMCE (Table 2).
Table 2 Clinical and MRI characteristics before and after Anti-CD20 treatmentFig. 5
Effect of anti-CD20 treatment in QSM lesion types. Paired analysis of QSM lesion type before and after anti-CD20 therapy. Representative MRI features of a rim-lesion in a RRMS patient during the one year follow up. QSM = quantitative susceptibility mapping, ppb = parts per billion
Figure 6 summarizes in an illustrative manner all the findings of the Random Forest and provides a summary of the results.
Fig. 6
Cortical thinning in Multiple Sclerosis is of multifactorial origin. Apart from age and disease duration that are main drivers of neurodegeneration, other MS related parameters contribute to cortical damage and possibly to neuronal injury. Novel MRI markers applied in this study captured evidence of cortical tissue damage both in RRMS and PPMS. In PPMS, cortical thickness was found to associate with leptomeningeal inflammation (LCME or foci) and specific pathology originating from the white matter (either normal-appearing or not) especially the higher presence of juxtacortical lesions, and the QSM intensity of isointense lesions and NAWM. The presence of at least 3 rim-lesions is associated, not to overall cortical thinning, but to regional cortical thickness in specific areas like temporal lobe and was found in both RRMS and PPMS patients. NAWM; normal appearing white matter, RRMS; relapsing remitting MS, PPMS; primary progressive MS, QSM; quantitative susceptibility mapping, LCME; leptomeningeal contrast enhancement, PRL; paramagnetic rim-lesions. This image was generated by BioRender.
Comments (0)