We estimated perfusion values via IVIM parameters and rCBV to differentiate tumor recurrence from treatment-induced changes using measurements in the hotspots if detected, and in the entire contrast enhancements in the rest of cases. Hotspots were found in about one-half of the cases in both f and rCBV maps. We found higher interobserver and intraobserver agreements for rCBV than for f. Using both techniques, a significantly higher perfusion was observed in tumor recurrences than in treatment-induced changes, although with a substantial overlap. A similar differential diagnostic value was achieved for the mean values of f and rCBV, but accuracy was increased from 73 to 78% when the 90th percentile value of rCBV was used instead. D and D* were not useful IVIM parameters in this differential diagnosis.
We found a moderate correlation between the mean values of f and rCBV. The Pearson’s r correlation coefficient was 0.45 in the whole material and 0.50 after exclusion of an outlier. Two earlier studies that included both high- and low-grade gliomas also showed moderate correlations, Pearson’s r 0.53 and 0.59 [15, 16]. In a study of healthy subjects, a moderate correlation was found in gray matter (r = 0.48), but in white matter, Pearson’s r was as low as 0.02 [17]. Correlations in these previous studies as well as in our study are not particularly high, perhaps because f and rCBV reflect different parts of the vasculature. f depends on the microvascular network and rCBV is also influenced by larger vessels.
There is widespread use of rCBV to differentiate between tumor recurrence and radiation injury. In a meta-analysis of studies using rCBV for that differential diagnosis, the pooled sensitivity and specificity were 0.88 (95% CI 0.82–0.92) and 0.85 (95% CI 0.68–0.93), respectively [18]. The corresponding values were 0.73 and 0.75 in our study. The cutoff values in the meta-analysis ranged from 0.71 to 3.69, with a mean of 1.62. We found the optimal cutoff value for mean rCBV to be 2.26. A recent review on the differential diagnosis between tumor recurrence and radiation effects noted that the data regarding appropriate cutoff values for rCBV are inconsistent [19]. Differences in equipment and in imaging and analyzing methodology as well as types of pathological processes may influence the results.
In the current study, the sensitivity and specificity were exactly the same for mean f and rCBV. In an earlier study on differentiation between tumor progression and radiation necrosis that only used f for perfusion evaluation, the sensitivity and specificity were higher (1.00 and 0.80, respectively) than in our study, but only 10 cases were included and all neoplasms were metastases [11].
Some research groups have reported good results in the differential diagnosis between recurrent tumor and treatment effects when the 90th percentile value for f or rCBV is used [10,11,12]. However, these groups did not compare their results directly to mean f or mean rCBV, and histopathological confirmation was not obtained in all studies. In two of the studies, all treated tumors were metastases, whereas in our study, the majority of tumors were gliomas. In our study, the 90th percentile value of f did not differ between the recurrent tumors and the treatment-induced changes. The AUC for the 90th percentile value of f was 0.54 vs. 0.72 for mean f. For rCBV, the corresponding AUCs were 0.79 and 0.77. One factor affecting the results may be that we only measured in the area with the highest perfusion, if such an area existed, whereas the whole enhancing area was included in previous studies.
We found no significant difference in D* or D between recurrent tumors and treatment-induced changes. In contrast, some previous studies have showed that diffusion-weighted imaging can be useful in this setting and, in a meta-analysis on this topic, a pooled sensitivity of 71% and specificity of 87% for differentiating glioma recurrence from treatment-induced changes were reported using apparent diffusion coefficients [20].
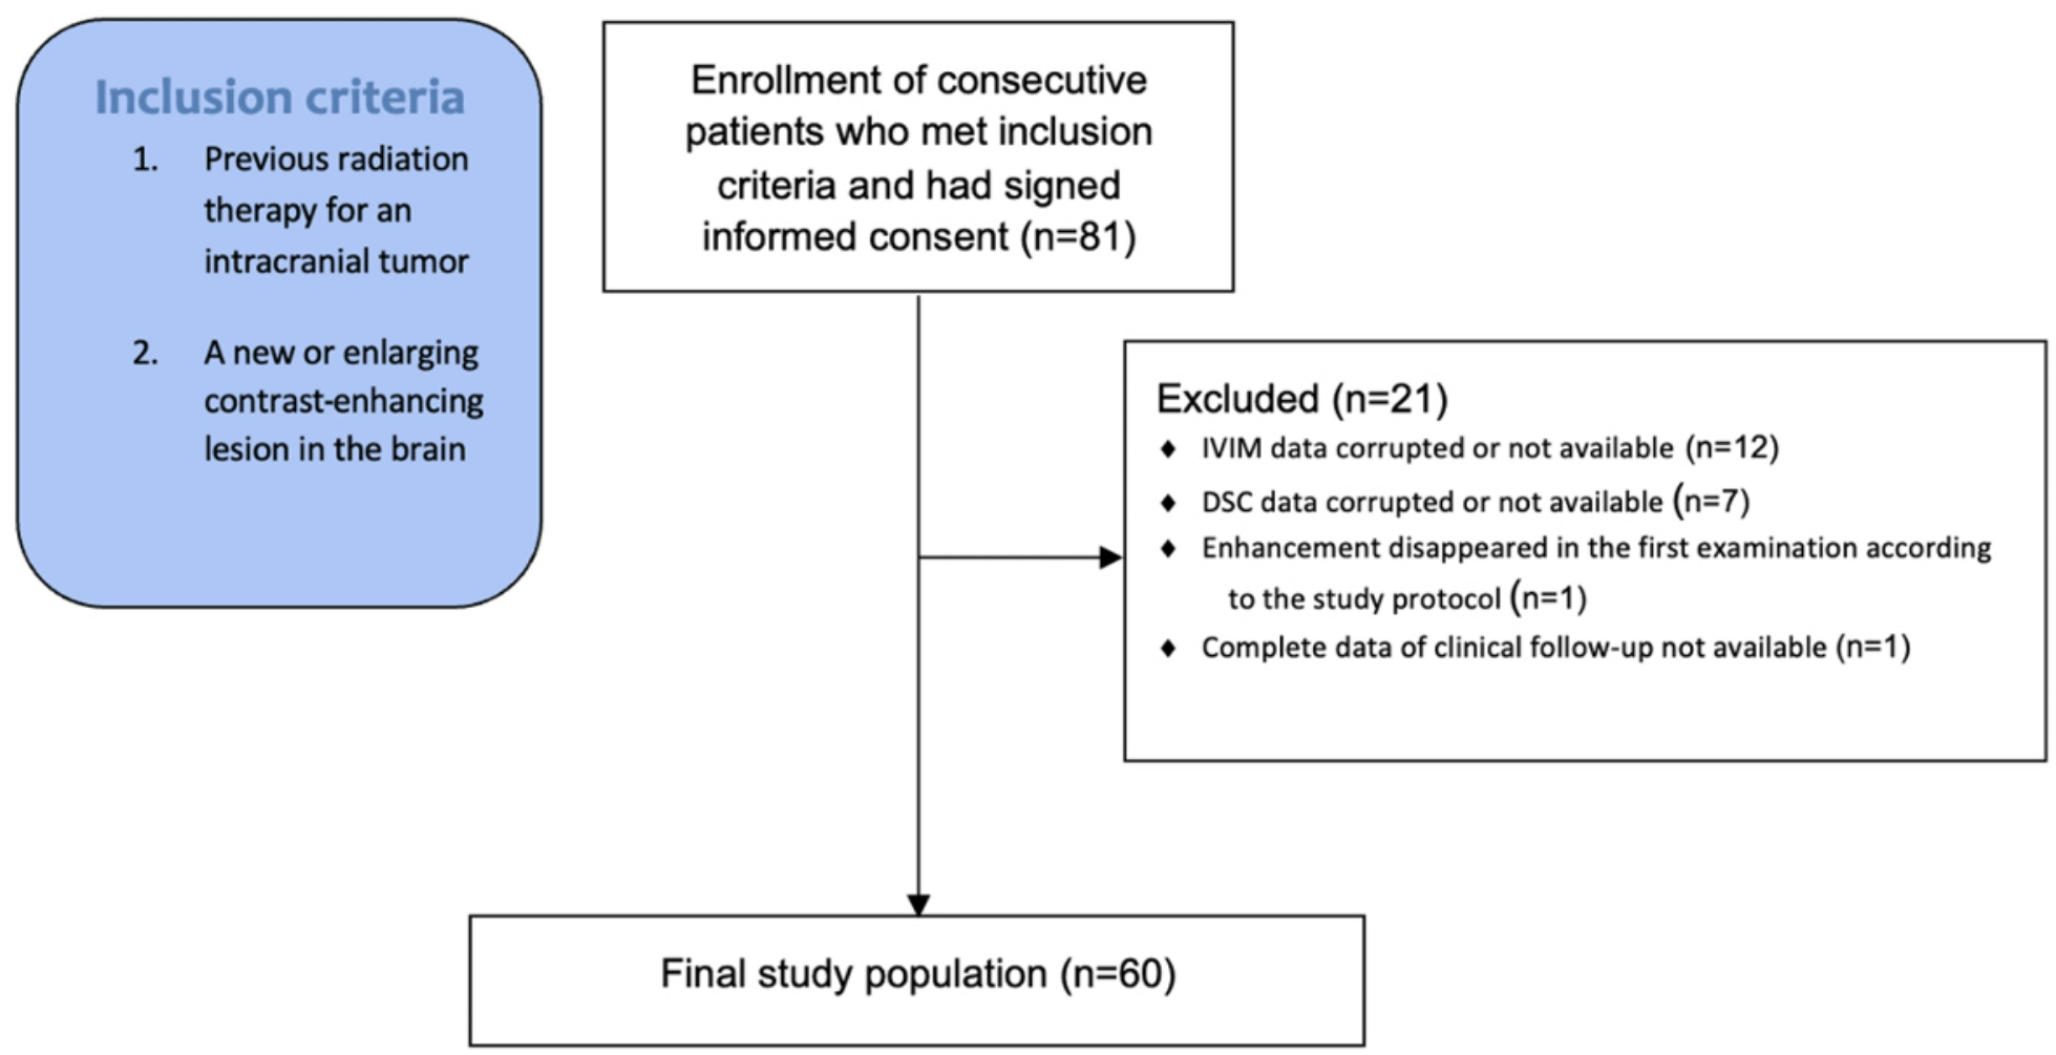
One inherent difficulty when studying tumor recurrence is that most high-grade tumors will recur. Thus, the question is whether only treatment effects were present in our patients who later developed tumor recurrence. Another difficulty is that many lesions consist of a mixture of treatment-induced changes and tumor cells. This can also cause difficulties for the pathologist in making a diagnosis [21]. Only about one-third of our diagnoses were based on tumor specimens, which is a limitation of the study. Our intention was to collect a material reflecting the clinical reality. Therefore, we included all patients who had a new or enlarging contrast-enhancing lesion in an earlier irradiated region. The mix of tumors surely influence the results but the variety of tumors is the situation which we meet at everyday clinical work. All patients have previously been treated with radiation therapy and about half of them had received treatment with temozolomide. Temozolomide can make the treatment-induced changes occur more frequently [2], but to our knowledge the perfusion values should not differ depending on the genesis of the treatment-related changes. Our use of hotspots was an attempt to minimize the heterogeneity of the lesions. In a study of breast lesions, measurements were made in both hotspots and whole lesions, with the use of IVIM hotspots improving results in some diagnostic groups [22]. We did not undertake measurements in the whole enhancing area in all study subjects and could therefore not make the same comparison in our study. One limitation for the interpretation of the results in our study was that there was only fair to moderate agreement regarding whether a hotspot was present or not for the perfusion factor f, but the results were the same as those for the rCBV hotspots. When assessing the correlation between f and rCBV, the highest values of f and rCBV do not need to be from the exact same spatial location since the two methods are based on partly different physiological phenomena. Thus, the correct location of the recurrence may have been found by only one of the methods. In this study, lesions could be of any size, and the result in small hotspots could be greatly affected by noise. The hotspot found by the observers could come from different places in the lesion. The IVIM and DSC sequences had somewhat different spatial resolutions, with in-plane resolutions of 1.2 × 1.2 mm and 1.8 × 1.8 mm, respectively. From this follows slightly larger partial volume effects for the DSC sequence. Theoretically, this could cause a lower possibility to detect a very small hotspot, using the DSC technique. However, in our material, the hotspots measured at least 7 pixels, why we do not believe this difference has affected our comparison. The measurement result could also be affected by non-physiological values, which is the reason why we omitted f values > 0.3, as others have also done [15, 16, 23]. In this work, we used a commercially available software for calculation of the IVIM parameters. It should be acknowledged that there are other algorithms available [6], and that results may differ depending on used method [24]. Future standardization of both sequence parameters and methods for extraction of IVIM parameters would improve reproducibility and enable more accurate comparisons between different sites. Differences in T2, mostly because related to water content, between different compartments may affect IVIM estimates. To account for this, measurements at different echo times may be collected, as described in [25]. One source of error in the estimation of perfusion using the IVIM technique is that differences in water content influences values for f, since this is a proportion of the MR visible proton pool. Thus, it cannot be excluded that differences in water content between tumor recurrence and radiation reaction has affected our results. There are also other possible sources of error to take into account. To get the correct IVIM parameters the effects of noise needs to be properly handled. At high b-values the signal-to-noise ratio becomes low and the signal attenuation appears curved. This can result in underestimation of the IVIM parameter f, which can even become “negative”. The possible effect of water exchange on the estimation of IVIM parameters remains also still to be investigated [6].
A further limitation of IVIM is that a bi-exponential signal attenuation model may not be the best fit for the data in heterogeneous tissue, especially at very high b values, where non-Gaussian models better explain signal attenuation [6]. The contralateral ROI was placed in a symmetrical position. Most often that implicated a placement in normal-appearing white matter because the tumors most often originated from white matter. An alternative approach would have been to place the contralateral ROI at a predetermined normal-appearing white matter area but the location of the ROI may affect the measured signal intensity.


Comments (0)