Patients
Twenty one patients underwent detailed multi-parametric multimodal dynamic FPIA-PET- mpMRI and provided twenty two scans (12 brain radiotherapy treatment-naïve, 10 post SRS +/- combination therapy; patient 015 was represented in both cohorts). Patients were identified through a general neuro-oncology multi-disciplinary meeting, based on brain radiological features using standard of care MRI, in the context of a known primary malignancy. All patients had previous histopathological confirmation of primary disease (Table 1). Inclusion criteria were patients > 18 years old, World Health Organisation performance status 0–2, and lesions at least 1 cm on MRI. All female patients of childbearing age were required to have a negative pregnancy test on the day of imaging. In the post SRS+/- combination cohort, FPIA-PET- mpMRI was scheduled to be completed within 4–8 weeks of treatment commencement. Exclusion criteria comprised any chronic illness of musculoskeletal condition that would prevent the patient from completing the study, concurrent therapy with any other investigational medicinal product within 14 days of the scan date and any contraindication to MRI. Several patients were on dexamethasone or anti-seizure medication as clinically indicated. Progression-free survival time was defined from time of brain metastasis diagnosis until brain lesion progression confirmed at a multi-disciplinary team meeting. Overall survival time was defined from time of brain metastasis diagnosis until death or last follow-up.
Radiopharmaceutical preparation
FPIA radiosynthesis was initially carried out using a GE Fastlab™ automated radiosynthesis platform to produce GMP grade radiopharmaceutical. The automated radiosynthesis of FPIA has been previously described by us [15, 19]. The precursor, methyl 2,2-dimethyl-3-[(4-methylbenzenesulfonyl)oxy]propanoate, was radiolabelled by displacement of the tosylate group with [18]F-fluoride to produce the methyl ester of FPIA. This compound was then hydrolysed under basic conditions to give FPIA, which was purified by semi-preparative HPLC using biocompatible solvents (15% EtOH, 85% sodium dihydrogen phosphate buffer, pH 4.5). The fraction containing FPIA was diluted in water and passed through a sterile filter into a sterile vial for clinical use. The chemical and radiochemical purities of the final product were determined by HPLC. A range of quality control tests were performed according to European Pharmacopoeia [19]. The radiosynthesis of FPIA was later adopted to a Trasis AIO™ platform with solid-phase extraction (SPE) purification. Quality control of the formulated product was preformed according to European Pharmacopoeia.
Image acquisition
All subjects underwent dynamic FPIA-PET-mpMRI on a Signa™ 3.0T scanner (GE Healthcare Systems, USA) in a single bed position using a 3.0T GEM HNU coil. Before FPIA was injected, 3-plane MRI localisation was performed, and the PET field of view was defined (centred on the superior margin of the thalamus to include the entire brain). FPIA was injected as an intravenous bolus injection (range 281.9–375.0 MBq; mean 346.4 MBq) and PET data were acquired in list-mode format (0–66 min) and reconstructed using VUE point FX (VPFX; 3D OSEM plus time of flight reconstruction) at 192 × 192 matrix size, 2 iterations and 28 subsets with a 5 mm Gaussian filter (no Z filter) into the following frame x duration: 10 × 15s, 3 × 60s, 5 × 120s, 9 × 300s and 1 × 360s (66.5 min) as in Islam et al. [15]. Simultaneous MRI brain acquisition (commencing after 10 min following FPIA injection) included MR-based attenuation correction (MRAC) - Zero Echo Time pulse sequence (ZTE) - together with structural and functional MRI sequences including Pre- and Post-contrast T1 volume, Fluid-attenuated inversion recovery (FLAIR) volume and Diffusion weighted imaging (DWI). Three perfusion sequences were acquired: pulsed arterial spin labelling (pASL), dynamic contrast enhanced-MRI (DCE-MRI), and dynamic susceptibility-MRI (DSC-MRI). As a result of performing both DCE-MRI and DSC-MRI, two boluses of Gadovist were required (1.0mmol/mL Gadovist solution at 0.1mmol/kg subject body weight, injected at 3mL/sec followed by immediate 20 mL saline flush at 3mL/sec). A single venous blood sample of 5 mL for venous carnitine was obtained in patients prior to any contrast injection or imaging. A population input normalized to blood in the sagittal sinus was used for input function derivation for the quantification of dynamic PET data previously described by Islam et al. [15].
PET and MRI image analysis
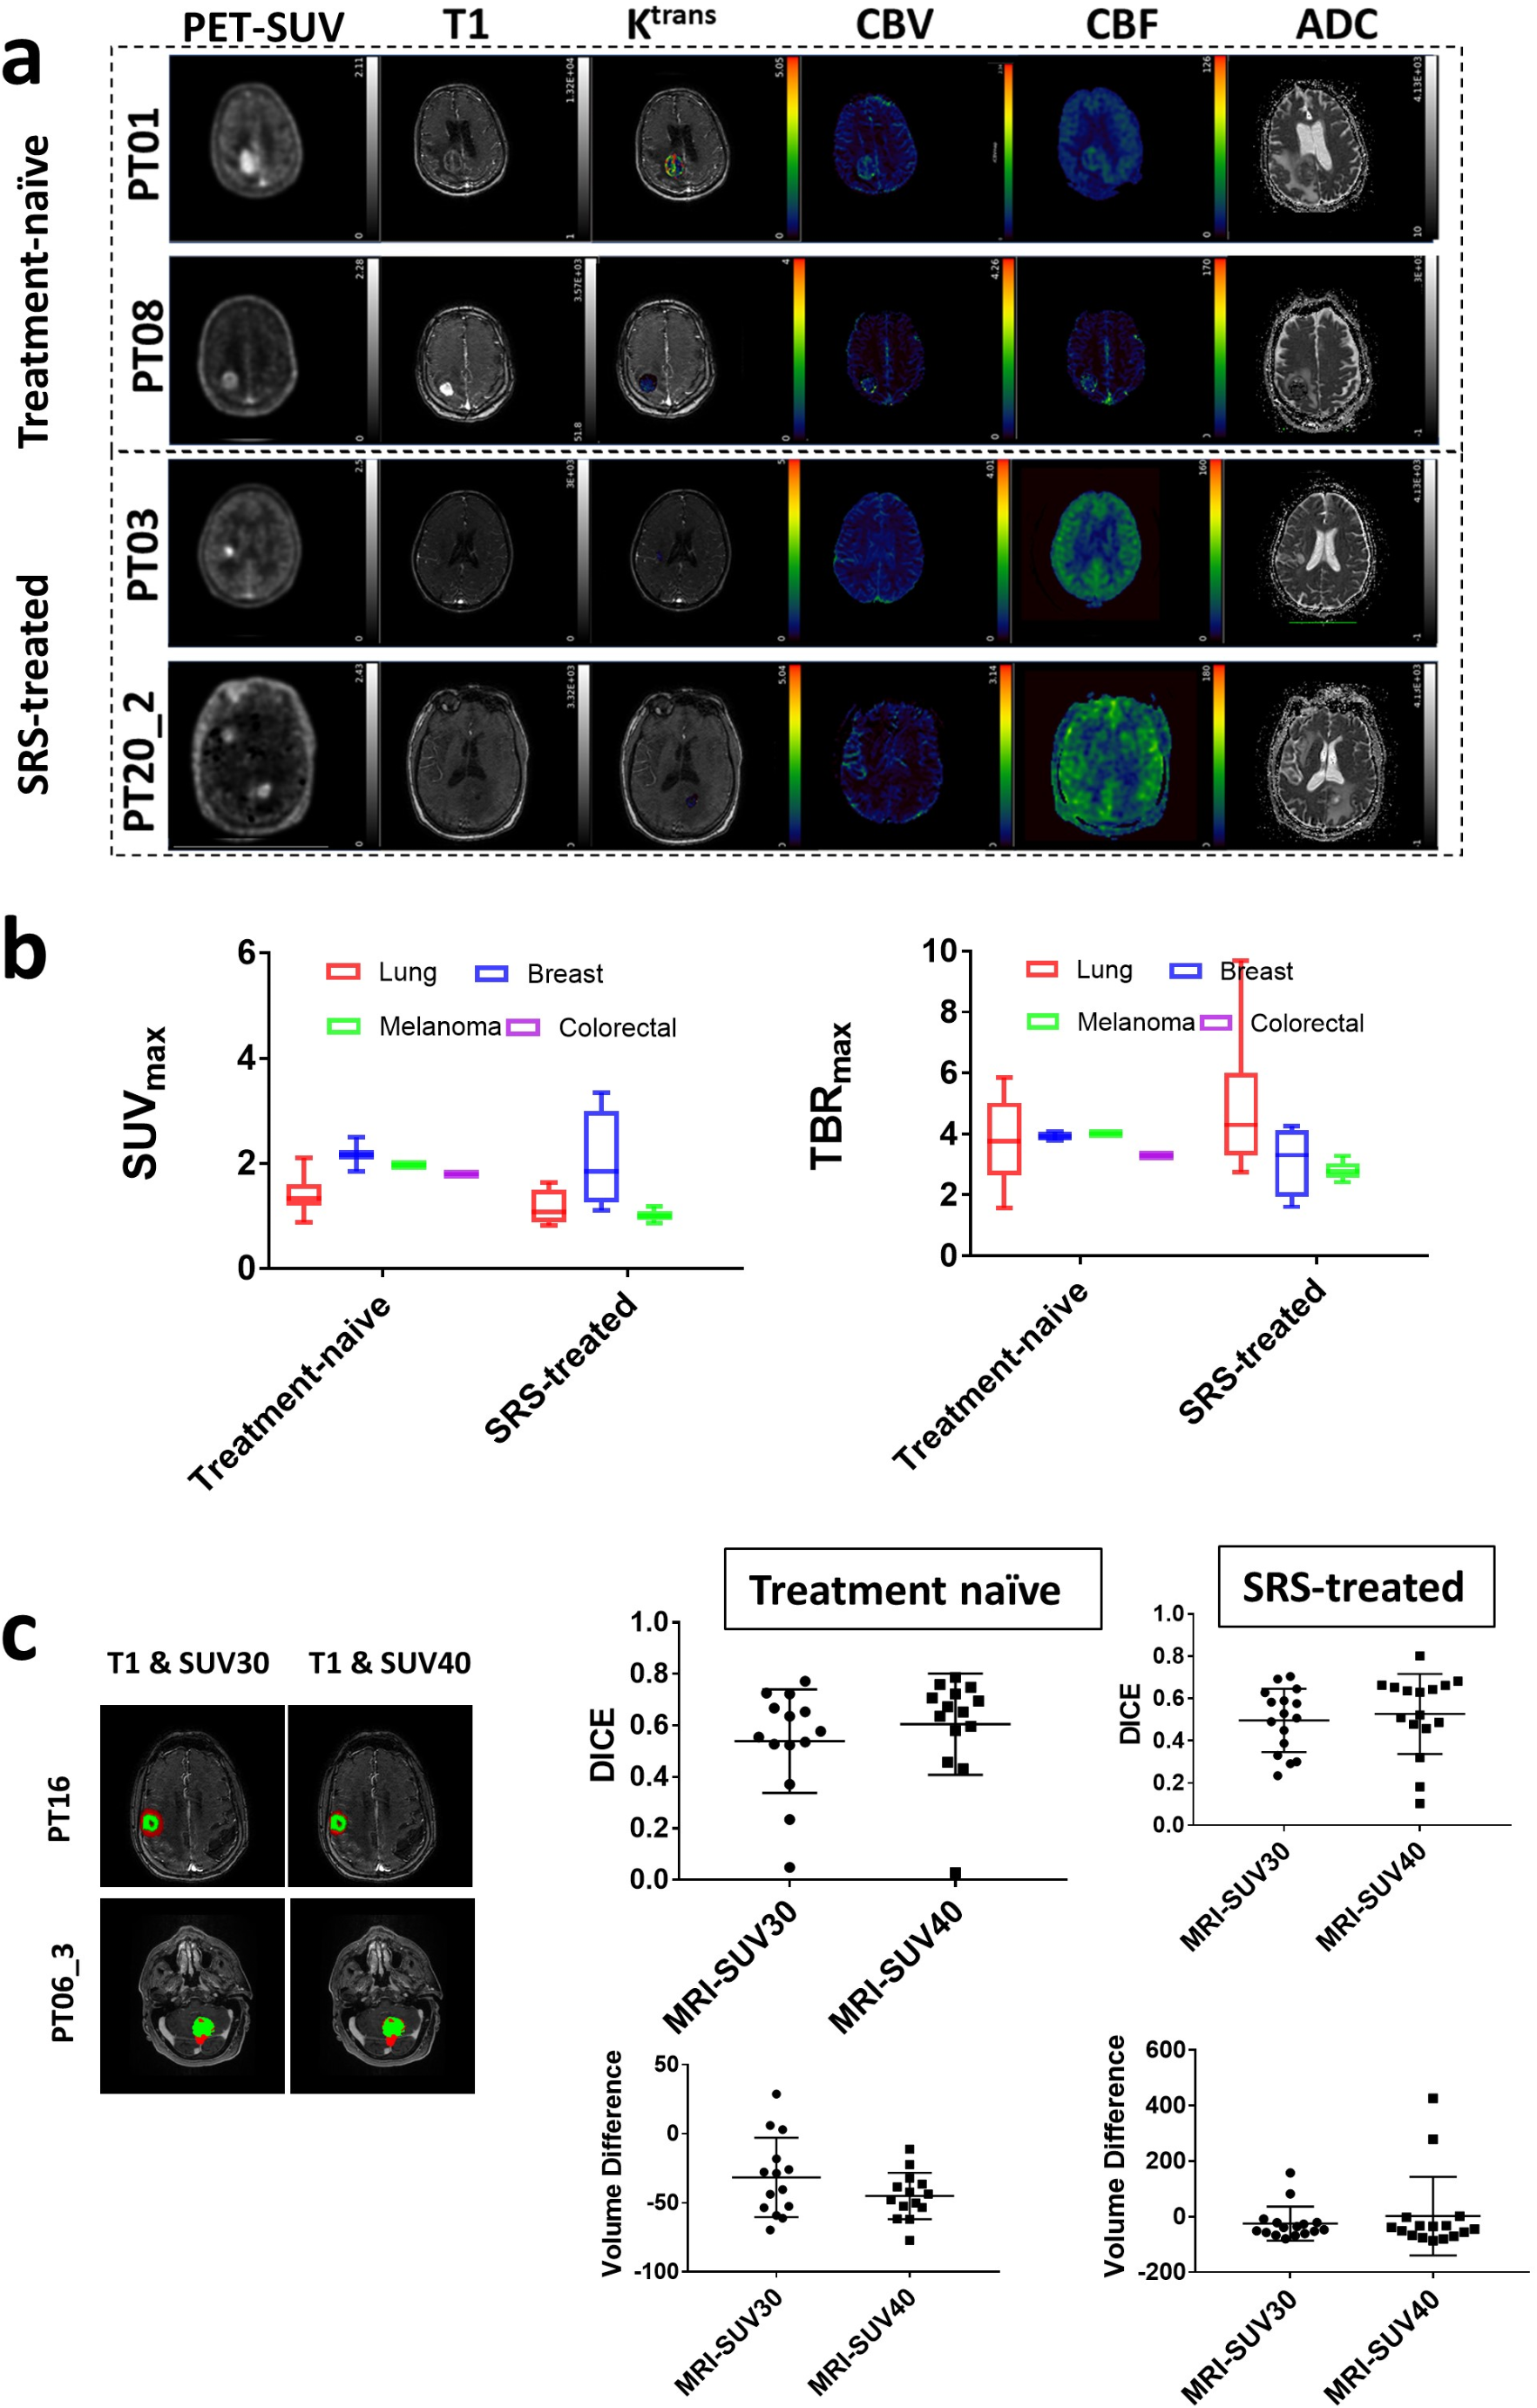
Regions of interest for quantification were identified and manually segmented by a neuroradiologist with more than 10 years of experience (SI). For each subject, two sets of volumes of interest (VOIs) were created using the volumetric FLAIR and T1 post-contrast MRI sequences. All MRI sequences, including T2 and pre-contrast T1, were reviewed to ensure an accurate assessment of lesions. VOIs on the volumetric FLAIR sequences encompassed all solid tumour parts and the surrounding abnormal FLAIR signal areas, while areas of necrosis were excluded from the final MRI VOI. In the T1 post-contrast volumetric sequences, both enhancing and non-enhancing solid tumour components were segmented, again omitting any necrotic fluid components. For each lesion VOI, a contralateral VOI of the same volume in radiologically healthy brain was segmented. The superior sagittal sinus was also segmented for each participant to allow whole blood correction. All segmentations were conducted using the freely available software ITK-SNAP (http://www.itksnap.org/pmwiki/pmwiki.php). The last frame of the PET image was utilized for static visualisation of uptake. Image overlap was determined using additional SUV masks—SUV30 and SUV40. An adaptation of the contour-based segmentation method by Besson and colleagues [35] was implemented in ITK-SNAP by identifying the SUVmax and applying thresholds of SUV30 or SUV40 up to SUVmax, as described in Islam et al. [15]. Overlap was evaluated using Dice Similarity Coefficient (DICE) scores.
Carnitine levels
Blood samples were taken at baseline prior to scanning for measuring non-esterifed fatty acids (NEFA) and carnitine. All samples were centrifuged (1942 g, room temp, 5 min) within 30 min of collection and stored at -80 °C until transfer to laboratories for analysis. Analysis was performed as previously reported Islam et al. [15].
PET and MRI data quantification
The quantification of FPIA-PET- mpMRI data involved evaluation of semi-quantitative and quantitative parameters reported in detail in Islam et al. [15]. In particular, from static PET data, SUV variables including SUV and TBR (maximum and average values) were extracted. Dynamic PET data were fitted to the standard and modified Patlak model for the quantification of Ki, the rate constant describing irreversible tracer trapping in the tissue; to a 2-tissue compartmental model for the quantification of the rate constants K1, k2 and k3 [1/min] and vb, and the blood volume fraction in the tissue voxel [unitless] [15]. The analysis of MRI data enabled the quantification of dynamic contrast enhanced MRI (DCE)-contrast agent perfusion/permeability parameters (Ktrans, the first order rate constant for plasma to interstitium MRI contrast agent transport [1/min], ve and vp, the measure of the extravascular-extracellular/plasma volume fraction [unitless], respectively, kep (given by the ratio between Ktrans and ve; resulting in the third pharmacokinetic parameter), the back-flux rate constant [1/min], and τi, the mean intracellular water molecule lifetime [min]), dynamic susceptibility contrast (DSC-) MRI perfusion parameters (cerebral blood volume corrected for leakage (CBV; CBVlc) [mL/100mL/min] and cerebral blood flow (DSC-CBF) ) [mL/100mL/min], together with contrast agent mean transit time (MTT) and time to peak (TTP)) [s]. Furthermore, non-contrast based arterial spin labelling MRI-cerebral blood flow (ASL-CBF) [mL/100mL/min] and diffusion-weighted imaging MRI-apparent diffusion coefficient (DWI-ADC) [mm2/s] were quantified [15].
Metabolomics
A non-targeted global metabolite profiling analysis was conducted on 44 fresh-frozen tissue samples including, 8 lower-grade glioma, 25 higher-grade glioma and 11 metastases (from x4 lung, x3 breast, x3 melanoma and x1 colorectal). Sample preparation and analysis was performed by contract as described previously [36] at Metabolon, Inc. In brief, sample preparation involved protein precipitation and removal with methanol, shaking and centrifugation. The resulting extracts were profiled on an accurate mass global metabolomics platform consisting of multiple arms differing by chromatography methods and mass spectrometry ionization modes to achieve broad coverage of compounds differing by physiochemical properties such as mass, charge, chromatographic separation, and ionization behavior. The details of this platform have been described previously [37]. Metabolites were identified by automated comparison of the ion features in the experimental samples to a reference library of chemical standard entries that included retention time, molecular weight (m/z), preferred adducts, and in-source fragments as well as associated MS spectra, and were curated by visual inspection for quality control using software developed at Metabolon [38].
Gene expression
For transcriptome analysis, RNA was extracted from 40 Formalin-Fixed Paraffin-Embedded (FFPE) tissue scrolls (5 scrolls per patient block, combined). RNA was extracted from FFPE sections using the internal extraction protocol of Beijing Genomics Institute (BGI). In summary, the FFPE sections were dissolved in dimethylbenzene and washed with ethanol. Cells were lysed using a digestion buffer containing protease. The mixture containing total RNA was extracted using a filter cartridge and underwent five rounds of centrifugation. The RNA was then eluted in water and its quantity was measured using Agilent 2100 Bioanalyzer. For library construction, DNA and rRNA were removed from the total RNA using DNase I digest and RNase H, respectively. The RNA was then fragmented into pieces ranging from 130 to 160 nucleotides. First-strand and second-strand cDNAs were generated separately and purified using magnetic beads. The purified fragmented cDNA was then subjected to end-repair and adapter ligation. The cDNA fragments were amplified by PCR and purified using Ampure XP Beads. The quality of the cDNA library was confirmed using Agilent 2100 Bioanalyzer and it was sequenced using BGI DNBSEQ platform, resulting in pair-end 100 and 40 million reads per sample.
Immunohistochemistry
The same 40 FFPE samples were assessed by immunohistochemistry [IHC]. Ki-67 was stained as previously reported [15]. IHC evaluation for SLC25A20, MCT1, OCTN2, AceCSI, ACSS2 and ACSS3 proteins was performed on paraffin-embedded sections. Formalin-fixed, paraffin-embedded [FFPE] tissue blocks were cut into 3-µm-thick serial tissue sections, using a Leica RM2235 microtome [Leica Biosystems Ltd., Newcastle], mounted onto coated glass slide. Immunodetection of OCTN2, AceCSI, ACSS2 and ACSS3 proteins was carried out using a protocol described previously [15].
SLC25A20 and MCT1 immunostaining was carried out using the automated Bond Leica RX [Leica Biosystems Newcastle, Ltd.]. Tissue sections underwent dewaxing [Leica Bond Dewax Solution, cat#AR9222] and rehydration, followed by a board heat-induced antigen retrieval with citrate-based pH 6.0 for 20 min [Leica Bond RX ER1, cat# AR9961] for SLC25A20 and EDTA-based pH 9.0 solution for 20 min [Leica Bond RX ER2, cat#AR9640] for MCT1. Endogenous peroxidase activity was blocked using 3.0% hydrogen peroxide for 5 min [contained in Bond Polymer Refine detection kit, Leica, cat#DS9800]. The primary antibodies against SLC25A20 [rabbit polyclonal to SLC25A20, Proteintech] and MCT1 [rabbit monoclonal (EPR26702-83) to MCT1, Abcam] were diluted 1:1500 and 1:10.000, respectively. Slides were incubated at room temperature with primary antibodies for 60 min followed by Goat Anti-rabbit Poly-HRP-IgG [polymer reagent, Leica, cat#DS9800] for 15 min. Prior application of the polymer reagent, the sections stained for SLC25A20 were incubated with 10% Goat Serum [post primary reagent, Leica, cat#DS9800] for 15 min at room temperature.
The reactions were developed using the Leica Bond polymer refine detection kit [Leica, cat#DS9800], followed by colour development with 3,3′-diaminobenzidine tetrahydrochloride [DAB, Leica, cat#DS9800] as a chromogen for 10 min and Bond DAB Enhancer [Leica, cat#AR9432] for 10 min. Tissue sections were counterstained with Mayer’s haematoxylin [Leica, cat#DS9800] for 2 min. Slides were washed with Bond RX wash buffer in between steps [Bond Wash Solution, cat#AR9590]. Finally, slides were dehydrated in absolute alcohol, cleared in three changes of Xylene on the automated Leica ST5020, and then mounted on the Sakura Tissue-Tek Film ® Automated Coverslipper.
Images were taken on a NanoZoomer 2.0-HT [Hamamatsu, Shizuoka, Japan] scanner using NDP.scan 3.2.17 software [Hamamatsu], displayed at 40×magnification and the NDP.view 2 software was used for image viewing. Scoring was based on intensity and coverage as previously reported [39], and ranged between 0 and 300.
Statistical analysis
Statistical analysis of image data was performed using Matlab (Mathworks, v. R2024a) and GraphPad Prism version 7. Summary data are reported as mean ± SD. Nonparametric Wilcoxon test was used to assess any statistically significant differences. P-value ≤ 0.05 was considered significant. A penalized least squares classification analysis method that performs both variable selection and regularization, least absolute shrinkage and selection operator, LASSO [40]) was used to select combination of MRI and PET variables likely to discriminate between treatment-naïve and treated patients. In particular, MRI parameters were combined with static PET-derived parameters only, and then with static and dynamic PET-derived parameters as in reference [15] for the estimation of a GpVs and GpVd, respectively.
The metabolomics dataset comprises 886 compounds of known identity and 67 compounds of unknown structural identity. Following normalisation to mass of tissue extracted and log transformation, Welch’s two-sample t-test was used to identify biochemicals that differed significantly between experimental groups. The number of biochemicals that achieved statistical significance in each pair-wise comparison (p ≤ 0.05), are highlighted. An estimate of the false discovery rate (q-value) was calculated to account for the multiple comparisons that normally occur in metabolomic-based studies. Principal Component Analysis (PCA) was used to gain a high level overview of data variance.
For gene expression, quality checks were firstly performed using FastQC. Raw sequencing reads were aligned to GRCh38 genome using STAR 2.7.3, with the following parameters: --outSAMtype BAM SortedByCoordinate; --outSAMunmapped Within; --outSAMattributes Standard; --quantMode GeneCounts. Raw counts generated were used for the downstream analysis. Differential gene expression analysis was performed using ‘DESeq2’ package [41]. Genes with raw counts above 10 and present in over 11 samples were included in the analysis, whereas the other low expressing genes were filtered. Volcano plot was generated using ‘EnhancedVolcano’ package. A ranked gene list using adjusted p-value was used as input for thepre-ranked gene set enrichment analysis (GSEA), with Kyoto Encyclopedia of Genes and Genomes (KEGG) database. Metabolism related genes were plotted using ‘ggplot2’ package.


Comments (0)