
Remember me


Expanding on established light aversion models induced by chemicals, such as nitroglycerin or CGRP injections, which typically require 5–11 days for induction [18, 30]; we have developed a novel photophobia model induced by i.n. administration of UMB (150 µg/kg), under bright light in C57BL/6J mice (Fig. 1). This preparation allowed the induction of a rapid-onset and injury-free light aversion behavior of mice after direct application of UMB or its vehicle to the upper intranasal region, thereby favoring subsequent behavior observation.
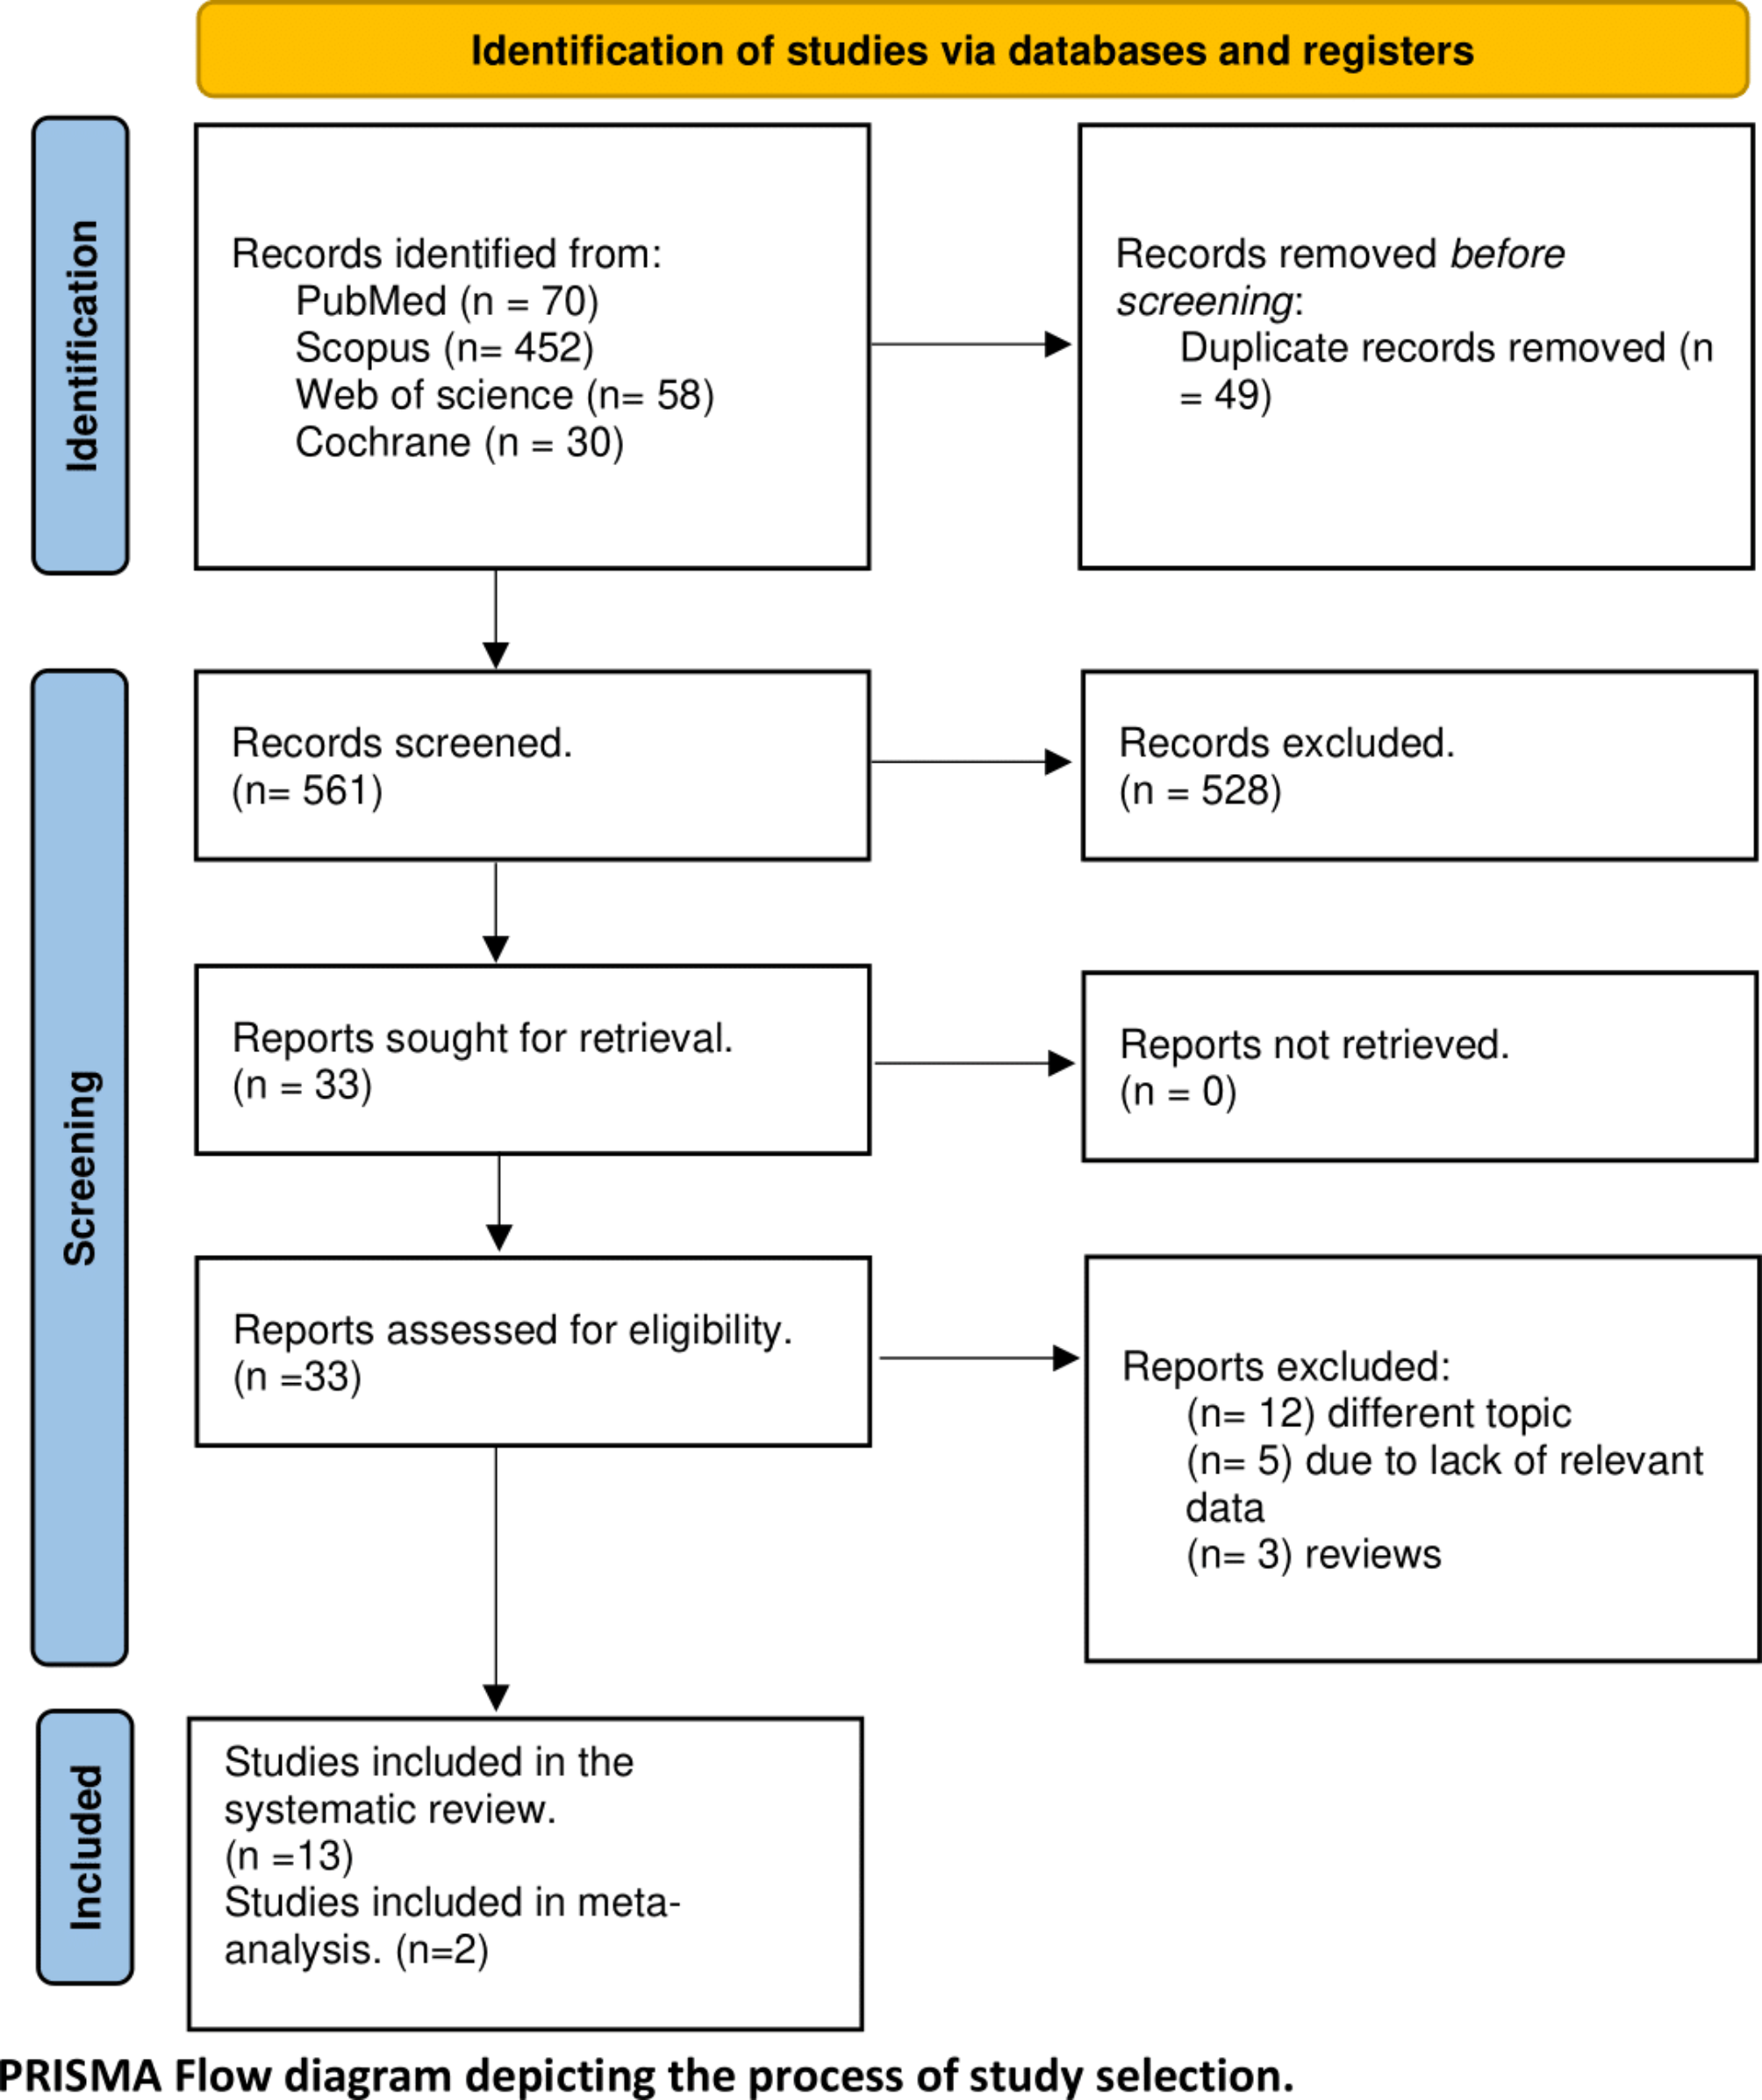
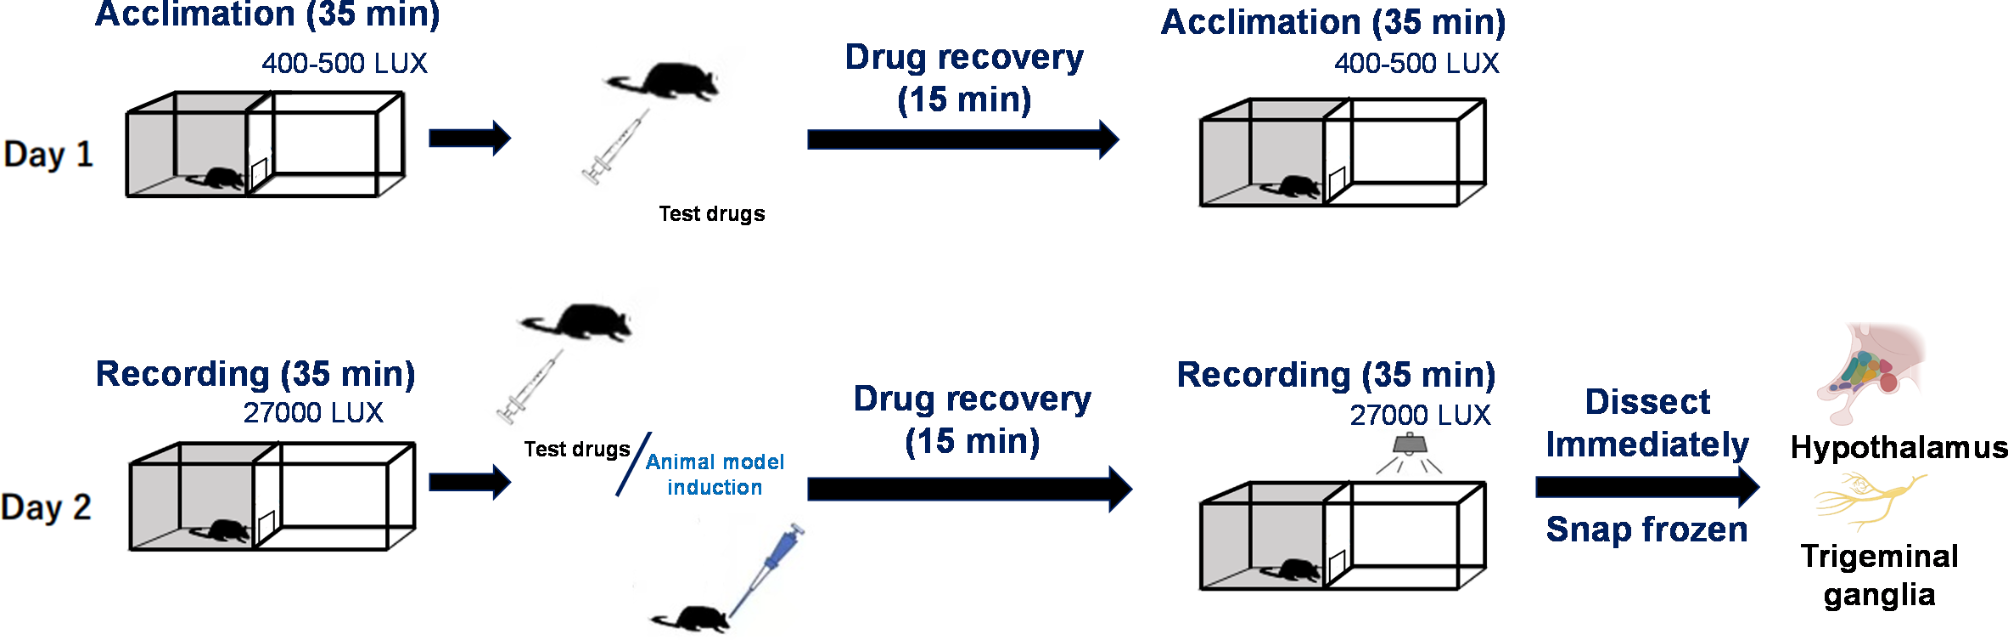
Fig. 1
Experimental flowchart showing light aversion behavior induction paradigm. On day 1, each mouse was acclimated in the testing chamber with the light (400–500 lx) on for 35 min twice and i.p. administration of the test drugs was conducted in between the acclimation. On day 2, each mouse was acclimated with the same timeline as on day 1: Mouse behavior was recorded in the testing chamber for 35 min under light intensity of 27,000 lx [17] as the self-control. The mouse was then i.p. administered with the test drugs, immediately followed by i.n. administration of either 1 µmol/kg UMB or its vehicle 0.2% dimethyl sulfoxide (DMSO). Subsequently, mouse light aversion behavior was recorded for another 35 min. After light aversion recording, mice were immediately sacrificed by rapid cervical dislocation, dissected for the hypothalamus and TG. Due to the small amounts of tissue, the left and right hypothalamus and TG of each mouse were merged respectively, rapidly homogenated within 15 s in liquid nitrogen, aliquoted and stored in -80 degree for subsequent analysis
Behavior of each mouse was recorded before and after light aversion induction as indicated by the total time in light (Fig. 1). In male mice that were administered with the vehicle (0.2% DMSO, i.n.), the total time in light was unaltered before (416.3 ± 74.08 sec) and after (536.8 ± 102.0 sec) administration of the vehicle (0.2% DMSO i.n.) (P = 0.2849, n = 10, Fig. 2A and B), suggesting mice’ memory effects in the bright light does not influence the second behavior recording. Differently, UMB (150 µg/kg, i.p.) led to a significant reduction of the total time in light (248.2 ± 53.85 s) compared to its self-control (455.1 ± 52.34 s, P = 0.0010, n = 11, Fig. 2A and B). This data was consistent with the observation that the relative total time in light was significantly lower in the UMB group (0.50) compared to that in the control group (0.98) (P = 0.0185, Fig. 2C) when the confounding factor due to mice’s memory effects in the bright light was eliminated by normalizing the data to the self-control.
Female mice in the vehicle group were more sensitive than male to the intranasal injection of the vehicle with a marked reduction of the total time in light (326.4 ± 68.25 sec) compared to the self-control (554.5 ± 93.12 sec, P = 0.0070, n = 12, Fig. 2A and B). The reason to account for this reduction is unknown, but it may not link to mice’ memory effects in the bright light as this observation was not observed in male mice. The total time in light (149.0 ± 24.82 s) was also significantly reduced by UMB when compared to its self-control (512.9 ± 49.80 s, P = 0.0002, n = 13, Fig. 2A and B). We further compared relative values (normalized to self-control) to eliminate confounding factor due to mice’s memory effects in the bright light. We observed that female mice showed a significant reduction (P = 0.0155, Fig. 2C) of total time spent in light when compared to the vehicle control (0.33 ± 0.064, UMB group vs 0.63 ± 0.080 in vehicle control). These data suggest the photophobia model’s validity in females, analogous to the effects observed in males, although the observed effect in female mice was not as pronounced as in males.
Fig. 2
SFKs antagonism by SRCT displayed gender different effects on the total time in light in C57BL/6J photophobia mice induced by intranasal injection of UMB. Light aversion was induced by intranasal injection (i.n.) of UMB (150 µg/kg). 0.2% DMSO was injected as the control. There was total three experimental groups in each sex: (1) Control (0.25% DMSO, vehicle, i.p.), photophobia (0.25% DMSO, vehicle, i.p.) and photophobia with the SFKs inhibitor, SRCT (20 mg/kg, i.p.) groups. SRCT or its vehicle was intraperitoneally injected for 2 consecutive days prior to photophobia induction. Light aversion behavior of each mouse was recorded before and after light aversion induction for self-comparison in both male (M) and female (F) mice. (A, B) Total time in light (sec) before and after light aversion induction. (C) Total time in light recorded after light aversion induction relative to self-control. (D) Comparison of total time in light (sec) recorded after light aversion induction between male and female mice. (E) Comparison of total time in light relative to self-control recorded after light aversion induction between male and female mice. Data are shown as mean ± SEM. Significant difference was shown by * P < 0.05, ** P < 0.01, *** P < 0.001, or **** P < 0.0001; # P < 0.05, ## P < 0.01, ### P < 0.001, #### P < 0.0001. * Indicates comparison between dependent groups and # indicates comparison between independent groups
In order to better understand the UMB-induced photophobia-like behavior, we also analysed transition times of mice between the light and dark compartments of the chamber. In male mice, there was no alteration of transition times in the vehicle group (37.50 ± 6.330) compared to the self-control (43.40 ± 8.394, P = 0.5177, n = 10, Fig. 3A and B). Differently, the transition times was significantly lower (P = 0.0022, Fig. 3A and B) in the UMB group (23.86 ± 5.932, n = 11) compared to its self-control (52.50 ± 8.422). In compatible, a clear trend of reduction in transition times normalised to the self-control (P = 0.0708, Fig. 3C) was observed in the UMB group (0.4574 ± 0.1173, n = 11) compared to that in the control group (0.8931 ± 0.1690, n = 9). In female mice, significant reduction of transition times normalised to self-control (P = 0.018, Fig. 3C) was observed in the UMB group when compared to that in the vehicle group. It was noted that there was also a significant reduction of transition times by the vehicle (P = 0.0064) compared to that of self-control (Fig. 3A and B).
Females spent transition times than males even after the vehicle administration. It is possible that females are typically more susceptible to external stimuli compared to their male counterparts. Whether mice’ memory effect affecting the second behavior recording only in females requires further investigation as similar results were not observed in male mice. When the male and female photophobia mice were compared, there was no gender-different difference in the total time in light (M: 248.2 ± 53.85 s, n = 11; F: 149.0 ± 24.8 s, n = 13; P = 0.3031, Fig. 2D) or those normalised to the self-control (M: 0.4982 ± 0.09587; F: 0.3256 ± 0.06432; P = 0.1522, Fig. 2E). Nor there was significant difference in transitions times of male and female photophobia mice (M: 23.86 ± 5.932; F: 26.62 ± 4.720; P = 0.7204, Fig. 3D), or those normalised to the self-control (M: 0.4574 ± 0.1173; F: 0.2500 ± 0.04524; P = 0.1231, Fig. 3E). Taken all these together, the reduced total time in light and decreased transition times in male mice, to a lesser extent, in female mice by intranasal injection of UMB demonstrate successful provocation of light aversion behavior, which provides a rapid onset and injury-free mouse model of photophobia for subsequent investigation of drug effect.
Fig. 3
SFKs antagonism by saracatinib reduced transition times between the light and dark compartments in light in male C57BL/6J photophobia mice induced by intranasal injection of UMB. Transition times data was collected as the same as total time in light from the same mice shown in Fig. 2. (A, B) Transition (times) between the light and dark compartments before and after light aversion induction. (C) Transition times recorded after light aversion induction relative to self-control. (D) Comparison of transition times recorded after light aversion induction between male (M) and female (F) mice. (E) Comparison of transition times recorded after light aversion induction relative to self-control between male and female mice. Data are shown as mean ± SEM. Significant difference was shown by * P < 0.05, ** P < 0.01, *** P < 0.001, or **** P < 0.0001; #P < 0.05, ##P < 0.01. *Indicates comparison between dependent groups. # Indicates comparison between independent groups
Using this novel photophobia model, we investigated the effects of the SFKs inhibitor, SRCT on light aversion in mice that were intraperitoneally administered with SRCT (20 mg/kg) or its vehicle (0.25% DMSO) for consecutive 2 days prior to photophobia induction. In male photophobia mice, the total time in light was significantly higher (P = 0.0075, Fig. 2B) in the SRCT group (546.7 ± 72.11 s) than that in the vehicle group (248.2 ± 53.85 s). Higher total time in light normalised to self-control (P = 0.0005, Fig. 2C) was similarly observed in SRCT group (1.31 ± 0.20) than that in the vehicle group (0.50 ± 0.10), suggesting male photophobia mice was sensitive to SFKs antagonism. Differently, there was no alternation of the total time in light (relative to self-control) in female photophobia mice that were treated with SRCT compared to that in the vehicle group (Fig. 2C). There were significant differences in total time in light presented in both absolute and relative values between the two sexes, suggesting male photophobia mice, but not female, was sensitive to SFKs antagonism (Fig. 2D and E). Likewise, the transition times was reversed by SRCT only in male photophobia mice, but not in female (Fig. 3B and C) and this parameter was significantly higher (P = 0.0001, Fig. 3F) in male (M: 0.8680 ± 0.08493) than that in female (0.2765 ± 0.06048). These data support that the effects of SRCT on reducing light aversion only in male mice.
The effect of saracatinib on light aversion is not associated with hypothalamic CGRP and PACAP levelsCGRP and PACAP are widely known for inducing light aversion via independent convergent pathways in CD-1 mice [7]. We explored the impact of SFKs antagonism by SRCT on hypothalamic CGRP and/or PACAP levels using the hypothalamus tissue dissected immediately after the behavior observation. Both CGRP and PACAP were detected in the hypothalamus of all mice investigated (Fig. 4). In the control group, the basal level of CGRP and PACAP in male mice was 114.9 ± 35.05 pg/ml (Fig. 4A) and 13.29 ± 1.514 pg/ml respectively (Fig. 4D). Female mice had similar basal CGRP levels as in male (Fig. 4B and C); Whilst PACAP level was 1.81-fold higher (P = 0.0009, Fig. 4E and F) in female (24.11 ± 2.186 pg/ml) than that in male (13.29 ± 1.514 pg/ml). Neither CGRP nor PACAP level was altered after intranasal injection of UMB in the absence or presence of SRCT in both female and male mice (Fig. 4A, B, D and E). Notably, when comparing the CGRP or PACAP levels between the two sexes, female photophobia mice exhibited overall higher levels of these neuropeptides, particularly with PACAP (Fig. 4C and F), which is SFKs-independent.
Fig. 4
SFKs antagonism did not alter CGRP and PACAP levels in the hypothalamus of C57BL/6J photophobia mice. The hypothalamus of the mouse in the control, photophobia, and photophobia with SRCT groups in both male and female mice was collected from the same mouse cohort as the light aversion behavior shown in Fig. 2. (A, B) Levels of hypothalamus CGRP protein expression (pg/ml) in male and female mice respectively. (C) Comparison of hypothalamus CGRP protein expression (pg/ml) between male and female mice. (D, E) Levels of hypothalamus PACAP protein expression (pg/ml) in male and female mice respectively. (F) Comparison of hypothalamus PACAP protein expression (pg/ml) between male and female mice. Data were presented as mean ± SEM. One-way ANOVA was used for comparison among the three groups and two-tailed unpaired t-test was used for comparison between male and female group. Significance differences were indicated as * P < 0.05, *** P < 0.001, or **** P < 0.0001
Photophobia significantly altered transcriptome of the trigeminal ganglion in male mice with some changes being SRCT-sensitiveWe next tested the hypothesis that the light aversion and the reduction of this behaviour due to SFKs antagonism in male mice are associated with TG activation. Following RNA sequencing analysis of the TG immediately dissected post-behaviour observation, a general examination of gene expression profile revealed 2928 DEGs in the photophobia mice compared to the control (Fig. 5A and B; S1 Table). Among these, 2730 genes were downregulated and 198 genes upregulated (Fig. 5C). In photophobia mice pretreated with SRCT for consecutive two days, a total of 1742 genes in the photophobia mouse TG were differentially expressed compared to the photophobia only group (Fig. 5A; S2 Table). Among these, 127 genes were downregulated and 1615 genes were upregulated (Fig. 5D). Notably, of the 1742 genes identified, 1067 genes in the TG were sensitive to SFKs antagonism in these photophobia mice (Fig. 5A). It is noteworthy that 95.5% of the 1067 DEGs were downregulated in the photophobia group, of which 98.0% were restored by pre-treatment of SRCT as illustrated in the heat map analysis (Fig. 5B), suggesting profound transcriptomic alternation.
We further conducted pathway enrichment analysis using clusterProfiler R package. The results showed that 1067 SRCT-sensitive DEGs were enriched in 481 Gene Ontology (GO) terms in biological process and 37 in Kyoto Encyclopedia of Genes and Genomes (KEGG) pathways. The top 3 most significant biological process (BP) of GO terms were enriched in RNA splicing, autophagy, intracellular transport, ATP metabolism and mitochondrial (Fig. 5E) pathways, and those in the KEGG database pathways enriched to neurodegeneration diseases, reactive oxygen species and oxidative phosphorylation (Fig. 5F).
Fig. 5
RNA-sequencing and enrichment analysis revealed profound alternation of transcriptome of TG in male photophobia mice sensitive to pre-treatment of SRCT. The merged TG of each mouse was collected from the same male mouse cohort as the light aversion behavior shown in Fig. 2. (A) Venn diagram visualized numbers of differentially expression genes (DEGs, adjusted P-value < 0.05) identified from UMB vs. DMSO and UMB_SRCT vs. UMB groups. The overlapped region showed the number of DEGs that are sensitive to SRCT. (B) Heatmap showed the expression level of 1067 DEGs in each sample of the three experimental groups. 95.5% of these DEGs were downregulated by UMB, of which 98.0% were restored by pre-treatment of SRCT. (C, D) The volcano plot depicted the numbers of DEGs (|log2FoldChange|≥0, adjusted P-value ≤ 0.05) between UMB vs. DMSO and UMB_SRCT vs. UMB. Each dot represents a DEG, and red or blue dots indicate down- or up- regulation, respectively; The transcripts with |log2FoldChange|>20 in both two comparisons were labelled by the names of genes they transcript from. (E) Gene ontology enrichment analysis and the top 20 terms in the categories of biological process (BP) for the SFKs-sensitive DEGs in male photophobia mice (adjusted P-value < 0.05) and (F) KEGG pathway analysis and the top 20 pathways for the SFKs-sensitive DEGs in male photophobia mice. The count represents numbers of DEGs enriched to respective top 20 functions or pathways
In order to identify hub genes that are pivotal for photophobia, we filtered 1067 SRCT-sensitive DEGs with an absolute value of log2FoldChange that are greater than 20 for further analysis. Total 33 DEGs induced by photophobia were identified (S3 Table), of which expression of 32 of these transcripts were reversed by SRCT (S4 Table). We then compared these genes with those known migraine-related genes reported earlier from RNA-sequencing on the TG of PACAP-induced photophobia mice, RNA-seq of migraineurs post-mortem TG and a genome-wide association study of 102,084 migraine cases [7, 31, 32]. We found expression induction of several migraine-related genes (Crebbp, Trpm3, Atp5α1 and Akt1) were downregulated by photophobia, notably this reduction was restored by SRCT in our study (Fig. 6A, B, D and E). Notably, Scn8a that encodes a sodium voltage-gated channel, was also downregulated by photophobia with the highest fold change; Conversely, gene expression of Zmynd8, a risk locus in migraineurs [31], was markedly upregulated by photophobia, both of Scn8a and Zmynd8 DEGs were restored by the SFKs inhibitor (Fig. 6C and F). These data support that male photophobia mice are associates with profound activation of TG, some of which are reversed by SFKs antagonism.
Fig. 6
Differential gene expression of selected candidate genes of TG in male mice in control, photophobia, and photophobia with SRCT groups. The merged TG of each mouse was collected from the same male mouse cohort as the light aversion behavior shown in Fig. 2. Gene level counts were calculated by DEseq2 package and its functions. Normalized counts were compared between control (n = 7, red) vs. photophobia (n = 7, purple) groups and photophobia vs. photophoibia + SRCT (n = 7, blue) groups using the Wald test for significance. Changes in gene expression of (A) Crebbp, (B) Trpm3, (C) Zmynd8, (D) Akt1, (E) Atp5a1 and (F) Scn8a were presented in respective order. Mouse number and sex are indicated. Group data were presented as mean ± SEM. Significant differences were indicated by * P < 0.05, ** P < 0.01, *** P < 0.001, or **** P < 0.0001
SFKs antagonism displayed gender-different expression modulation of the candidate genes of TG in the photophobia miceIn order to validate RNA-sequencing data of these 6 selected genes (Crebbp, Trpm3, Zmynd8, Akt1, Atp5α1 and Scn8a) in male mice and to identify the candidate genes in the TG that may link with the SRCT-exhibited gender different action on photophobia, we compared mRNA levels of the above 6 DEGs of TG between the male and female mice using qPCR. We noted that there were inconsistent results between RNA-sequencing and qPCR analysis in male mice for 4 (Crebbp, Trpm3, Akt1, Atp5α1) of the 6 genes (Figs. 6 and 7). This difference is likely due to different amplification efficiency with individual gene features (e.g., transcript length, number of exons and read quality) between the two methods and that the transcript used for qPCR assays was only one of many transcriptomes for above non-concordant genes thus reads mapping to shared exons from transcripts cannot be detected by qPCR assay. It was reported that the non-concordant genes were mostly borderline, and over 66% of all genes in the non-concordant fraction have a Δfold change (FC) < 1 and 93% have a ∆FC < 2 in an independent benchmarking study [33]. In our current study, Crebbp, Trpm3, Akt1, and Atp5a1 are non-concordant genes, all of which has a ΔFC < 1. In contrast, this is not the case for genes (Zmynd8 and Scn8a) with ΔFC > 20 and consistent data were seen between the two methods (Figs. 6 and 7).
Fig. 7
The photophobia-induced expression of the selected candidate genes of TG showed gender-different modulation by SFKs antagonism assessed by qPCR. The merged TG of each mouse was collected from the same male and female mouse cohort as the light aversion behavior shown in Fig. 2. The relative gene expression levels in control (red, male n = 6 or 7, female n = 12), photophobia (purple, male n = 6 or 7, female n = 12) and photophobia + SRCT (blue, male n = 6 or 7, female n = 11 or 12) groups were quantified using qPCR and presented by the fold changes normalized to the geometric mean of peptidylprolyl isomerase A (PPIA) and β-actin (ACTB), and expressions were determined using 2−ΔCT method. Changes in gene expression level of (A) Crebbp, (B) Trpm3, (C) Zmynd8, (D) Akt1, (E) Atp5a1 and (F) Scn8a between control vs. photophobia groups, photophobia vs. photophoibia + SRCT groups, and male vs. female were presented in respective order. Either Mann-Whitney test (abnormal distributed data) or unpaired t-test (normally distributed data), one-tailed test was used for significance. Group data were presented as mean ± SEM. Significant differences were indicated by * P < 0.05, ** P < 0.01, *** P < 0.001, or **** P < 0.0001. # P < 0.05, ## P < 0.01, ### P < 0.001, #### P < 0.0001. * Comparisons within the same gender and # comparisons between male and female
Our qPCR data showed that, in the male mouse TG, gene expression of Crebbp, Trpm3, Zmynd8, Akt1 and Atp5α1 (Fig. 7A-E) were upregulated, whilst Scn8a (Fig. 7F) was downregulated in the photophobia group. Such changes in gene expression of Crebbp, Trpm3, Zmynd8 and Scn8a were all reversed by the SFKs inhibitor, except that of Akt1 and Atp5α1 (Fig. 7D and E). In contrast to male mice, none of the mRNA levels of these 6 genes was altered by photophobia in the absence or presence of SRCT pretreatment in the TG of female mice (Fig. 7). These data suggest female photophobia mice showed different gene expression modulation by SRCT from that of the male mice. When mRNA levels of Crebbp, Trpm3, Zmynd8 and Akt1 were compared between the two sexes, female photophobia mice showed significant lower levels than that of males (Fig. 7A-D). In contrast, there was no difference in the induction of gene expression of Atp5α1 and Scn8a (Fig. 7E and F).
Comments (0)