
Remember me

After surgery, image artifacts from metal implants have always been an obstacle in computed tomography (CT) imaging due to their potential to degrade image quality and compromise image assessment.1 Among various techniques available, spectral shaping by tin prefiltration has proven to be a reliable strategy that combines significant dose reduction with the potential for metal artifact reduction.2–7 Another standard method is the reconstruction of virtual monoenergetic images (VMIs) derived from dual-energy CT data of energy-integrating detector (EID) CTs.8 High-kiloelectron volt VMIs demonstrate less susceptibility to beam hardening, thus resulting in fewer artifacts around various metal implants.9,10
Photon-counting detector (PCD) CT is a technology recently introduced into clinical practice that directly converts x-ray photons into an electrical signal. This permits counting the number of individual photons with an energy level above a preset threshold, thus generating data sets containing multispectral x-ray information that can be binned at specific keV ranges.11,12
It is known that PCD CT offers improved image quality and less image noise compared with EID CT systems,12 but the impact on musculoskeletal applications in daily clinical practice remains unclear. Furthermore, the combination of VMI with tin prefiltration to reduce metal artifacts in a PCD CT system has only been tested in phantom studies.6,13
Therefore, this study assessed the impact of VMI reconstructions at different keV levels on metal artifacts induced by internal fixation material in images acquired on a PCD CT system and compared acquisitions with and without tin prefiltration. Moreover, the ideal keV range to minimize artifacts based on quantitative metrics and subjective image ratings concerning image interpretability and visibility of osseous healing was determined.
MATERIALS AND METHODS PatientsThe local institutional review board (Cantonal ethics committee Zurich) approved this retrospective, single-center study, waiving the written informed consent requirement. All procedures adhered to national ethical standards and the 1964 Helsinki Declaration, including its subsequent amendments.
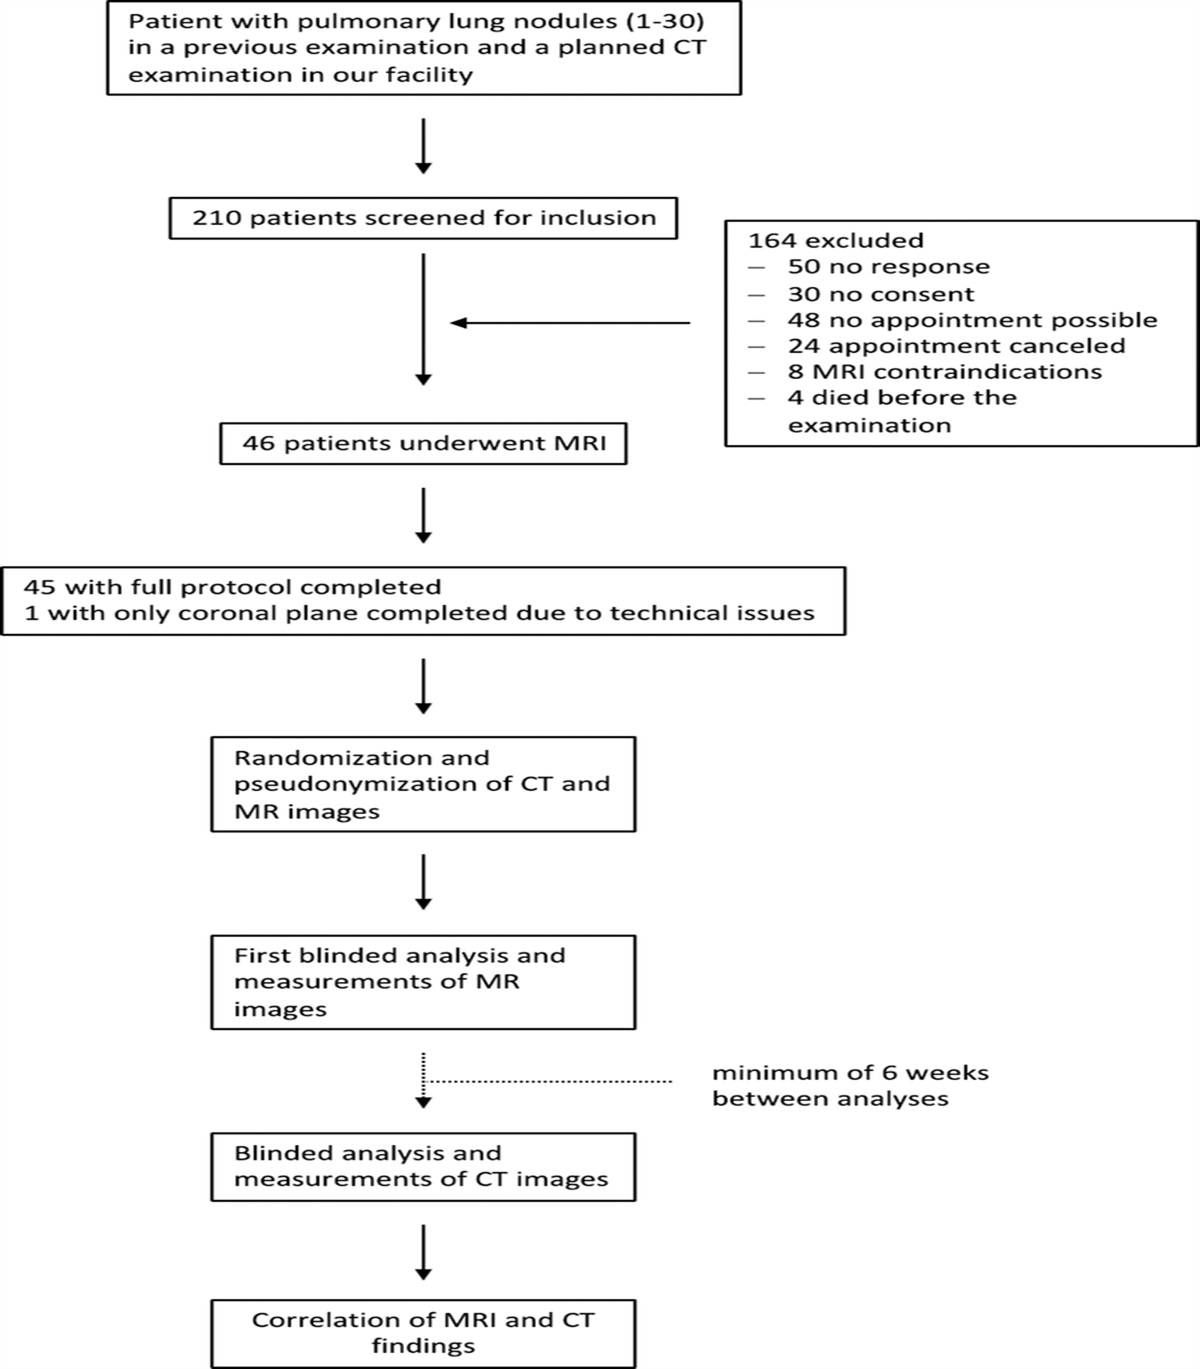
The radiology information system was reviewed to identify eligible patients who underwent clinically referred nonenhanced PCD CT of the ankle between March and October 2023. Inclusion criteria consisted of a history of operative internal fixation with screws and/or plates. In contrast, patients without metal implants or patients <18 years were excluded from this study.
Image Acquisition and ReconstructionAll patients underwent CT examinations with tin prefiltration (Sn) or dose-matched examinations without tin prefiltration on a commercially available PCD CT system (Naeotom Alpha; Siemens Healthineers) with feet first in supine position. All acquisition parameters were set according to the local clinical standard. For tin-prefiltered acquisitions, this was multispectral QuantumSn ultra-high-resolution mode, tube voltage of 140 kVp (kilo voltage peak), detector collimation of 120 × 0.2 mm with automatic tube current modulation. Non–tin-prefiltered acquisitions were performed in QuantumPlus ultra-high-resolution mode with a tube voltage of 120 kVp and detector collimation of 120 × 0.2 mm. For both acquisitions, polychromatic images with full spectral information were acquired at an image quality level of 30 with a corresponding current of 90 mAs, a pitch of 0.85, and a gantry rotation of 0.5 rotations per second. Images were reconstructed with a dedicated sharp bone kernel (Br76, quantum iterative reconstruction strength of 3 of 4) in sagittal orientation. Matrix size was set at 512 × 512 with a field of view of 170 mm and a slice thickness of 0.4 mm with an increment of 0.4 mm. Virtual monoenergetic images were computed at 14 different energy levels covering the full keV range available (60 to 190 keV) with a 10-keV increment.
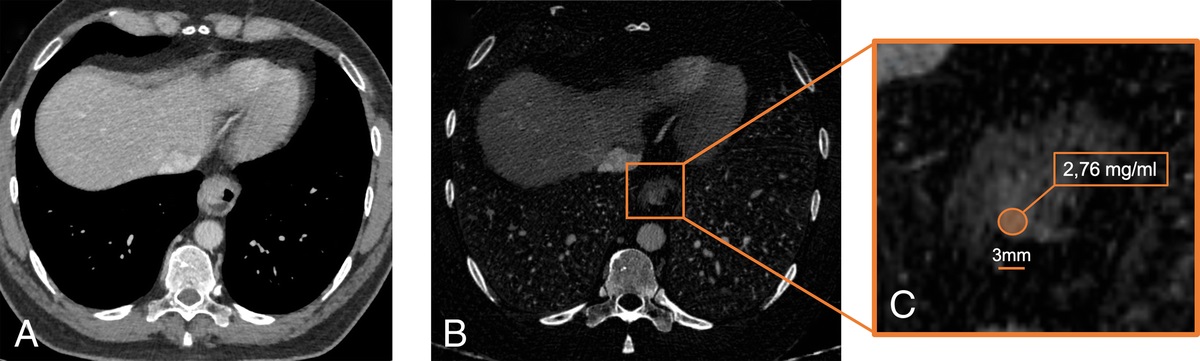
Quantitative Image AnalysisAll image analyses were performed on a dedicated workstation and within the local picture archiving and communications system (Merlin; Phönix PACS) by a fellowship-trained radiologist with 4 years of experience in musculoskeletal imaging (A.A.M.). Quantitative image data were obtained by drawing regions of interest (ROIs) of 10 mm within the most pronounced hyperdense and hypodense artifacts adjacent to the metal implants and in the lipid tissue subjectively unaffected by the artifact (Fig. 1), as previously reported by other authors.14,15 All ROIs were placed on polychromatic images and then copied to the identical position on VMIs of different energy levels. To achieve a high level of measurement accuracy, ROIs on polychromatic images were placed on 3 consecutive CT slices. Subsequently, the averaged noise (measured as the standard deviation of the Hounsfield units [HU]) within the encircled areas of the artifact-impaired tissue was assessed as a surrogate for artifact severity. This approach was chosen according to data published by Große Hokamp et al.16 Subsequently, image noise within the reference subcutaneous fat tissue was recorded for further analysis. Given the generally lower image noise in high-keV reconstructions, the corrected image noise for artifact severity assessment was calculated as the difference between the image noise within the artifact-impaired tissue and the reference subcutaneous fat tissue (hereafter, Noisecorr).10 For intrareader reliability, all quantitative analyses were repeated for 30 patients after 8 weeks.
 FIGURE 1:
 Exemplary region of interest (ROI) placement on polychromatic photon-counting CT images with tin prefiltration of 2 patients who received plate osteosynthesis after a distal tibia fracture (A and C) and multiple screws for correction of foot deformity (B and D). All ROIs were placed in the most pronounced near-metal hyperdense (A and B) and hypodense (C and D) artifacts on polychromatic images (A–D) and then copied to the identical position on virtual monoenergetic images of different energy levels (not shown). ROI size was set to 10 mm2. Sagittal CT reconstructions are shown.
Image AssessmentThe subjective image assessment of polychromatic images and VMI reconstructions at 60 keV, 90 keV, 120 keV, 150 keV, and 190 keV was assessed independently by 3 musculoskeletal radiologists (A.A.M, S.S.G, G.W.K.) blinded to clinical data, patient data, and quantitative image analysis results. This was done for polychromatic images and VMIs of tin-prefiltered acquisitions (VMISn) and for polychromatic images and VMIs without tin prefiltration (VMIStd). This graduation was chosen to avoid obscuring qualitative differences by too small increments and has been used similarly in other studies evaluating the image quality of VMI reconstructions.14,15
A 5-point Likert scale was used for rating the visibility of osseous healing and image interpretability (1 = insufficient, 2 = significantly impaired, 3 = mediocre, 4 = marginally impaired, 5 = excellent) as well as for artifact extent (1 = severe, 2 = pronounced, 3 = moderate, 4 = minor, 5 = absent/almost absent). A separate training set of 5 ankle CT scans was used to familiarize all readers with the utilized scoring system before commencing the study. All images' window width and center were preset at 1500/450 HU, whereas readers could change the default window settings.
Statistical AnalysisAll statistical analyses were performed in SPSS Statistics (v29.0.0; IBM Corp). Normal distribution of continuous variables was assessed by the Shapiro-Wilk test. If distributed normally, continuous data are presented as mean ± standard deviation. For continuous data with nonnormal distribution, we report the median and interquartile range. Ordinal data are reported as median and range. Objective image quality and subjective image quality ratings were compared between polychromatic images and VMIs using Friedman 2-way analysis of variance by ranks with pairwise post hoc tests and between tin-prefiltered and non–tin-prefiltered acquisitions with the Wilcoxon signed rank test. P values were corrected for multiple comparisons using the Bonferroni procedure. Interreader and intrareader reliability was assessed with the intraclass correlation coefficient (ICC). Results were categorized according to the system of Koo and Li17: ICC > 0.90, excellent; 0.75–0.90, good; 0.50–0.75, moderate; and <0.50, poor. P values below 0.05 were considered statistically significant.
RESULTS Patient Characteristics and Radiation DosePatient characteristics are summarized in Table 1. The mean age of the 48 included patients (21 female, 27 male) was 55.1 ± 19.4 years. Indications for surgery included trauma (n = 23), foot deformity (n = 13), osteoarthritis (n = 10), and tarsal coalition (n = 2). Among the individual patients, 20 (41.7%) received titanium alloy bone screws, whereas 22 (45.8%) received titanium alloy plate osteosynthesis combined with titanium alloy bone screws. Six patients (12.5%) underwent plate osteosynthesis made out of stainless steel. For tin-prefiltered and non–tin-prefiltered acquisitions, mean radiation dose of the examinations was 2.99 ± 0.07 mGy/3.02 ± 0.05 mGy using the CT dose index and 7.55 ± 0.09 mGy/7.86 ± 0.13 mGy using the size-specific dose estimate.
TABLE 1 - Characteristics of Patients Undergoing Tin-Prefiltered and Non–Tin-Filtered Acquisitions on Photon-Counting Detector CT Tin-Prefiltered Acquisitions (n = 30) Non–Tin-Filtered Acquisitions (n = 18) Age, y 53.8 ± 18.8 56.2 ± 21.5 Sex, female, n (%) 13 (43.3) 8 (44.4) Indication for surgery, n (%) Trauma 13 (43.3) 10 (55.6) Foot deformity 8 (26.7) 5 (27.8) Osteoarthritis 7 (23.3) 3 (16.7) Tarsal coalition 2 (6.7) 0 Type of osteosynthesis, n (%) Titanium alloy screw 13 (43.3) 7 (38.9) Titanium alloy plate and screws 14 (46.7) 8 (44.4) Stainless steel plate 3 (10.0) 3 (16.7)The results of all quantitative analyses are summarized in Table 2. Noisecorr of hyperdense and hypodense artifacts was significantly lower in tin-prefiltered acquisitions for polychromatic images as well as for all VMI reconstructions (P ≤ 0.043). VMISn ≥120 keV yielded a significant artifact reduction compared with polychromatic images for both hyperdense and hypodense artifacts, whereas for VMIStd, this applied to reconstructions ≥100 keV (Fig. 2). Absolute values of Noisecorr increased for both VMISn and VMIStd ≤70 keV for hyperdense artifacts and ≤80 keV for hypodense artifacts (Table 2). However, no significant difference was found for the initial increase of absolute values of Noisecorr compared with polychromatic images (Table 3).
TABLE 2 - Artifact Assessment for Polychromatic Images and Different Energy Levels of VMIs Corrected Image Noise (HU)* Tin-Prefiltered Acquisitions Non–Tin-Prefiltered Acquisitions P† Hyperdense Artifacts Hypodense Artifacts Hyperdense Artifacts Hypodense Artifacts Hyperdense Artifacts Hypodense Artifacts Polychromatic image 40.2 (39.8) 91.2 (82.4) 57.5 (33.4) 106.9 (76.1) 0.001‡ 0.043‡ 60 keV 88.0 (99.9) 191.5 (216.5) 114.1 (94.8) 173.9 (258.3) <0.001‡ <0.001‡ 70 keV 54.0 (54.8) 131.0 (131.3) 87.7 (63.1) 141.9 (138.3) <0.001‡ <0.001‡ 80 keV 36.4 (40.7) 97.4 (89.0) 56.2 (46.7) 108.4 (101.3) <0.001‡ <0.001‡ 90 keV 26.0 (31.0) 65.0 (71.3) 33.2 (40.4) 67.7 (85.5) <0.001‡ <0.001‡ 100 keV 18.5 (23.9) 51.5 (45.9) 19.4 (27.6) 57.4 (55.7) <0.001‡ <0.001‡ 110 keV 14.6 (17.8) 36.0 (38.3) 19.2 (14.7) 42.1 (50.6) <0.001‡ <0.001‡ 120 keV 14.0 (11.1) 29.7 (39.6) 19.8 (11.3) 33.7 (41.9) <0.001‡ <0.001‡ 130 keV 14.4 (9.9) 25.7 (32.5) 18.7 (10.5) 30.0 (36.5) <0.001‡ <0.001‡ 140 keV 14.1 (9.5) 26.5 (32.6) 16.1 (16.3) 28.5 (34.1) <0.001‡ <0.001‡ 150 keV 15.4 (9.4) 25.7 (31.2) 19.1 (8.5) 31.4 (28.3) <0.001‡ <0.001‡ 160 keV 16.0 (10.9) 25.3 (28.5) 19.1 (7.3) 30.4 (23.3) <0.001‡ <0.001‡ 170 keV 16.3 (12.0) 24.9 (27.1) 17.9 (12.5) 27.6 (22.7) <0.001‡ <0.001‡ 180 keV 16.9 (12.2) 24.3 (29.1) 16.0 (12.4) 26.0 (26.8) <0.001‡ <0.001‡ 190 keV 17.3 (12.3) 24.6 (28.3) 19.8 (12.4) 27.7 (22.9) <0.001‡ <0.001‡*Data are given as median with interquartile range in parentheses.
†P values for comparison between tin-prefiltered and non–tin-prefiltered acquisitions by Wilcoxon signed rank test.
‡Statistical significance.
VMI, virtual monoenergetic image; HU, Hounsfield units.
 FIGURE 2:
 Boxplots illustrating corrected image noise of hyperdense and hypodense artifacts in polychromatic images and for different energy levels of virtual monoenergetic images (VMIs) in tin-prefiltered acquisitions (A and B) and non–tin-prefiltered acquisitions (C and D). Asterisks indicate a significant difference between VMI and polychromatic images. Sn, Tin-prefiltered acquisitions.
TABLE 3 - Comparison of Artifact Assessment Between Different VMIs and Polychromatic Images P (VMI vs Polychromatic Image)* Tin-Prefiltered Acquisitions Non–Tin-Prefiltered Acquisitions Hyperdense Artifacts Hypodense Artifacts Hyperdense Artifacts Hypodense Artifacts 60 keV >0.999 >0.999 >0.999 >0.999 70 keV >0.999 >0.999 >0.999 >0.999 80 keV >0.999 >0.999 >0.999 >0.999 90 keV >0.999 >0.999 >0.999 >0.999 100 keV 0.373 >0.999 <0.001† 0.021† 110 keV 0.063 0.409 <0.001† <0.001† 120 keV <0.001† 0.01† <0.001† <0.001† 130 keV <0.001† <0.001† <0.001† <0.001† 140 keV <0.001† <0.001† <0.001† <0.001† 150 keV <0.001† <0.001† <0.001† <0.001† 160 keV <0.001† <0.001† <0.001† <0.001† 170 keV <0.001† <0.001† <0.001† <0.001† 180 keV <0.001† <0.001† <0.001† <0.001† 190 keV <0.001† <0.001† <0.001† <0.001†*P values by Friedman 2-way analysis of variance with post hoc pairwise tests.
†Statistical significance.
VMI, virtual monoenergetic image.
Results of the subjective image ratings are reported in Table 4. The comparison of tin-prefiltered with non–tin-prefiltered acquisitions showed significantly better ratings for different quality aspects of polychromatic tin-prefiltered images as well as for VMISn at 90 keV and VMISn at 120 keV (P ≤ 0.014), as illustrated in Figure 3. For other reconstructions, there were no significant differences between the different acquisition modes.
TABLE 4 - Pooled Subjective Assessment of Image Interpretability, Artifact Extent, and Visibility of Osseous Healing of Polychromatic Images and VMIs for 3 Independent Readers Tin-Prefiltered Acquisitions* Non–Tin-Prefiltered Acquisitions* P† Image Interpretability Artifact Extent Visibility of Osseous Healing Image Interpretability Artifact Extent Visibility of Osseous Healing Image Interpretability Artifact Extent Visibility of Osseous Healing Polychromatic image 4 (3–5) 3 (1–4) 4 (3–5) 4 (3–4) 2 (1–4) 3 (3–5) 0.025‡ <0.001‡ <0.001‡ 60 keV 2 (2–4) 1 (1–2) 2 (2–4) 2 (1–4) 1 (1–3) 2 (2–4) 0.478 0.330 0.791 90 keV 4 (3–5) 3 (1–4) 4 (3–4) 4 (3–4) 3 (2–4) 3 (3–4) 0.067 0.010‡ <0.001‡ 120 keV 5 (3–5) 4 (2–5) 5 (4–5) 4 (3–5) 4 (2–4) 5 (4–5) <0.001‡ 0.014‡ 0.725 150 keV 3 (2–4) 4 (3–5) 5 (4–5) 3 (2–4) 4 (3–5) 5 (4–5) 0.698 0.884 0.915 190 keV 2 (2–4) 4 (3–5) 5 (4–5) 2 (2–4) 4 (3–5) 5 (4–5) 0.865 0.730 0.806 ICC§ ICC§ 190 keV 0.725 (0.559–0.850) 0.738 (0.563–0.859) 0.835 (0.641–0.952) 0.801 (0.622–0.878) 0.866 (0.680–0.979) 0.794 (0.627–0.904)*Data are given as median with range in parentheses.
†P values for comparison between tin-prefiltered and non–tin-prefiltered acquisitions by Wilcoxon signed rank test.
‡Statistical significance.
§ICC values are given with 95% confidence intervals in parentheses.
VMI, virtual monoenergetic image; ICC, intraclass correlation coefficient.
 FIGURE 3:
 Polychromatic images acquired with tin prefiltration of a 25-year-old male patient who underwent correcting osteotomy of the hindfoot with bone autograft and screw implantation (A). Note the excellent delineation between the border of the autograft and the calcaneus (arrow). For comparison, polychromatic images with non–tin-prefiltered acquisition of a 61-year-old male patient who underwent subtalar arthrodesis (B). Arrows indicate artifacts from metal visible as hypodense streaks, partially obscuring the arthrodesis.
Comparisons of subjective image assessments for polychromatic images and different VMIs are shown in Table 5. Visibility of osseous healing was rated worse for both VMISn and VMIStd at 60 keV (P < 0.001) compared with polychromatic images, whereas for 90 keV, no significant difference was observed (P ≥ 0.104). On the other hand, visibility was significantly higher for VMI reconstructions ≥120 keV (P ≤ 0.044). The visibility of osseous healing of polychromatic images and VMIs reconstructed at different energy levels for a tin-prefiltered acquisition is depicted in Figure 4. For image interpretability, both VMISn and VMIStd were rated worse for the edges of the reconstruction spectrum (60 keV, 150 keV, 190 keV; P ≤ 0.001), whereas artifacts decreased with higher energy reconstructions (P ≤ 0.001). Artifact extent of polychromatic images and of VMIs reconstructed at different energy levels is shown for a tin-prefiltered acquisition in Figures 5 and 6.
TABLE 5 - Comparison of Subjective Image Assessment Between Different VMIs and Polychromatic Images, for Both Tin-Prefiltered Acquisitions and Non–Tin-Prefiltered Acquisitions P (VMI vs Polychromatic Image)* Tin-Prefiltered Acquisitions Non–Tin-Prefiltered Acquisitions Image Interpretability Artifact Extent Visibility of Osseous Healing Image Interpretability Artifact Extent Visibility of Osseous Healing 60 keV <0.001† <0.001† <0.001† <0.001† <0.001† <0.001† 90 keV 0.745 0.248 0.336 0.008† <0.001† 0.104 120 keV 0.013† <0.001† <0.001† 0.044† <0.001† <0.001† 150 keV <0.001† <0.001† <0.001† <0.001† <0.001† <0.001† 190 keV <0.001† <0.001† <0.001† <0.001† <0.001† <0.001†*P values by Friedman 2-way analysis of variance with post hoc pairwise tests.
†Statistical significance.
 FIGURE 4:
 Polychromatic images (top left) and virtual monoenergetic images with tin prefiltration in ascending order of a 46-year-old male patient who received plate osteosynthesis for internal fixation after trauma to evaluate fracture union. The arrow indicates the visibility of a fracture cleft that is not clearly visible on polychromatic images. The color change from red to green indicates a significant reduction of artifacts measured by the regions of interest in the quantitative analysis. Visibility of osseous healing was rated as “excellent” for VMI ≥120 keV and as “mediocre” for polychromatic images. Sagittal CT reconstructions are shown.
 FIGURE 5:
 Polychromatic images (top left) and virtual monoenergetic images with tin prefiltration in ascending order of a 72-year-old female patient who received plate osteosynthesis for internal fixation of a comminuted tibia fracture. Color change from red to green indicates a significant reduction of artifacts as measured by regions of interest in the quantitative analysis. The arrow indicates the initial increase and subsequent decrease in artifacts compared with polychromatic images. Sagittal CT reconstructions are shown.
 FIGURE 6:
 Polychromatic images (top left) and virtual monoenergetic images with tin prefiltration in ascending order of a 73-year-old male patient who underwent subtalar arthrodesis to correct adult-acquired flatfoot disease. Color change from red to green indicates a significant reduction of artifacts as measured by regions of interest in the quantitative analysis. The asterisks indicate the hypodense near-metal artifacts surrounding the bone screws, whereas the arrow indicates the visibility of the screw head.
Interreader and Intrareader ReliabilityInterreader reliability was good for visibility of osseous healing (ICC, 0.794–0.835), image interpretability (ICC, 0.725–0.801), and artifact extent (ICC, 0.738–0.866; see Table 4). Intrareader reliability for all quantitative analyses was good for both hyperdense (ICC, 0.763; 95% confidence interval, 0.587–0.877) and hypodense artifacts (ICC, 0.802; 95% confidence interval, 0.610–0.929).
DISCUSSIONThis study evaluated the potential of VMIs on tin-prefiltered PCD CT for reducing metal artifacts: An effective reduction of hyperdense and hypodense artifacts was achieved for VMI levels ≥120 keV, improving the depiction of osseous healing in patients with internal fixation of the ankle. Concerning subjective image assessment, VMI levels at 120 keV exhibited superior interpretability and fewer artifacts than polychromatic images. In contrast, other VMI reconstructions were rated similar or worse to the reference image.
Tin prefiltration has already been shown to reduce metal artifacts in EID CT images,5 while adding the benefit of lowering radiation dose.2–4 However, the potential of tin prefiltration to reduce metal artifacts in PCD CT has only been exploited in phantom studies.6,13
The significant quantitative artifact reduction with VMISn and VMIStd is consistent with a phantom study by Anhaus et al,13 in which VMIs of PCD CT images yielded an optimal metal artifact reduction from spinal screws at an energy level of 120 keV for tin-prefiltered and of 100 keV for non–tin-prefiltered images. This could be attributed to the influence of the atomic number and penetration length of the implant material on artifact extent, whereas the reduced base artifact level of tin-prefiltered acquisitions compared with non–tin-prefiltered acquisitions might be explained by the number of projections that do not include metal, increasing the precision during reconstruction.13
On the other hand, studies on PCD CT systems without spectral shaping at 120 kVp tube voltage found optimal keV levels of 110 keV and 130 keV to minimize metal artifacts after posterior spinal screw fixation.
Comments (0)