
Remember me

Computed tomography (CT) is a widely used imaging modality in daily clinical practice.1–4 Scan and contrast media (CM) protocols have been optimized and individualized based on patient characteristics and clinical indications to improve image quality and to reduce the amount of CM used.3–13 Other aspects that should be considered regarding the usage of intravenous CM are patient comfort and safety.
A higher viscosity is believed to result in reduced patient comfort and image quality, as well as an increased risk of adverse events. However, there is still diversity in the literature concerning these topics.14–24 The viscosity of CM can be reduced by lowering the CM concentration or by elevating its temperature.16,17,25,26 Various studies have presented differing perspectives on the impact of CM concentration on patient comfort, safety, and image quality, yielding inconsistent results.20–24 In addition, the literature reflects disparities concerning the effect of elevating the CM temperature on patient comfort, safety, and image quality.14–19 Regarding patient safety, Davenport et al16 demonstrated reduced extravasation rates when prewarming high concentrated CM but found no differences in allergic-like reactions. Conversely, Zhang et al17 have illustrated that lowering the viscosity of highly concentrated CM through prewarming to body temperature is associated with a reduction in allergic-like reactions, whereas no evidence was found for decreased extravasation rates. In the context of low CM concentrations, prewarming does not appear to reduce the extravasation rate or the incidence of allergic-like reactions.14,16–18
The diversity in study findings has led to discrepancies in guideline recommendations regarding prewarming CM. According to the European recommendations (ESUR guidelines 10.0), it is suggested to always prewarm iodinated CM before intravenous administration to improve patient comfort and to reduce the risk of CM extravasation, mainly based on expert opinion.27 On the other hand, the American College of Radiology only recommends prewarming of CM for concentrations of ≥370 mg I/mL, injection rates above 5 mL/s, or when a small catheter gauge is used.16,28
The aim of this study was to examine whether prewarmed CM is superior with respect to patient comfort and safety in comparison to CM at room temperature, for both low and high concentrations of CM.
MATERIALS AND METHODS EthicsThis study received a waiver of written informed consent from the local ethical committee and institutional review board. This waiver was granted as all CM variations used in this study adhered to recommended guidelines, and data were analyzed anonymously (METC 2022-3577). The study did not receive any industry support.
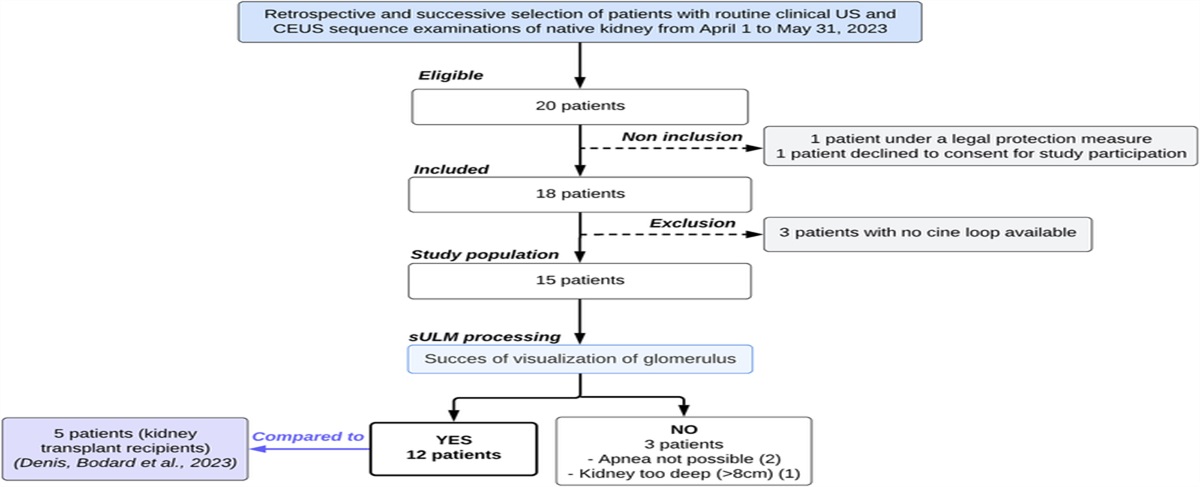
Study PopulationAll elective patients scheduled for a contrast-enhanced CT, who filled in a questionnaire evaluating patient comfort, between October 27, 2021 and the end of October 2022 at Maastricht University Medical Center+, were eligible for inclusion. Exclusion criteria were hemodynamic instability, pregnancy, renal insufficiency (estimated glomerular filtration rate <30 mL/min per 1.73 m2), prior adverse reactions to iodinated CM, and age younger than 18 years. Scans conducted at the emergency department scanner were excluded, as the scanning experience for these patients may differ from those who receive a CT scan in outpatient clinical setting. Repeated inclusion was allowed because it was not expected to influence outcome.
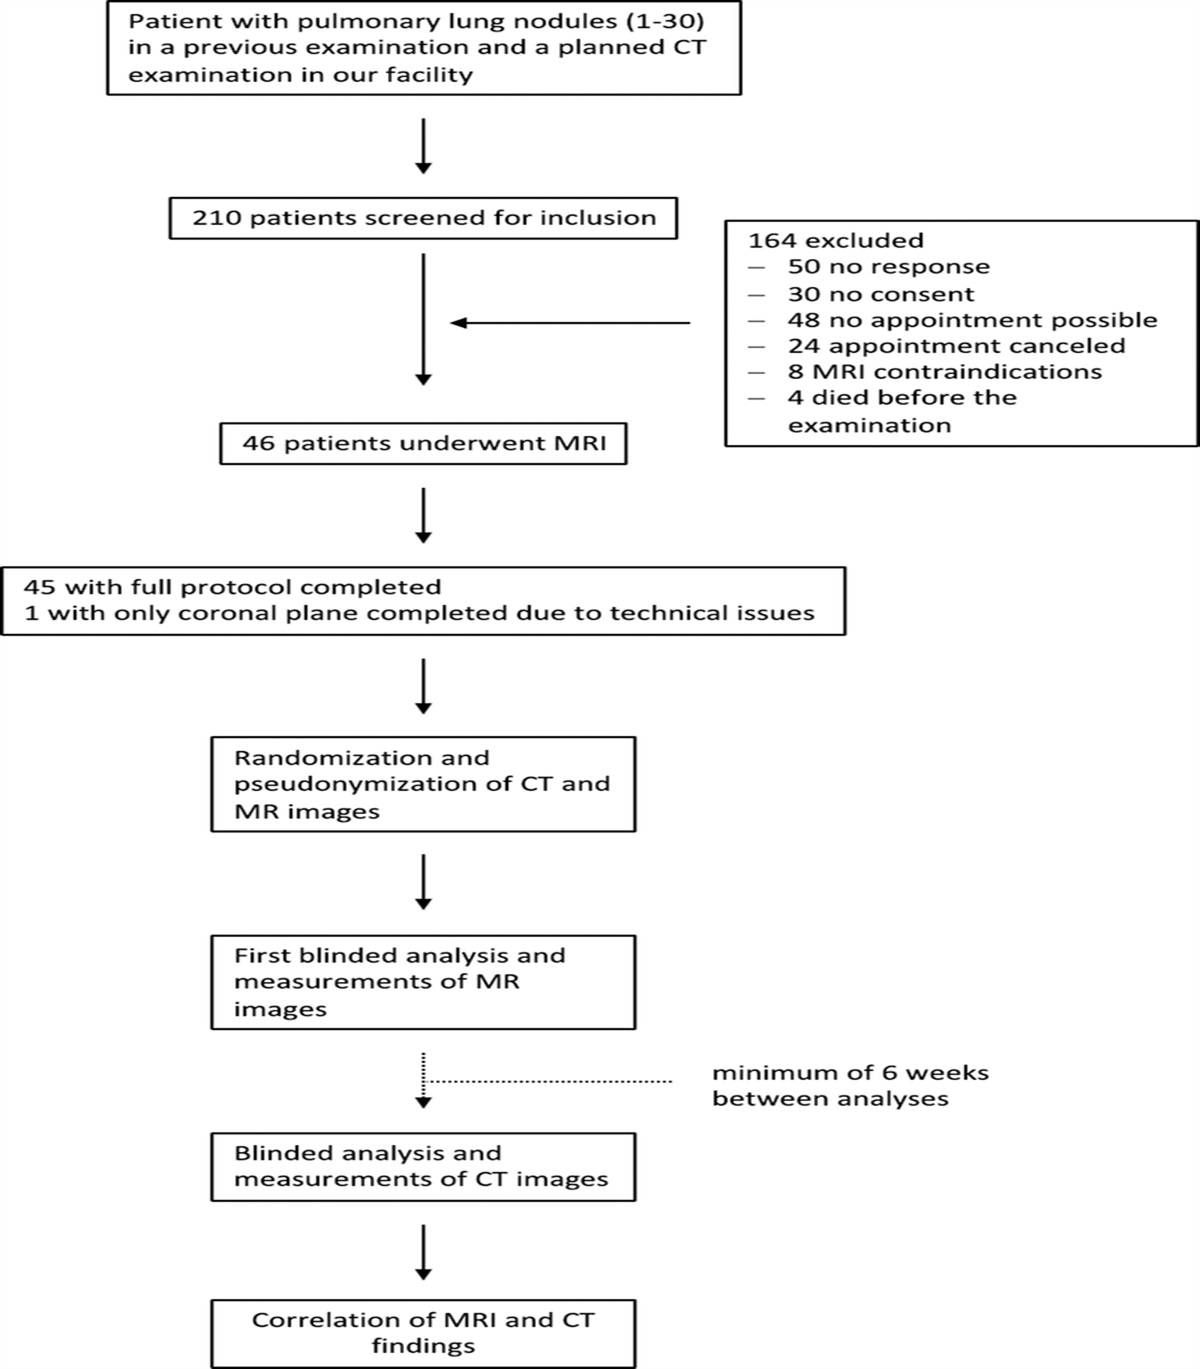
The 1-year period was divided into 4 periods, each period with a duration of approximately 3 months. Group 1 received CM prewarmed to 37°C (99°F) at a concentration of 370 mg I/mL (iopromide, Ultravist 370; Bayer Healthcare, Berlin, Germany). The same concentration was used in group 2, but at room temperature (~21°C [~73.4°F]). In group 3, the concentration was switched to 300 mg I/mL (iopromide, Ultravist 300; Bayer Healthcare, Berlin, Germany) prewarmed at 37°C. Finally, group 4 received CM 300 mg I/mL at room temperature (Fig. 1). All patients were asked to fill in a questionnaire directly after the CT scan was performed. To provide an overview of the participation rate, PACS workstation (IDS7 version 24.2; Sectra AB, Linköping, Sweden) was used to compute the total number of contrast-enhanced CT scans conducted during the 4 periods.
 FIGURE 1:
 Flowchart study protocol.
Scan and Contrast Media Injection ProtocolAll patients were scanned at the SOMATOM Force (Siemens Healthineers, Forchheim, Germany) or SOMATOM Definition AS (Siemens Healthineers, Forchheim, Germany), both third-generation CT scanners. Automated tube current modulation (CareDose4D; Siemens) and automated tube voltage selection (CarekV; Siemens) were used for single-energy scans. Dual-energy scans were conducted using CareDose4D, and to acquire the dual-energy information, tube voltage was set at a fixed level, which differed between protocols. As all scan indications were eligible for inclusion, a large variety of scan protocols was possible. Image reconstruction parameters (eg, slice thickness, kernel, and iterative reconstruction [IR] strengths) differed between protocols. For all patients, the CM injection protocol was adapted to the scan protocol. Depending on the protocol, CM dosage and flow rates were adapted and individualized to body weight and/or tube voltage. Contrast media injections were performed using a dual-head power injector (Stellant; Bayer Healthcare, Berlin, Germany). A dedicated data acquisition program (Certegra Informatics Solution; Bayer) monitored the CM parameters. All data were reported on electronic case report forms.
Primary OutcomesThe questionnaire analyzed patient comfort, pain, and any accompanying feelings. Patient comfort was rated on a 5-pointed Likert scale (1 = excellent 2 = good, 3 = neutral, 4 = bad, 5 = very bad).14,29 Pain was evaluated on an 11-point numeric scale in which 0 was no pain and 10 was very severe pain.21 In addition, to examine the occurrence of any adverse events, patients were asked if they experienced any feelings of heat sensation, nausea, vomiting, itchiness, urticaria, difficulty breathing, dizziness, goosebumps, or an odd taste. In cases where the questionnaire was not fully completed, the provided answers were included in the analysis. Technicians were instructed to report any adverse events. In case of CM extravasation, additional information concerning possible causes was requested (eg, small catheter gauge, uncertainty about catheter placement, or an existing venous access obtained by someone else than the technician).30 Any treatment required for the extravasation was documented as well. To assess allergic-like reactions, technicians were required to report instances of (reported) nausea, vomiting, itching, urticaria, difficulty breathing, dizziness, low blood pressure, vasovagal responses, or anaphylactic shock. In addition, the PACS workstation was cross-checked to ensure all adverse events were reported.
Secondary OutcomesAttenuation (in Hounsfield units, HU) was determined in a selection of cases. Coronary computed tomography angiography (CCTA) scans were used to examine attenuation in vascular studies, and for portal venous studies, all available abdominal scans in portal venous phase were used to assess liver enhancement. Attenuation in CCTA was measured in the proximal left main artery and the proximal right coronary artery. For parenchymal studies, attenuation was determined in the left and right liver lobe. A region of interest, maximized in size and meticulously avoiding any vessels or lesions, was delineated.
Statistical AnalysisStatistical analyses were conducted using the SPSS statistical software package version 29 for IOS (IBM Corp, Armonk, NY). Descriptive statistics were performed to test the differences in means of age, gender, weight, iodine delivery rate (IDR), total iodine load (TIL), dosing factor (g I/kg), peak pressure, and peak flow rate. Categorical variables were tested using the χ2 test, and the Kruskal-Wallis test was used for continuous variables. Outcome was reported as percentages for categorical variables; continuous variables were reported as mean ± standard deviation (SD).
Kruskal-Wallis test was used to examine if there were significant differences in patient comfort and pain during CM administration among the 4 groups. The outcomes were used as a continuous scale. The χ2 tests were used to analyze adverse events. All outcomes were reported as percentages, and for the outcome pain, 3 groups were formed (0–3 = no pain/mild, 4–6 = moderate, and 7–10 = severe pain). Post hoc analyses with Bonferroni corrections were performed to examine the differences among the 4 groups separately.
Kruskal-Wallis test was performed to examine the differences in attenuation among the 4 groups. Coronary computed tomography angiographies and portal venous CT scans were examined separately. Attenuation was described using mean ± standard deviation (SD).
RESULTS Baseline CharacteristicsNine thousand thirty-one patients underwent a contrast-enhanced CT-scan during the given period. A total of 5335 (59.1%) individuals completed the questionnaire and were consequently included. A small number of patients (239) only partly completed the questionnaire. Baseline characteristics are detailed in Table 1. No significant differences were found among the groups regarding age, gender, and body weight.
TABLE 1 - Baseline Characteristics Total Group 1 (370 mg I/mL, 37°C) Group 2 (370 mg I/mL, Room Temperature) Group 3 (300 mg I/mL, 37°C) Group 4 (300 mg I/mL, Room Temperature) P Total contrast-enhanced CT scans, n 9031 2334 2212 2,76 2209 Included, n (%) 5335 (59.1%) 1504 (64.4%) 1364 (61.7%) 1301 (57.2%) 1136 (51.4%) Age, y 64.7 ± 10.6 64.7 ± 12.2 65.1 ± 11.7 64.5 ± 12.1 64.6 ± 12.6 0.781 Sex (% female) 46.3% 44.8% 46.1% 47.1% 47.4% 0.515 Body weight, kg 78.9 ± 16.9 79.3 ± 17.3 79.1 ± 16.8 79.0 ± 16.6 77.9 ± 16.7 0.197 CCTA, n (%) 923 (17.3%) 208 (13.8%) 256 (18.8%) 257 (19.8%) 202 (17.4%) IDR, g L/s 1.53 ± 0.43 1.44 ± 0.48 1.63 ± 0.45 1.50 ± 0.40 1.53 ± 0.38 <0.001* Portal venous CT, n (%) 2697 (50.6%) 756 (50.2%) 684 (50.1%) 643 (49.4%) 614 (52.8%) TIL, g 31.0 ± 6.3 31.2 ± 6.6 31.3 ± 6.3 31.1 ± 6.1 30.4 ± 6.2 0.126 Dosing factor, g I/kg 0.406 ± 0.037 0.407 ± 0.037 0.408 ± 0.036 0.407 ± 0.038 0.403 ± 0.037 <0.001† Other,‡ n (%) 1715 (32.1%) 540 (36.0%) 424 (31.1%) 401 (30.8%) 320 (29.8%) Peak pressure, psi 105.1 ± 43.6 101.3 ± 34.6 136.0 ± 46.7 84.7 ± 35.8 96.3 ± 38.7 <0.001§ Peak flow rate, mL/s 4.0 ± 1.2 3.7 ± 1.0 3.7 ± 1.1 4.4 ± 1.2 4.3 ± 1.2 <0.001∥*Post hoc comparison showed a significant difference between group 1 and group 2 (P < 0.001), group 1 and group 4 (P = 0.033), and group 2 and group 3 (P = 0.014).
†Post hoc comparison showed a significant difference between group 1 and group 2 (P = 0.040), group 1 and group 3 (P < 0.001), group 1 and group 4 (P < 0.001), and group 2 and group 4 (P = 0.015).
‡“Other” included CT scans of the aorta, lower extremities, brain, neck, chest, and portal venous CT or CCTA scans using special CM or scan protocols.
§Post hoc comparison showed a significant difference among all groups (P < 0.05).
∥Post hoc comparison showed a significant difference between group 1 and group 3 (P < 0.001), group 1 and group 4 (P < 0.001), group 2 and group 3 (P < 0.001), and group 2 and group 4 (P < 0.001).
CCTA, coronary computed tomography angiography; IDR, iodine delivery rate; TIL, total iodine load; HU, Hounsfield unit; psi, pounds per square inch.
The IDR for CCTA (P < 0.001) and dosing factor for portal venous CT (P < 0.001) were significantly different. Examining TIL in portal venous CT scans, no significant results were found. Significant differences were found regarding peak pressure (P < 0.001) and peak flow rate (P < 0.001) (see Table 1).
Primary OutcomeComfort was graded as excellent or good by 84.7%, 83.9%, 82.9%, and 86.5% of patients in, respectively, group 1 (370 mg I/mL, 37°C), group 2 (370 mg I/mL, room temperature), group 3 (300 mg I/mL, 37°C), and group 4 (300 mg I/mL, room temperature). No significant differences were found regarding patient comfort (H = 7.640, P = 0.054) and pain score (H = 2.536, P = 0.469). Regarding adverse events, no significant differences were demonstrated examining the occurrence of contrast extravasation and allergic-like reactions (P = 0.542 and P = 0.253, respectively). Significant differences were found with respect to heat sensation and dizziness (P = 0.005 and P = 0.047, respectively), showing small effect sizes (Cramer's V = 0.049 and 0.039, respectively). Other adverse events showed no significant differences. Figure 2 illustrates that despite changes in viscosity, the comfort score remains consistent. Results are detailed in Table 2.
 FIGURE 2:
 The impact of increased viscosity on peak pressure and comfort scores. This figure illustrates that despite changes in viscosity, the comfort score remains consistent. It is worth noting that the psi values are consistently low, well below the threshold of 325 psi, in all groups.
TABLE 2 - Comfort, Pain, and Adverse Events 370 mg I/mL Post Hoc Comparison Group 1–Group 2 300 mg I/mL Post Hoc Comparison Group 3–Group 4 Kruskal-Wallis Test Group 1 (37°C) n = 1507 Group 2 (Room Temperature) n = 1364 P Group 3 (37°C) n = 1301 Group 4 (Room Temperature) n = 1163 P H P Comfort (n = 5171), median (IQR) 2 (1–2) 2 (1–2) 1.000 2 (1–2) 2 (1–2) 0.072 7.640 0.054 Excellent, % 36.6% 34.7% 34.6% 38.3% Good, % 48.1% 49.2% 48.3% 48.2% Neutral, % 13.8% 14.5% 15.8% 12.4% Bad, % 1.3% 1.3% 1.0% 1.0% Very bad, % 0.2% 0.2% 0.2% 0.1% Pain (n = 5213), median (IQR) 0 (0–2) 0 (0–2) 1.000 0 (0–2) 0 (0–2) 1.000 2.536 0.469 No/mild (0–3), % 93.2% 93.2% 92.9% 92.5% moderate (4–6), % 5.8% 6.1% 6.7% 6.8% Severe (7–10), % 1.0% 0.7% 0.4% 0.7% Adverse events (n = 5335) Pearson χ2 Cramer's V P Contrast extravasation, % (n) 0.2% (3) 0.1% (1) 1.000 0.1% (1) 0.3% (3) 1.000 0.020 0.542 Allergic-like reaction, % (n) 0.4% (6) 0.3% (4) 1.000 0.8% (10) 0.3% (4) 0.966 0.028 0.253 Heat sensation, % 61.5% 65.8% 0.108 66.3% 67.7% 1.000 0.049 0.005* Odd taste, % 39.3% 42.3% 0.600 42.7% 43.1% 1.000 0.031 0.154 Dizziness, % 6.6% 7.3% 1.000 9.4% 7.9% 1.000 0.039 0.047† Nausea, % 3.2% 3.4% 1.000 4.5% 3.4% 1.000 0.028 0.248 Vomiting, % 0.5% 0.4% 1.000 0.7% 0.2% 0.324 0.028 0.248 Itchiness, % 1.3% 0.4% 0.108 1.0% 0.9% 1.000 0.032 0.140 Urticaria, % 0.3% 0.7% 0.816 0.4% 0.8% 1.000 0.027 0.270 Difficulty breathing, % 2.1% 1.6% 1.000 1.1% 1.5% 1.000 0.028 0.231 Shivering, % 1.0% 1.4% 0.325 0.6% 1.5% 0.216 0.032 0.143*Post hoc comparison showed significant difference between group 1 and group 3 (P = 0.048), and group 1 and group 4 (P = 0.006).
†Post hoc comparison showed significant difference between group 1 and group 3 (P = 0.042).
IQR, interquartile range.
The attenuation of the coronaries in CCTA scans was not significantly different among groups (H = 5.987, P = 0.113). Results indicated that there were significant differences in HU for portal venous CT scans (H = 11.785, P = 0.008) among the 4 groups with a mean HU for, respectively, groups 1, 2, 3, and 4 of 112.6, 111.7, 114.2, 114.5 HU (Table 3).
TABLE 3 - Attenuation (in Hounsfield Units) in CCTAs and Portal Venous CTs Group 1 (370 mg I/mL, 37°C) Group 2 (370 mg I/mL, Room Temperature) Group 3 (300 mg I/mL, 37°C) Group 4 (300 mg I/mL, Room Temperature) Kruskal-Wallis Test H P CCTA (n = 923) n = 208 n = 256 n = 257 n = 202 HU, mean (SD) 440.7 (78.7) 454.6 (90.1) 454.2 (79.5) 455.8 (88.5) 5.978 0.113 Portal venous CT (n = 2,697) n = 756 n = 684 n = 643 n = 614 HU, mean (SD) 112.6 (20.7) 111.7 (19.6) 114.2 (21.4) 114.5 (20.3) 11.785 0.008**Post hoc comparison showed significant difference between group 2 and group 3 (P = 0.025), and group 2 and group 4 (P = 0.018).
CCTA, coronary computed tomography angiography; HU, Hounsfield unit.
This study examined the impact of varying CM temperatures and concentrations on patient comfort, adverse events, and attenuation. Results demonstrated significant differences regarding heat sensation and dizziness, as well as attenuation of the liver in portal venous phase. However, differences among the 4 groups were small and deemed to be not of clinical relevance. Figure 2 demonstrates a clear impact of increasing viscosity on peak pressure, which is in line with previous research.26 Nonetheless, current study suggests that increasing viscosity does not have an impact on patient comfort. The study conducted over a 1-year period demonstrated that prewarmed CM, regardless of the CM concentration, does not outperform CM at room temperature concerning patient comfort and adverse events.
A large proportion of patients (65.1%) reported a heat sensation after CM injection, particularly when administered with a concentration of 300 mg I/mL as compared with 370 mg I/mL. Similarly, dizziness showed significant results, suggesting a decrease in feelings of dizziness when using high concentrated CM. Although these results are interesting, the observed effect sizes were small, indicating a negligible association. In addition, previous research found conflicting results examining the effect of CM viscosity on heat and pain sensation.20,22 Furthermore, these studies reported that the results that were significant, indicating that low concentrated CM is preferable over high concentrated CM in terms of pain and heat sensation, were small and not of clinical relevance. Hence, it is likely that differences in CM concentration do not have a significant impact on heat or pain sensation.
Nawras et al18 recently conducted a systematic review examining the effect of CM temperature in various concentrations of CM on rates of extravasation and allergic-like reactions. A total of 5 studies were included, containing a total of 307,329 patients. No evidence was found that prewarming CM reduces the number of extravasations, allergic-like reactions, or any other adverse events using less concentrated CM. In addition, highly concentrated prewarmed CM was shown nonsuperior compared with CM at room temperature in relation to extravasation rates. These results are in agreement with the present study. However, Nawras et al18 found that the number of allergic-like reactions was decreased by prewarming CM in case of high concentrations, which is not in line with the results of the current study. Nevertheless, 89.3% of the study population was composed of patients from the research conducted by Zhang et al,17 which strongly influenced the outcome of this systematic review. Zhang et al observed significant differences in the incidence of allergic-like reactions between CM administered at room temperature and prewarmed CM using highly concentrated CM, with a clear preference for prewarmed CM. Importantly, data were collected in 2 distinct hospital settings, with one using prewarmed CM while the other did not, which could have influenced the outcome.
Present results differ from the current European and American guidelines.27,28 Eliminating prewarming CM would simplify daily workflow, given that the need to store CM in ovens is no longer required. Moreover, it would contribute to a more environmentally friendly approach and will be financial beneficial.
This study included a large number of out-clinic patients. Furthermore, a diverse number of factors that could influence the choice for extrinsic warming of CM were investigated. In addition, as all out-clinic patients scheduled for a contrast-enhanced CT scan were asked to fill in the questionnaire, a diverse population was included.
This was a single-center study, with several other limitations. First, the mean values of the peak pressure range between 84.7 and 136.0 psi. Compared with the maximum peak pressure for the CT injector, which was set to 325 psi, this is still considerably low.31 Therefore, current study might not be applicable to centers that use higher peak pressures for their scans already. Second, there were significant differences in the IDR in CCTAs and dosing factor in portal venous CT among the 4 groups. This can be explained by slight scan and CM protocol adjustments during this 1-year period. The third noteworthy discussion point concerns the reliability of maintaining stable CM temperature. Ovens are used to achieve a temperature of 37°C, and the injector is equipped with a heater. Nonetheless, CM may experience a rapid decrease in temperature as it travels through the tubing, leaving the exact administration temperature unknown. Fourth, patients were asked to fill in a questionnaire directly after the CT examination. Although patients were asked to rate only comfort during CM administration, other experiences might also have been weighted up (eg, friendliness of the staff, room temperature, waiting time, pain experience during cannula insertion, etc). Fifth, participation was voluntary, and 59.1% of all patients who underwent a contrast-enhanced CT scan during the specified period completed the questionnaire. Reasons for not completing the questionnaire were not collected or reported due to patient privacy concerns, which potentially introduced a selection bias. Lastly, group 4 was relatively small compared with the other groups. This is most likely caused by staff reduction during summer holidays.
CONCLUSIONSThe current study showed in a large, diverse population that administrating prewarmed CM is nonsuperior regarding patient comfort and adverse events, regardless of CM concentration, compared with CM at room temperature. Current findings indicate that prewarming CM before usage is not required. This protocol adjustment is environmentally friendly and will improve daily clinical workflow.
REFERENCES 1. Rubin GD. Computed tomography: revolutionizing the practice of medicine for 40 years. Radiology. 2014;273(2 Suppl):S45–S74. 2. Garvey CJ, Hanlon R. Computed tomography in clinical practice. BMJ. 2002;324:1077–1080. 3. Booij R, Budde RPJ, Dijkshoorn ML, et al. Technological developments of x-ray computed tomography over half a century: user's influence on protocol optimization. Eur J Radiol. 2020;131:109261. 4. Lell MM, Kachelriess M. Recent and upcoming technological developments in computed tomography: high speed, low dose, deep learning, multienergy. Invest Radiol. 2020;55:8–19. 5. Solbak MS, Henning MK, England A, et al. Impact of iodine concentration and scan parameters on image quality, contrast enhancement and radiation dose in thoracic CT. Eur Radiol Exp. 2020;4:57. 6. Martens B, Jost G, Mihl C, et al. Individualized scan protocols in abdominal computed tomography: radiation versus contrast media dose optimization. Invest Radiol. 2022;57:353–358. 7. Fleischmann U, Pietsch H, Korporaal JG, et al. Impact of contrast media concentration on low-kilovolt computed tomography angiography: a systematic preclinical approach. Invest Radiol. 2018;53:264–270. 8. Buls N, Van Gompel G, Van Cauteren T, et al. Contrast agent and radiation dose reduction in abdominal CT by a combination of low tube voltage and advanced image reconstruction algorithms. Eur Radiol. 2015;25:1023–1031. 9. Martens B, Wildberger JE, Hendriks BMF, et al. A solution for homogeneous liver enhancement in computed tomography: results from the complex trial. Invest Radiol. 2020;55:666–672. 10. Overhoff D, Jost G, McDermott M, et al. Low kV computed tomography of parenchymal abdominal organs-a systematic animal study of different contrast media injection protocols. Tomography. 2021;7:815–828. 11. Hendriks BM, Kok M, Mihl C, et al. Individually tailored contrast enhancement in CT pulmonary angiography. Br J Radiol. 2016;89:20150850. 12. Mihl C, Kok M, Altintas S, et al. Evaluation of individually body weight adapted contrast media injection in coronary CT-angiography. Eur J Radiol. 2016;85:830–836. 13. Saade C, Chokr J, Naffaa L, et al. Reduced contrast volume and radiation dose during computed tomography of the pancreas: timing-specific contrast media protocol. Acad Radiol. 2019;26:480–488. 14. Martens B, Wildberger JE, Van Kuijk SMJ, et al. Influence of contrast material temperature on patient comfort and image quality in computed tomography of the abdomen: a randomized controlled trial. Invest Radiol. 2022;57:85–89. 15. Basharat NF, Ranganathan K, Kang PT, et
Comments (0)