
Remember me

The clinical importance of magnetic resonance imaging (MRI) in the assessment and disease monitoring of inflammatory arthritis has become very important, especially with the introduction of effective antirheumatic therapies.1,2 Magnetic resonance imaging has been shown to be highly effective in visualizing key indicators of inflammation, such as synovitis and osteitis, which are characteristic of early disease and predictive of progression.3–5 Standard imaging protocols typically include T1- and T2-weighted fat-suppressed spin-echo sequences and contrast-enhanced (CE) MRI to assess synovitis.6,7 Although gadolinium-based contrast agents are generally considered safe, there are limitations to their use. The use of these agents requires intravenous access and continuous physician monitoring during the MRI scan, resulting in increased costs and longer examination times. The administration of gadolinium-based contrast agents limits the use of MRI in patients with severely impaired renal function and in pregnant women. In addition, there are ongoing concerns about the clinical implications of gadolinium deposition, particularly in the context of additional screening for certain populations.8–10 As an alternative approach, previous studies have suggested the use of non-CE techniques such as fluid-attenuated inversion recovery sequence with fat saturation (FLAIR FS) and double inversion recovery (DIR) sequences to differentiate intra-articular fluid from synovial thickening as 2 distinct features of joint inflammation.11–13 Yoo et al12 examined 33 patients with a FLAIR FS sequence (of whom only 17 had knee synovitis) and demonstrated that the assessment of knee synovitis on a FLAIR FS sequence was comparable to a CE T1-weighted FS sequence. On the downside, the acquisition time of the FLAIR FS sequence was 4 minutes and 50 seconds compared with the CE T1-weighted FS sequence, which was 3 minutes and 50 seconds, which was an increase of 21% in scan time at comparable resolutions.
More recently, the application of deep learning (DL)–based image reconstruction has significantly accelerated MR acquisition and improved image quality.14–18 Deep learning enables robust reconstruction of high-quality images from undersampled k-space data using deep neural networks. Besides DL algorithms that perform image denoising and dealiasing in image domain, k-space to image space mapping algorithms reconstruct images directly from acquired k-space data. Hybrid solutions in k-space and image space have been proposed, for example, physics-based reconstructions combine traditional MR signal mapping with DL-based iterative optimization in the image domain.19 Using DL-based image reconstruction, Johnson et al14 demonstrated an almost 2-fold reduction in knee MRI scan time relative to a state-of-the-art data undersampling strategy (GRAPPA).14,20 Comparable results were demonstrated by Foreman et al21 who achieved a 47%–67% reduction in scan time using accelerated MRI of the ankle joint, as well as Kim et al17 who demonstrated similar results when comparing DL-enhanced 8-fold accelerated knee MRI to conventional 2-fold parallel imaging acquisition.
However, the question remains whether DL-based image acceleration can be effectively integrated into routine clinical practice. Therefore, the aim of this study was to assess the diagnostic value and accuracy of DL-accelerated FLAIR images acquired in patients with inflammatory knee synovitis.
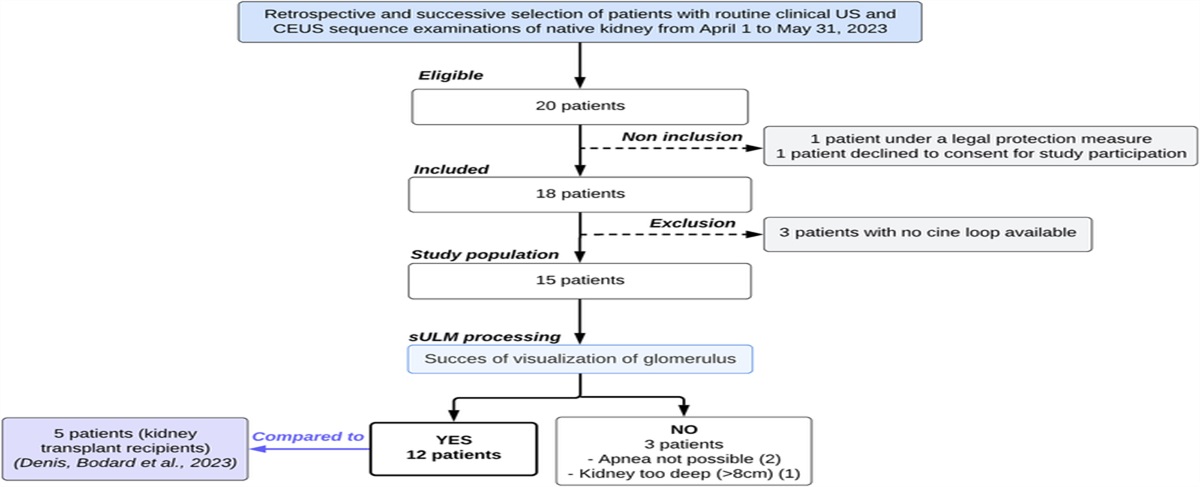
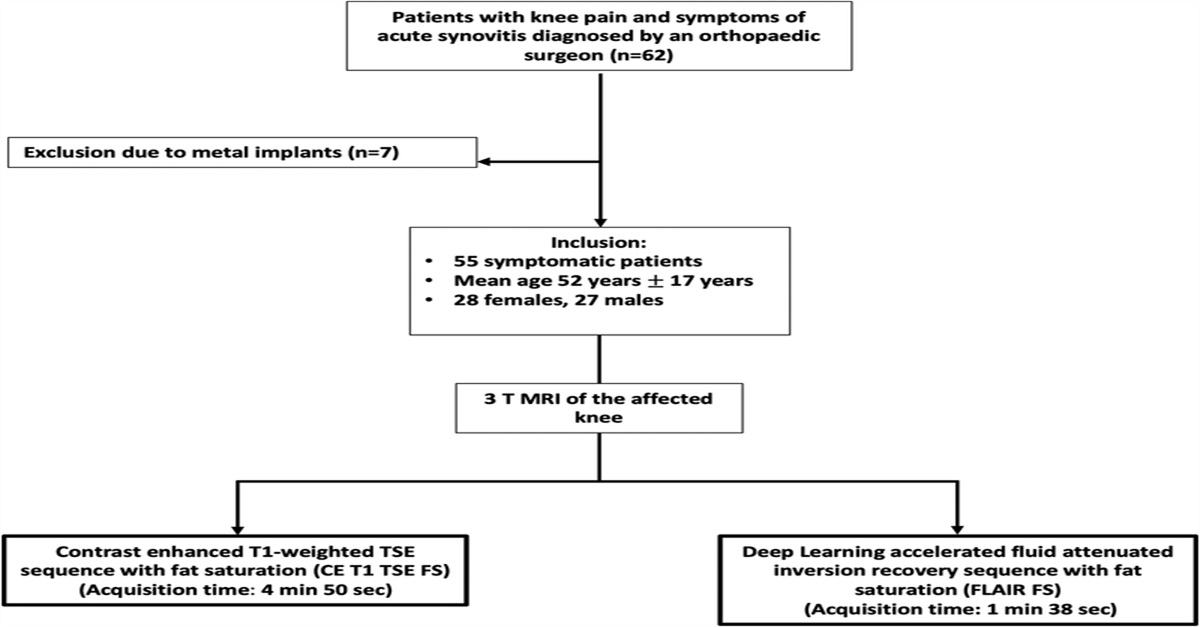
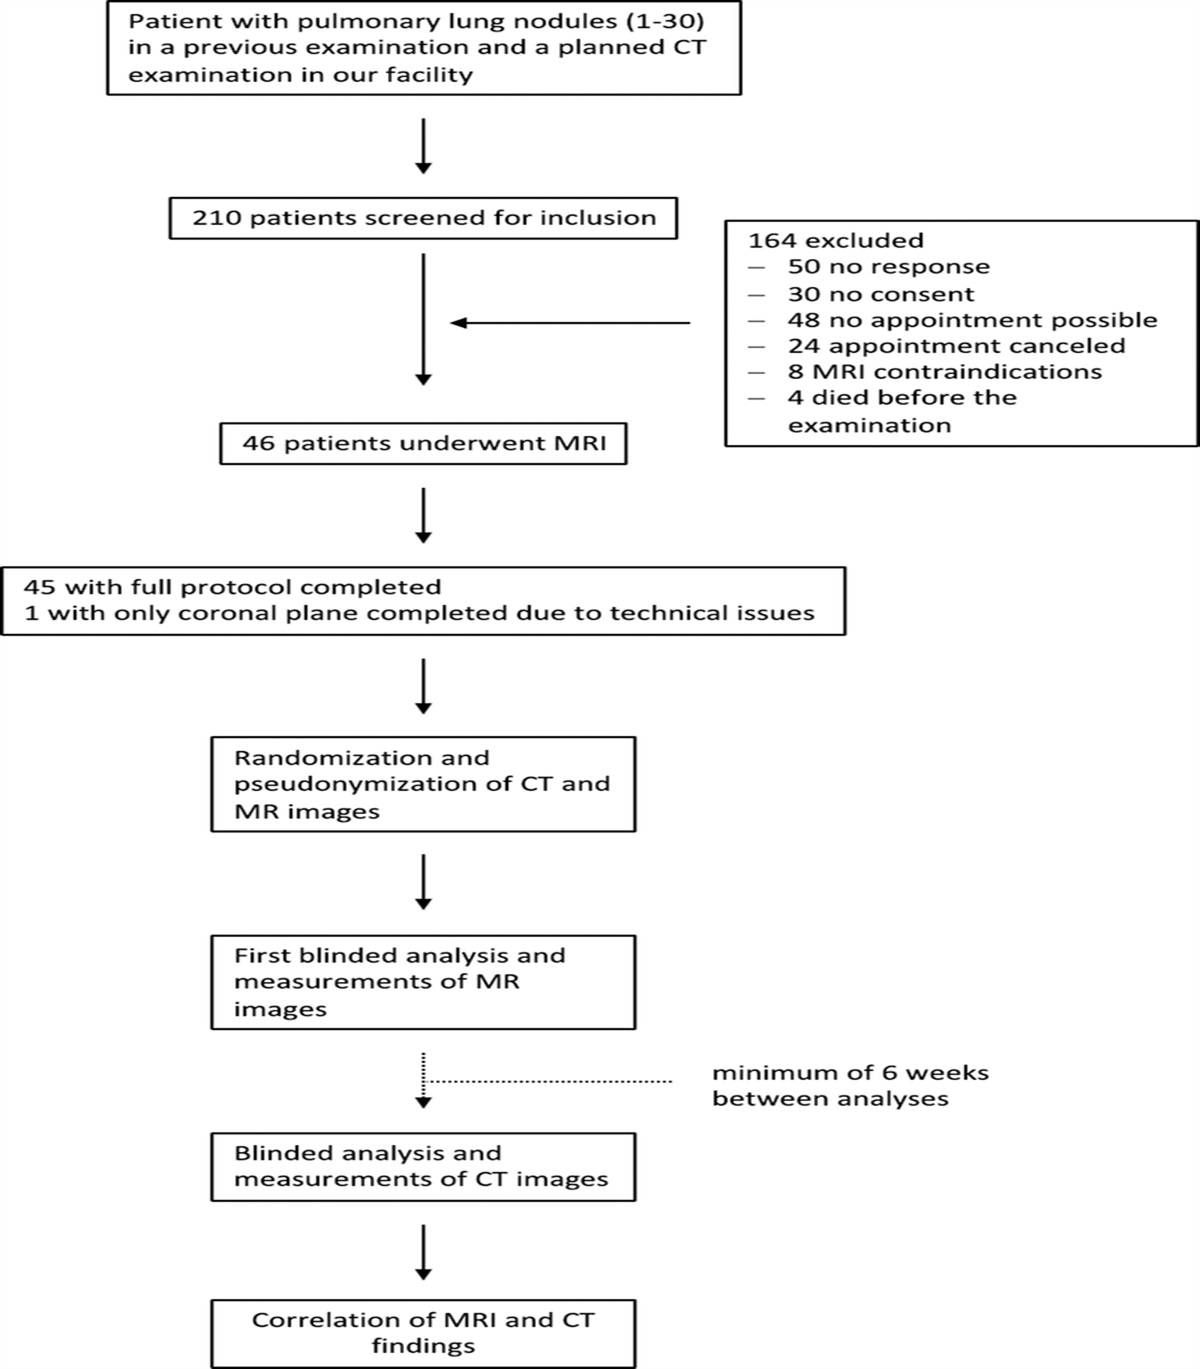
MATERIALS AND METHODS Study SamplePatients with acute knee pain and suspected knee synovitis who underwent routine MRI at our institution were retrospectively included between January and September 2023 (n = 55, Fig. 1). Symptoms included joint pain, swelling, stiffness, warmth, and redness of the knee. Diagnoses were made by orthopedic surgeons based on symptoms, as well as physical and clinical examination. Patients with previous knee surgery or metal implants were excluded from the present study (n = 7). The study was approved by our institutional review board Cantonal Ethics Committee Zurich. Before the MRI scan, all study participants gave written informed consent to participate in research studies and to have gadolinium contrast injected during the scan. To calculate the appropriate number of study participants, an a priori power analysis was performed. Using data from preceding studies, a sample size of at least 21 patients was calculated to detect differences in synovitis sum scores between the 2 imaging sequences with a power of 0.8, a type I error of 0.05, and an effect size of 0.56.12,13
 FIGURE 1:
 Patient selection flowchart for patients with symptomatic knee synovitis. All included patients received a 3 T MRI during the clinical workup including a deep learning–accelerated fluid-attenuated inversion recovery sequence with fat saturation (FLAIR FS).
Magnetic Resonance ImagingMagnetic resonance examinations of the knee were performed in a 3 T scanner (Magnetom Vida; Siemens Healthineers) with a dedicated 14-channel extremity coil. All patients received a routine knee imaging protocol including a transverse CE T1-weighted FS turbo spin-echo (TSE) sequence with the following parameters: TR, 755 milliseconds; TE, 10 milliseconds; readout bandwidth (Hz/Pixel), 180; slice thickness, 2.5 mm; field of view, 149 × 149 mm; state-of-the-art 2-fold undersampling (GRAPPA); and acquisition time, 4 minutes 50 seconds (Supplementary Table S1 and S2, https://links.lww.com/RLI/A903). For CE, an intravenous administration of 0.1 mmol/kg gadobutrol (Gadovist 1.0 mmol/mL, Bayer) was performed manually before the start of the sequence. In addition, a DL-enhanced and accelerated noncontrast FLAIR FS sequence was acquired before administration of the contrast agent with following parameters: TR, 6070 milliseconds; TE, 91 milliseconds; readout bandwidth (Hz/Pixel), 289; slice thickness, 2.5 mm; and acquisition time, 1 minute 38 seconds. The FLAIR FS sequence was also acquired in transverse orientation for optimal comparison.
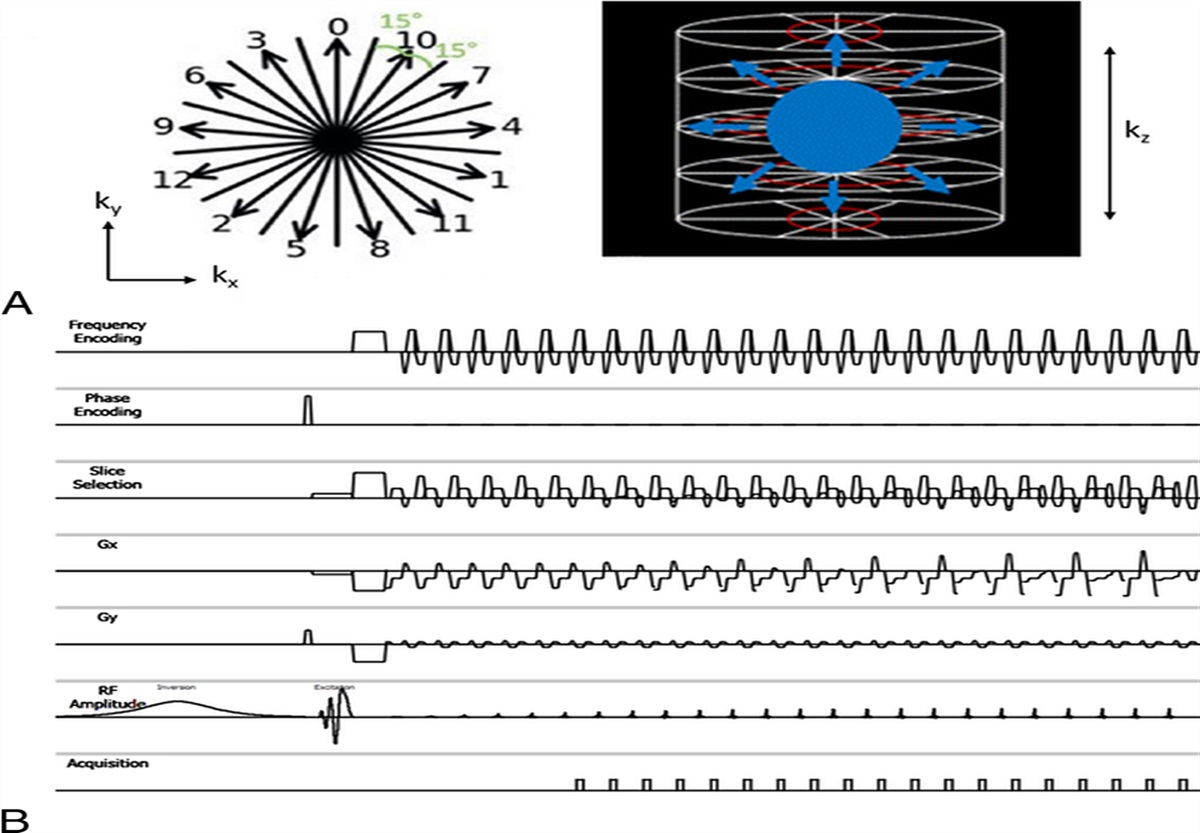
Data acquisition was accelerated by 4-fold Cartesian undersampling, and imaging data were reconstructed by 2 commercially available vendor-implemented DL algorithms (“Deep Resolve Sharp” and “Deep Resolve Boost”; Siemens Healthineers AG): image sharpness was improved by a dedicated edge enhancement technique, and aliasing artifacts were removed by a physics-based algorithm, known as “unrolled variational network.”22 To that end, data consistency was ensured in k-space, whereas the prior knowledge was a learned regularization in the image domain (iterative SENSE).23,24 The DL reconstruction follows an iterative SENSE approach with an interleaved data consistency term in k-space and a trained regularization in image space.23 An additional tunable hyperparameter in the sense of Tikhonov regularization determines the denoising strength. The convolutional neural network was trained on a pool of representative data of approximately 10,000 conventional TSE images from volunteers acquired on clinical 1.5 T and 3 T scanners, iteratively decreasing and increasing the resolution of the feature maps.25 Undersampled k-space data and conventionally estimated coil sensitivity maps derived from an integrated reference scan were used as input to the network.
Image AnalysisImage analysis was performed by 2 radiologists (G.F. and S.G.) in random order, independently and blinded to all clinical information, on a PACS (picture archiving and communication system) workstation certified for clinical use (MERLIN 7.1.22, Phönix-PACS GmbH).
To assess the degree of inflammation, the synovitis score, the effusion synovitis score, and the Hoffa inflammation score were determined on all the images. The synovitis score semiquantitatively assesses synovial thickness into grade 0 (<2 mm), grade 1 (2–4 mm), and grade 2 (>4 mm) at 9 different sites (the medial and lateral parapatellar recess, suprapatellar, infrapatellar, intercondylar, medial and lateral perimeniscal, and adjacent to the anterior and posterior cruciate ligaments). In addition, the medial and lateral peripatellar recess were scored as well and in contrast to the original score; in this study, grade 2 represented synovial thickness >4 mm and ≤5 mm, and an additional grade 3 was introduced to represent thickness >5 mm, as previously demonstrated.13,26 Sum scores representing the severity of whole knee synovitis were categorized as follows: 0–5 normal or equivocal; 6–9 mild; 10–13 moderate; and ≥14 severe synovitis. To differentiate between synovitis of the whole knee and Hoffa inflammation, the Hoffa fat pad was scored separately, and the degree of hyperintensity in the Hoffa fat pad was graded as 0 = normal, 1 = mild, 2 = moderate, and 3 = severe.27 The effusion-synovitis or joint effusion was graded on a scale of 0–3 in terms of the estimate of maximum distention of the synovial cavity.13,27
In addition to semiquantitative measures, both readers rated overall diagnostic confidence, image quality, and image artifacts on separate Likert scales. Image quality and overall diagnostic confidence were scored on a 4-point Likert scale, mainly assessing the overall diagnostic accuracy and appearance of an image: 1 (poor) definite diagnosis not possible due to major inhomogeneities; 2 (below average) assessment of major findings possible but still major inhomogeneities; 3 (good) adequate diagnosis possible, minimal to moderate inhomogeneities; and 4 (excellent) exact diagnosis possible without inhomogeneities. Image artifacts were also graded on a 4-point scale (1 = severe, 2 = moderate, 3 = few artifacts, 4 = no artifacts). Concomitant findings were assessed on the routine images and reported in Table 1.
TABLE 1 - Patient Characteristics Age, y* 52 ± 17 Male 27 Female 28 Degree of synovitis*† Patients (n) Normal (synovitis score: 0–5) 11 Mild (synovitis score: 6–9) 14 Moderate (synovitis score: 10–13) 13 Severe (synovitis score: >14) 17 Concomitant findings Cartilage defects 31 Meniscal tears 25 ACL degeneration 15 ACL tear 4 PCL degeneration 8 Scarring of collateral ligaments 8 Focal bone marrow edema 13 Baker cyst 9 Muscle edema 8*Data are given as mean ± standard deviation.
†Assessed with the modified whole knee synovitis score.13n = number of patients;
ACL, anterior cruciate ligament; PCL, posterior cruciate ligament.
For descriptive statistics frequency distributions and mean values were calculated. Comparisons of the semiquantitative scorings were performed with the Wilcoxon signed rank test. Interreader and intrareader agreement was assessed using weighted Cohen κ, and 95% confidence intervals were calculated for all measurements. The values were interpreted as follows: poor (0), slight (0.0–0.2), fair (0.21–0.40), moderate (0.41–0.60), substantial (0.61–0.80), and almost perfect (0.81–1.00).28 The paired t test was used to assess differences in synovial volumes on nonenhanced and CE images. Statistics were performed in SPSS (v. 28.0, IBM Corp), and all statistical tests were 2-sided, and a significance level (α) of 0.05 was used.
RESULTSIn total, 55 patients (mean age, 52 ± 17 years; 28 women) were included into the study. A total of 44 patients (80%) were diagnosed with inflammatory synovitis of the knee, of whom 27 patients (61%) were diagnosed with mild to moderate synovitis (synovitis score 6–13) and 17 patients (39%) with severe synovitis (synovitis score >14). Eleven patients (20%) did not demonstrate signs of inflammatory synovitis (synovitis score 0–5, Table 1). Using the CE T1 TSE FS sequence as a reference standard, the FLAIR FS sequence demonstrated a high sensitivity and specificity for the assessment of mild to moderate knee synovitis (reader 1: 85.7% sensitivity, 94.7% specificity; reader 2: 92.3% sensitivity, 95.0% specificity), as well as for severe knee synovitis (reader 1: 82.5% sensitivity, 84.0% specificity; reader 2: 86.7% sensitivity, 87.5% specificity).
Semiquantitative assessment of the whole knee synovitis score revealed no significant difference between the assessment on the DL-accelerated FLAIR FS sequence and the CE T1-weighted FS sequence (mean score FLAIR FS: 10.69 ± 8.83, CE T1 TSE FS: 10.74 ± 10.32; P = 0.521; Table 2, Figs. 2 and 3). Similarly, no significant differences were found when assessing the effusion synovitis score (mean scores: FLAIR FS: 2.18 ± 0.95, CE T1 TSE FS: 2.08 ± 1.07; P = 0.421) and the Hoffa inflammation score (mean scores: FLAIR FS: 1.62 ± 1.11, CE T1 TSE FS: 1.57 ± 1.08; P = 0.572; Fig. 4). The image quality of the DL-accelerated FLAIR FS sequence and the CE T1-weighted FS sequence was rated equally high for both sequences (mean quality: FLAIR FS: 3.38 ± 0.34, CE T1 TSE FS: 3.46 ± 0.49; P = 0.678), and no severe image artifacts were detected on any of the images (mean: FLAIR FS: 3.43 ± 0.48, CE T1 TSE FS: 3.51 ± 0.59; P = 0.418). Diagnostic confidence was rated slightly higher for the FLAIR FS images (mean: FLAIR FS: 3.89 ± 0.47, CE T1 TSE FS: 3.88 ± 0.54) but did not reach statistical significance (P = 0.521). In 6 of 55 patients (11%), slight signal inhomogeneities with loss of fat suppression were detected in the subcutaneous fat anteriorly and laterally, which did not interfere with diagnostic image quality or assessment of pathologies. Detailed information about the ratings of the whole knee synovitis score is listed in Table 3.
TABLE 2 - Comparison of Mean Knee Synovitis Assessments Measured on the DL-Accelerated FLAIR FS Sequence Compared With the CE T1 TSE FS FLAIR FS CE T1 TSE FS P Overall* Synovitis sum score† 10.69 ± 8.83 10.74 ± 10.32 0.521 Effusion synovitis score‡ 2.18 ± 0.95 2.08 ± 1.07 0.421 Hoffa inflammation score§ 1.62 ± 1.11 1.57 ± 1.08 0.572 Image quality∥ 3.38 ± 0.34 3.46 ± 0.59 0.678 Diagnostic confidence∥ 3.89 ± 0.47 3.88 ± 0.54 0.521 Image artifacts¶ 3.43 ± 0.48 3.51 ± 0.59 0.418*Data are given as mean ± standard deviation.
†Synovitis score: 0–5 normal or equivocal; 6–9 mild; 10–13 moderate; and ≥14 severe synovitis.
‡Effusion synovitis score: graded on a scale of 0–3 in terms of the estimate of maximum distention of the synovial cavity.
§Hoffa inflammation score: 0 = normal, 1 = mild, 2 = moderate, and 3 = severe.
∥Assessed on 4-point Likert scales: 1 = poor, 2 = below average, 3 = good, and 4 = excellent.
¶Assessed on a 4-point Likert scale: 1 = severe, 2 = moderate, 3 = few artifacts, and 4 = no artifacts.
 FIGURE 2:
 Axial 3 T MRI of a 52-year-old patient with inflammatory synovitis of the right knee. Because of the bright fluid signal on the axial standard proton density (PD)–weighted image (A), the synovial thickness cannot be reliably assessed. The deep learning–accelerated fluid-attenuated inversion recovery sequence with fat saturation (FLAIR FS, B) and the contrast-enhanced (CE) T1-weighted FS sequence (C) allow reliable assessment of the synovial lining. Note the hyperintense synovial thickening (circle) of the inflamed knee joint and the thin synovial lining of the Baker cysts dorsally (arrows).
 FIGURE 3:
 Comparison of an axial deep learning (DL)–accelerated fluid-attenuated inversion recovery sequence with fat saturation (FLAIR FS) (A) and an axial contrast-enhanced (CE) T1-weighted fat-saturated (FS) sequence (B) for the evaluation of acute synovitis of the left knee in a 57-year-old patient. Note the comparable hyperintense signal and the extent of the thickened synovial membrane (double-headed arrow, box). Using DL-based image acceleration, the FLAIR FS sequence was acquired in 1 minute and 38 seconds compared with the CE T1-weighted FS sequence, which was acquired in 4 minutes and 50 seconds, resulting in a 66% reduction in scan time.
 FIGURE 4:
 Axial 3 T MRI of a 46-year-old patient with mild synovitis of the knee (A–C) and severe synovitis of a 52-year-old patient (D–F). The standard axial proton density (PD)–weighted fat-saturated (FS) images (A and D) do not allow assessment of the synovial thickening (arrows) and signal enhancement that is shown on the deep learning (DL)–accelerated fluid-attenuated inversion recovery sequences with fat saturation (FLAIR FS) (B and E) and contrast-enhanced (CE) T1-weighted fat-saturated (FS) sequences (C and F). Note the equivalent presentation of the synovium on the DL-accelerated FLAIR FS and CE T1-weighted FS sequence.
TABLE 3 - Comparison of Mean Values of Total Knee Synovitis Score Measured on DL-Accelerated FLAIR FS Sequence Compared With CE T1 TSE FS Sequence Anatomical Regions Assessed With the Modified Whole Knee Synovitis Score† FLAIR FS CE T1 TSE FS Score* Score* P Medial parapatellar recess 0.92 ± 0.83 0.95 ± 0.81 0.321 Lateral parapatellar recess 1.05 ± 0.97 1.02 ± 0.94 0.921 Suprapatellar 0.89 ± 0.42 0.82 ± 0.92 0.491 Infrapatellar 0.72 ± 0.83 0.71 ± 0.94 0.875 Intercondylar 1.01 ± 0.73 1.02 ± 0.83 0.731 Medial perimeniscal 0.82 ± 0.45 0.87 ± 0.61 0.592 Lateral perimeniscal 0.97 ± 0.82 1.03 ± 0.76 0.731 Adjacent to ACL 1.04 ± 0.91 1.06 ± 0.89 0.661 Adjacent to PCL 1.06 ± 0.63 1.08 ± 0.53 0.551 Medial peripatellar recess 1.11 ± 0.54 1.13 ± 0.64 0.312 Lateral peripatellar recess 1.05 ± 0.41 1.04 ± 0.53 0.414 Sum score† 10.69 ± 8.83 10.74 ± 10.32 0.521*Data are given as mean ± standard deviation.
†Synovitis score: 0–5 normal or equivocal; 6–9 mild; 10–13 moderate; and ≥14 severe synovitis.13ACL, anterior cruciate ligament; PCL, posterior cruciate ligament.
To confirm the results, the assessments of the DL-accelerated FLAIR FS sequence and the CE T1-weighted FS sequence were compared for each reader and, once again, showed no significant difference in the semiquantitative and qualitative assessments (Table 4).
TABLE 4 - Comparison of Assessment of Knee Synovitis Using DL-Accelerated FLAIR FS Sequence Compared With CE T1 TSE FS Sequence for Each Reader FLAIR FS CE T1 TSE FS P FLAIR FS CE T1 TSE FS P Reader 1* Reader 2* Synovitis score† 10.36 ± 8.53 10.97 ± 8.77 0.496 11.03 ± 9.04 10.52 ± 8.65 0.792 Effusion synovitis score‡ 2.20 ± 1.03 2.08 ± 1.05 0.180 2.15 ± 0.89 2.08 ± 1.03 0.632 Hoffa inflammation score§ 1.65 ± 0.63 1.52 ± 0.68 0.086 1.59 ± 1.02 1.61 ± 1.03 0.534 Image quality∥ 3.39 ± 0.55 3.45 ± 0.61 0.285 3.36 ± 0.65 3.47 ± 0.54 0.132 Diagnostic confidence∥ 3.93 ± 0.31 3.91 ± 0.52 0.821 3.83 ± 0.66 3.85 ± 0.54 0.581 Image artifacts¶ 3.36 ± 0.61 3.45 ± 0.52 0.417 3.49 ± 0.45 3.55 ± 0.53 0.762*Data are given as mean ± standard deviation.
†Synovitis score: 0–5 normal or equivocal; 6–9 mild; 10–13 moderate; and ≥14 severe synovitis.
‡Effusion synovitis score: graded on a scale of 0–3 in terms of the estimate of maximum distention of the synovial cavity.
§Hoffa inflammation score: 0 = normal, 1 = mild, 2 = moderate, and 3 = severe.
∥Assessed on 4-point Likert scales: 1 = poor, 2 = below average, 3 = good, and 4 = excellent.
¶Assessed on a 4-point Likert scale: 1 = severe, 2 = moderate, 3 = few artifacts, and 4 = no artifacts.
Interreader agreement for the semiquantitative synovitis scores as well as for the qualitative assessment of the DL-accelerated FLAIR FS sequence and the CE T1-weighted FS sequence was excellent (range FLAIR FS: κ = 0.82–0.90, CE T1 TSE FS: κ = 0.84–0.96; Supplementary Table S3, https://links.lww.com/RLI/A903). Intrareader agreement for the semiquantitative synovitis scores was excellent to almost perfect (range reader 1: κ = 0.87–0.96, reader 2: κ = 0.86–0.94), similar to the intrareader agreement of the qualitative assessments (range reader 1: κ = 0.84–0.96, reader 2: κ = 0.83–0.97).
DISCUSSIONThis study shows that a fast DL-accelerated FLAIR FS sequence was equivalent to a CE T1-weighted FS sequence for the diagnosis of inflammatory synovitis of the knee. Semiquantitative assessments of total knee synovitis score, Hoffa inflammation score, and effusion synovitis score were comparable on the CE T1-weighted FS sequence and the DL-accelerated FLAIR FS sequence. There was no significant difference in image quality and diagnostic confidence between the 2 sequences.
The assessment of inflammatory knee synovitis is traditionally performed on CE T1-weighted images to improve the contrast of the inflamed and thickened synovium versus the adjacent joint effusion. One of the major disadvantages of this method is the intravenous administration of contrast agent. To address this issue, several noncontrast imaging approaches have been proposed previously.29–31 As one of the most promising approaches, the use of a FLAIR FS sequence for the assessment of synovitis in the knee has been implemented by Yoo et al.12 However, only 17 patients were diagnosed with acute synovitis in the reported cohort, and the long acquisition time due to the need for fluid signal nulling (4 minutes 50 seconds) limits its use for routine imaging. In general, FLAIR FS imaging improves the visibility of the synovium in the intra-articular space by suppressing the signals from both fluid and fat. The absence of fluid signal intensity increases the dynamic range for the remaining tissue on the images, allowing the use of narrower display windows, resulting in higher contrast.32 Treutlein et al13 have recently demonstrated the feasibility of the FLAIR FS sequence for the assessment of synovitis at 7 T. The semiquantitative and quantitative assessments of knee synovitis were comparable between the FLAIR FS sequence and the CE T1-weighted FS sequence, with a good interreader agreement. However, only 10 patients were included in the study, and both the use of 7 T and the scan time of 4 minutes 32 seconds limit its use for routine imaging.
In our study, the DL-reconstructed and accelerated FLAIR FS sequence was used during routine imaging, and we were able to collect a large cohort of patients (n = 55) with acute knee pain. This has allowed us to reliably demonstrate equivalent results for semiquantitative knee synovitis scoring on noncontrast FLAIR FS images and CE T1-weighted FS images in clinical routine. In addition, the use of a DL-based image acceleration significantly reduced the scan time, improving its applicability in routine MRI.
In consideration of recent technical developments, an alternative to additional sequences such as FLAIR FS or CE T1-weighted FS sequences may be the use of synthetic contrast.33 Several types of synthetic contrast have been proposed, based on either a mathematical image transformation approach, a physical signal model, or a data-driven approach. Based on a data-driven approach, recent studies demonstrated the feasibility to generate FS images from non-FS images as well as short tau inversion recovery images from multicontrast MR images using DL-based neuronal networks.34,35
Deep learning–accelerated image acquisition has become of increasing interest over the past few years due to its increasing reliability and general applicability for different organ systems and MRI applications.36–38 In a large cohort of 170 patients, Johnson et al14 recently demonstrated an almost 2-fold reduction in scan time for a complete routine knee MRI protocol using DL-based image reconstruction. In another study, Almansour et al15 introduced a DL-accelerated MRI protocol for spine imaging that reduced total scan time by up to 70%. The median scan time was reduced from 5 minutes 28 seconds for standard TSEs to 1 minute 40 seconds for DL-reconstructed TSEs. The FLAIR FS acquisition proposed in our study was also accelerated more than 2-fold compared with the state-of-the-art acceleration technique of the CE T1-weighted FS sequence, resulting in an acquisition time of only 1 minute and 38 seconds, which would be acceptable to add to routine imaging. It is well known that DL reconstruction can introduce image artifacts, such as banding artifacts, especially with higher acceleration factors and in regions of low signal-to-noise ratio in subsampled Cartesian images.39,40 However, these artifacts, which usually have a banding pattern aligned with the direction of phase encoding, may be rarely present in routine clinical imaging. In our study, we used an iPAT of 4. Therefore, no significant image artifacts were detected by either readers, and overall image quality was rated equally high on DL-accelerated FLAIRS FS images and CE T1-weighted FS images.
This study had some limitations that need to be addressed. Only patients with suspected inflammatory synovitis were assessed in this study. Because of the signal voids, loss of fat suppression, and signal loss, patients with previous surgery or implants were excluded from the study. Therefore, the use of the FLAIR FS sequence in postoperative patients with implanted orthopedic hardware may be limited compared with other types of fat suppression techniques, such as short-tau inversion recovery or Dixon sequences. However, the effect of metal implants on signal homogeneity should be evaluated in future studies. Slight signal inhomogeneities were also observed in the subcutaneous fat anteriorly or laterally, which did not affect the diagnostic image quality, but may also limit the use of FLAIR sequences compared with short-tau inversion recovery or Dixon imaging in terms of fat suppression. No histologic correlation was available for this study cohort, and the results are based solely on MR morphological assessment. In addition, the qualitative assessment of image features was done using Likert scales, which may be subject to bias due to individual reader preferences.
In summary, the assessment of inflammatory synovitis of the knee using a DL-accelerated and enhanced noncontrast FLAIR FS sequence was feasible and comparable to a CE T1-weighted FS sequence. In routine practice, this could be a useful alternative that would reduce the application of intravenous contrast agents as well as the total scan time.
ACKNOWLEDGMENTSThe authors thank Sabine Schrimpf for critical proofreading and language editing.
REFERENCES 1. Filippucci E, Di Geso L, Grassi W. Progress in imaging in rheumatology. Nat Rev Rheumatol. 2014;10:628–634. 2. Baker JF, Østergaard M, Conaghan PG. Is MRI a predictive biomarker for clinical response to biologics in rheumatoid arthritis? Ann Rheum Dis. 2017;76:e45. 3. Østergaard M, Hansen M, Stoltenberg M, et al. New radiographic bone erosions in the wrists of patients with rheumatoid arthritis are detectable with magnetic resonance imaging a median of two years earlier. Arthritis Rheum. 2003;48:2128–2131. 4. Baker JF, Conaghan PG, Emery P, et al. Validity of early MRI structural damage end points and potential impact on clinical trial design in rheumatoid arthritis. Ann Rheum Dis. 2016;75:1114–1119. 5. Østergaard M, Møller-Bisgaard S. Optimal use of MRI in clinical trials, clinical care and clinical registries of patients with rheumatoid arthritis. Clin Exp Rheumatol. 2014;32(5 Suppl 85):S-17-22. 6. Roemer FW, Kassim Javaid M, Guermazi A, et al. Anatomical distribution of synovitis in knee osteoarthritis and its association with joint effusion assessed on non-enhanced and contrast-enhanced MRI. Osteoarthr Cartil. 2010;18:1269–1274. 7. Crema MD, Roemer FW, Li L, et al. Comparison between semiquantitative and quantitative methods for the assessment of knee synovitis in osteoarthritis using non-enhanced and gadolinium-enhanced MRI. Osteoarthr Cartil. 2017;25:267–271. 8. Ramalho J, Semelka RC, Ramalho M, et al. Gadolinium-based contrast agent accumulation and toxicity: an update. AJNR Am J Neuroradiol. 2016;37:1192–1198. 9. Chung M, Calabrese E, Mongan J, et al. Deep learning to simulate contrast-enhanced breast MRI of invasive breast cancer. Radiology. 2023;306:e213199. 10. McDonald RJ, McDonald JS, Kallmes DF, et al. Intracranial gadolinium deposition after contrast-enhanced MR imaging. Radiology. 2015;275:772–782. 11. Son YN, Jin W, Jahng GH, et al. Efficacy of double inversion recovery magnetic resonance imaging for the evaluation of the synovium in the femoro-patellar joint without contrast enhancement. Eur Radiol. 2018;28:459–467. 12. Yoo HJ, Hong SH, Oh HY, et al. Diagnostic accuracy of a fluid-attenuated inversion-recovery sequence with fat suppression for assessment of peripatellar synovitis: preliminary results and comparison with contrast-enhanced MR imaging. Radiology. 2017;283:769–778. 13. Treutlein C, Bäuerle T, Nagel AM, et al. Comprehensive assessment of knee joint synovitis at 7 T MRI using contrast-enhanced and non-enhanced sequences. BMC Musculoskelet Disord. 2020;21:116. 14. Johnson PM, Lin DJ, Zbontar J, et al. Deep learning reconstruction enables prospectively accelerated clinical knee MRI. Radiology. 2023;307:e220425. 15. Almansour H, Herrmann J, Gassenmaier S, et al. Deep learning reconstruction for accelerated spine MRI: prospective analysis of interchangeability. Radiology. 2023;306:e212922. 16. Feuerriegel GC, Weiss K, Kronthaler S, et al. Evaluation of a deep learning–based reconstruction method for denoising and image enhancement of shoulder MRI in patients with shoulder pain. Eur Radiol. 2023;33:4875–4884. 17. Kim M, Lee SM, Park C, et al. Deep learning–enhanced parallel imaging and simultaneous multislice acceleration reconstruction in knee MRI. Invest Radiol. 2022;57:826–833. 18. Lin DJ, Walter SS, Fritz J. Artificial intelligence–driven ultra-fast superresolution MRI: 10-fold accelerated musculoskeletal turbo spin echo MRI within reach. Invest Radiol. 2023;58:28–42. 19. Gassenmaier S, Küstner T, Nickel D, et al. Deep learning applications in magnetic resonance imaging: has the future become present? Diagnostics (Basel). 2021;11. 20. Griswold MA, Jakob PM, Heidemann RM, et al. Generalized autocalibrating partially parallel acquisitions (GRAPPA). Magn Reson Med. 2002;47:1202–1210. 21. Foreman SC, Neumann J, Han J, et al. Deep learning–based acceleration of compressed sense MR imaging of the ankle. Eur Radiol. 2022;32:8376–8385. 22. Hammernik K, Klatzer T, Kobler E, et al. Learning a variational network for reconstruction of accelerated MRI data. Magn Reson Med. 2018;79:3055–3071. 23. Pruessmann KP, Weiger M, Börnert P, et al. Advances in sensitivity encoding with arbitrary k-space trajectories. Magn Reson Med. 2001;46:638–651. 24. Pruessmann KP, Weiger M, Scheidegger MB, et al. SENSE: sensitivity encoding for fast MRI. Magn Reson Med. 1999;42:952–962. 25. Gassenmaier S, Afat S, Nickel D, et al. Deep learning–accelerated T2-weighted imaging of the prostate: reduction of acquisition time and improvement of image quality. Eur J Radiol. 2021;137:109600. 26. Guermazi A, Roemer FW, Hayashi D, et al. Assessment of synovitis with contrast-enhanced MRI using a whole-joint semiquantitative scoring system in people with, or at high risk of, knee osteoarthritis: the MOST study. Ann Rheum Dis. 2011;70:805–811. 27. Hunter DJ, Guermazi A, Lo GH, et al. Evolution of semi-quantitative whole joint assessment of knee OA: MOAKS (MRI osteoarthritis knee score). Osteoarthritis Cartilage. 2011;19:990–1002. 28. Cohen J. Weighted kappa: nominal scale agreement with provision for scaled disagreement or partial credit. Psychol Bull. 1968;70:213–220. 29. de Vries BA, Breda SJ, Sveinsson B, et al. Detection of knee synovitis using non–contrast-enhanced qDESS compared with contrast-enhanced MRI. Arthritis Res Ther. 2021;23:55. 30. Jahng GH, Jin W, Yang DM, et al. Optimization of a double inversion recovery sequence for noninvasive synovium imaging of joint effusion in the knee. Med Phys. 2011;38:2579–2585. 31. Roemer FW, Guermazi A, Zhang Y, et al. Hoffa's fat pad: evaluation on unenhanced MR images as a measure of patellofemoral synovitis in osteoarthritis. AJR Am J Roentgenol. 2009;192:1696–1700. 32. Jackson A, Sheppard S, Johnson AC, et al. Combined fat- and water-suppressed MR imaging of orbital tumors. AJNR Am J Neuroradiol. 1999;20:1963–1969.
Comments (0)