
Remember me

Cardiac valve replacement is the mainstay of treatment for severe cardiac valve disease. The number of procedures is expected to increase mainly because of the higher prevalence of valvular pathology in the older population in developed countries1 and the broadening of valvular replacement indications in recent guidelines.2 After these procedures, patients will need to follow precautions and undergo life-long clinical, imaging, and biological surveillance. This is on the one hand to avoid systemic and prosthetic valve complications and on the other hand because the procedure will not allow for complete regression of the underlying valvular heart disease.2
Among complications of prosthetic heart valves (PHVs), infective endocarditis (IE) is one of the most difficult to diagnose and feared due to its very high mortality of up to 42%.3 Whereas the modified Duke's criteria are still the basis for the diagnosis of IE,4 in the last years, computed tomography (CT) (with or without associated positron emission tomography [PET]) has emerged as the imaging modality of choice to arbitrate the most difficult cases, where transthoracic echocardiography and transesophageal echocardiography are not sufficient.5 Other complications include thrombus and pannus formation. Differential diagnosis of these entities is difficult based on clinical data and echocardiography alone, and is often possible only thanks to the identification and characterization of PHV lesions with CT.2,6,7 Nevertheless, even with CT, valvular lesions might prove very difficult to detect as they are often small and image quality might be hampered by motion, metallic, and blooming artifacts.
Computed tomography systems equipped with photon-counting detectors (PCD-CTs) are emerging as a new technology expected to overcome many of the limitations of conventional CT for different clinical applications, including cardiac imaging. The first results in humans are very promising8–12 and confirm the expected advantages of PCD-CT, especially the improved spatial resolution. Whereas coronary stents have been studied with PCD-CT in different experimental settings13–15 and in humans,9 so far no data are available for PHVs. As for stents,14 PCD-CT could be used also for K-edge imaging of some specific valvular components. For instance, the leaflets of bileaflet metallic valves16 are the only part of these prosthesis that include tungsten. Therefore, K-edge imaging could help to reduce artifacts and improve visual dynamic assessment by depicting only the leaflets.
Therefore, in this study, we aimed to compare image quality of conventional and K-edge images of PHVs with spectral photon-counting CT (PCD-CT) and with dual-energy dual layer CT (DEDL-CT) regarding valve structures and simulated lesions in a phantom setting.
MATERIALS AND METHODSProsthetic heart valves of different types and sizes were scanned inside a thoracic phantom with and without simulated lesions. The acquisitions were performed on both a prototype of PCD-CT (Philips, Haifa, Israel) and a DEDL-CT (CT7500; Philips, the Netherlands). Acquisitions to test K-edge properties of PCD-CT were performed only on PCD-CT (as DEDL-CT does not allow for this type of imaging).
Set Up of the Phantom Valves 2 bileaflet metallic valves • hemodynamic Plus St Jude Medical (SJM) Masters Series Aortic Mechanical Heart Valve nominal size of 25 mm (SJM-s25) • hemodynamic Plus SJM Masters Series Aortic Mechanical Heart Valve nominal size of 17 mm (SJM-s17) 3 biological valves trifecta SJM Aortic Biological Heart Valve nominal size of 25 mm (Trifecta-s25) trifecta with Glide technology SJM Aortic Biological Heart Valve nominal size of 23 mm (Trifecta-s23) epic SJM Mitral Biological Heart Valve nominal size of 27 mm (Epic)Pictures of the aforementioned valves are provided in Figures 1A to E.
 FIGURE 1:
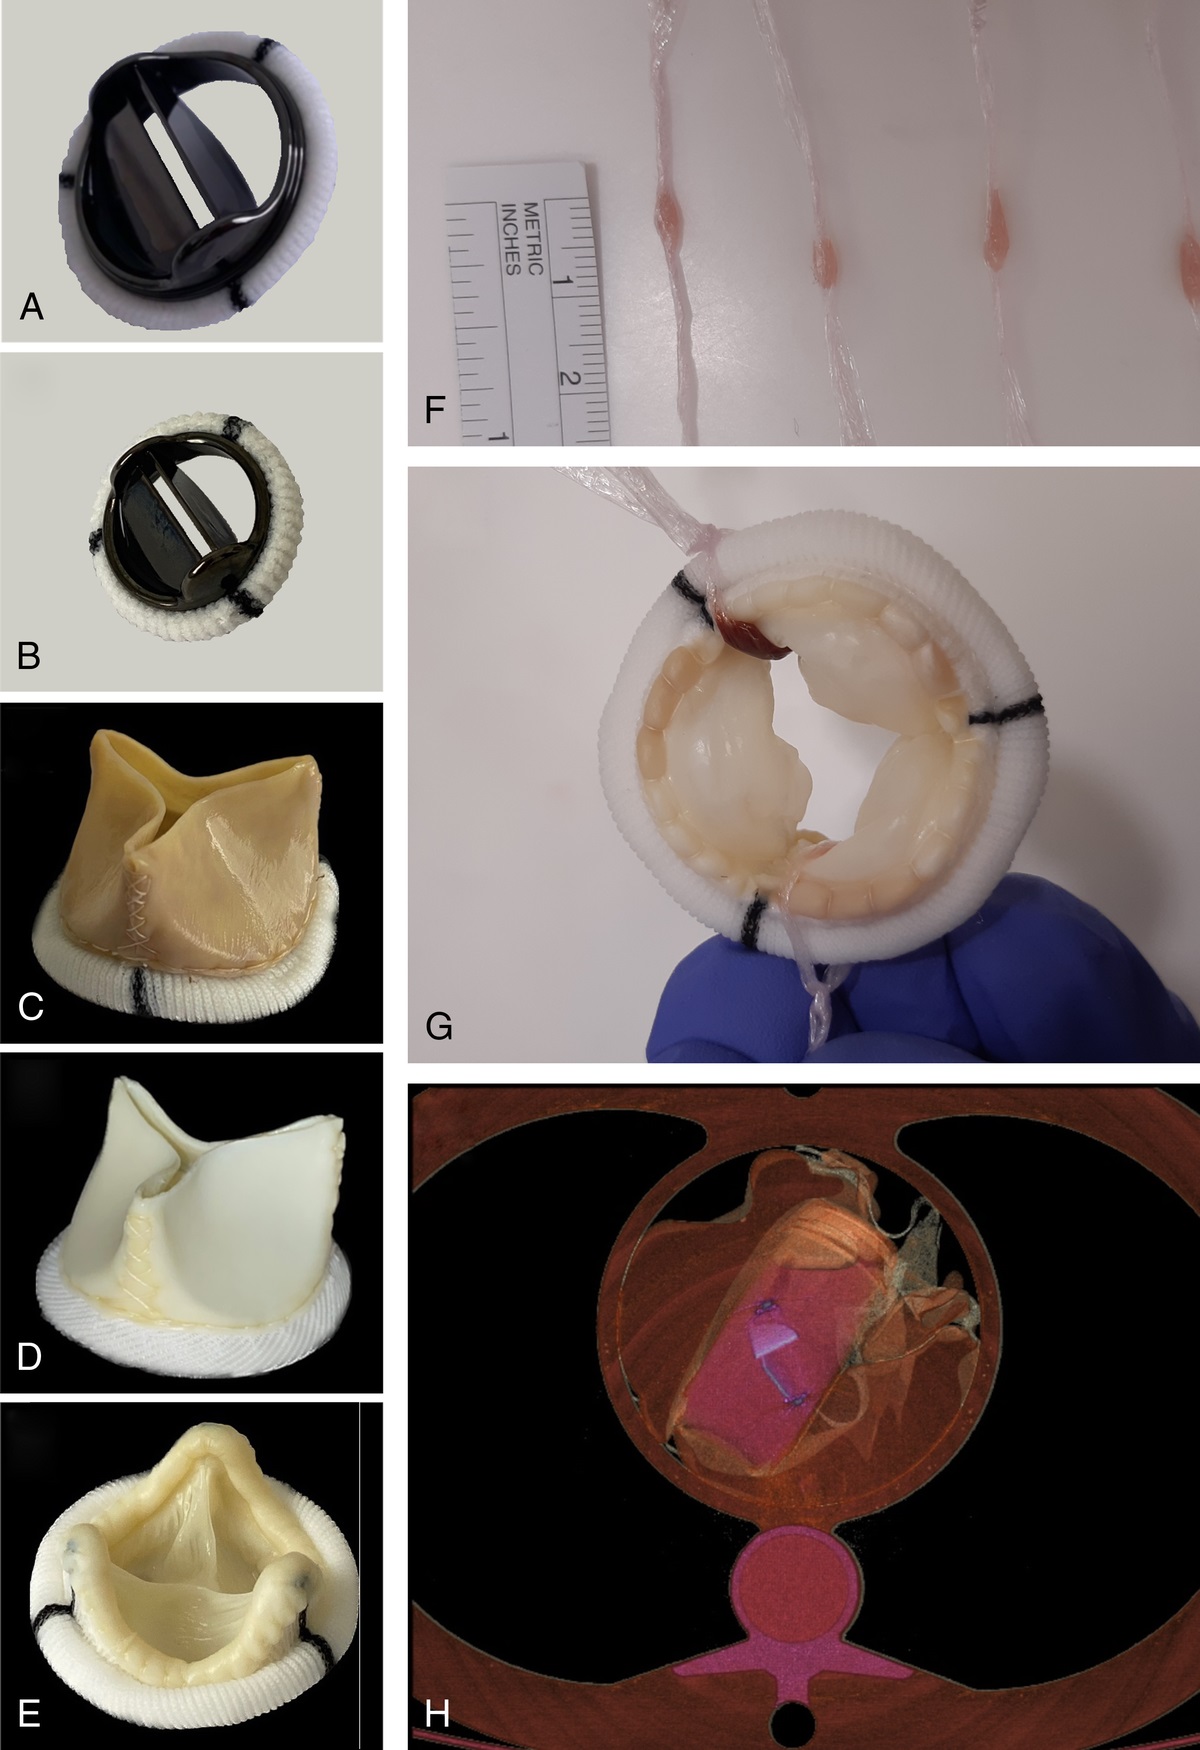
 A–E, Images show the 5 valves that were used for the experiments. A, Hemodynamic Plus St Jude Medical (SJM) Masters Series Aortic Mechanical Heart Valve nominal size of 25 mm (SJM-s25). B, Hemodynamic Plus SJM Masters Series Aortic Mechanical Heart Valve nominal size of 17 mm (SJM-s17). C, Trifecta SJM Aortic Biological Heart Valve nominal size of 25 mm (Trifecta-s25). D, Trifecta with Glide technology SJM Aortic Biological Heart Valve nominal size of 23 mm (Trifecta-s23). E, Epic SJM Mitral Biological Heart Valve nominal size of 27 mm (Epic). F, The preparation of the lesions in the transparent foil is shown. Notice their small dimensions. G, Image shows how the lesions were located inside the valves. Once the lesions inside the transparent plastic foil, this was tied with a knot around the structure of the valve to keep the lesion in place inside the valve and to separate it from the contrast media. H, A volume rendering of a PCD-CT acquisition illustrates the setup of the phantom: the valve (in blue) was placed inside a container containing diluted iodinated contrast media (in pink) that was surrounded by bags of saline solution (orange); all these items were placed inside a thoracic phantom.
Simulated LesionsTwo lesions were constructed by rolling either a small piece of cow muscle or some coagulated porcine blood in a piece of transparent foil (Fig. 1F). The lesions had a thickness of approximately 1.5–2 mm.
PhantomEach valve was placed in a tube containing diluted iodinated contrast (final density of ~350 HU; Iomeron 400, Bracco, Milan, Italy) inside an anthropomorphic thoracic phantom (QRM GmbH, Moehrendorf, Germany). The size of the thoracic phantom was 200 × 300 × 100 mm to which an extension ring (QRM) could be added (total size: 350 × 250 mm).
The space between the tube and the phantom was filled with bags containing saline solution.
The simulated “lesions” were placed inside the valve as illustrated in Figures 1G and H.
Electrocardiogram-GatingThe 2 CT systems were connected to an electrocardiogram simulator during all acquisitions. The selected heart rate was 60 bpm.
Acquisitions and Reconstructions PCD-CT and DEDL-CTEach valve was scanned 3 times at 3 different angles to the gantry (rotation of the tube containing the valve to simulate different orientations of the heart), without any lesions.
The smallest of the Trifecta valves, the 2 SJMs and the Epic, were each scanned 2 times, with and without ring extension, with the 2 small lesions (muscle and clot).
The lesions were left in place in the valve in the time elapsed between the acquisitions on the different CT scanners.
The acquisition parameters were kept constant for all acquisitions, whereas reconstruction parameters were dependent on the type of assessed parameters (Table 1).
TABLE 1 - Acquisition and Reconstruction Parameters Acquisition Parameters Conventional Images K-Edge Images DEDL-CT PCD-CT PCD-CT Collimation, mm 64 × 0.625 64 × 0.275 64 × 0.275 Tube voltage, kV 120 120 120 Tube current, mAs Targeting 255 255 255 Dose modulation DoseRight None None Rotation time, s 0.27 0.33 0.33 Pitch 0.16 0.32 0.32 Energetic levels 30, 51, 62, 72, 81 keV 30, 50, 60, 69, 80 keV Reconstruction Parameters Conventional Images K-Edge Images DEDL-CT PCD-CT PCD-CT FOV, mm 220 220 220 Matrix, pixels 512 × 512 1024 × 1024 512 × 512 and 1024 × 1024 Slice thickness, mm 0.67 0.25 0.25 Increment, mm 0.34 0.25 0.25 Voxel size, mm 0.625(z) × 0.43(x) × 0.43(y) 0.25(z) × 0.21(x) × 0.21(y) Depending on the matrix Kernel XCB and XCD Detailed 2 and Sharp Detailed 2 Iterative reconstruction iDose 3 iDose 6 iDose 6DEDL-CT, dual-energy CT; FOV, field of view; PCD-CT, spectral photon-counting CT.
Acquisition parameters were matched between the 2 scanners and based on previous works with the same CT systems for cardiac imaging in humans.9,12 The optimal usage-specific reconstructions parameters were decided in consensus by 2 radiologists with 30 and 10 years of experience in cardiovascular imaging (PD and SB) upon revisions of different examples.
The CDTI was of 25.7 mGy for all acquisitions with PCD-CT. With DEDL-CT, it was of 23.1 mGy and 34.8 mGy for all acquisitions without and with the extension ring, respectively.
PCD-CTTo test the K-edge properties of the PCD-CT, the 2 metallic valves (SJM-s25 and SJM-s17) were scanned in 2 positions inside the thorax phantom arranged as detailed previously. Before the acquisition, the 5 energetic bins of the PCD-CT were set to optimized values for the K-edge imaging of tungsten (that is at 69.5 keV), namely, 30, 50, 60, 69, and 80 keV. K-edge images were obtained with projection domain material decomposition into 3 basis materials (photoelectric-like, Compton scatter–like, tungsten K-edge) using a forward projection model, literature energy-dependent attenuation data, and a maximum likelihood based algorithm taking into account the Poisson noise distribution of the measured data.17,18
The other acquisition parameters were the same as for the previously described scans. The acquisition and reconstruction parameters are indicated in Table 1. A summary of all the performed acquisitions is provided in Table 2 together with more details regarding the inclination of the valves.
TABLE 2 - Summary of the Acquisitions Performed Acquisitions System Phantom Types of Valves Lesions Repetitions N Total Acquisitions Standard DEDL-CT, PCD-CT Standard All No 3 times per valve 15 × 2 CTs With lesions DEDL-CT, PCD-CT Standard SJM-s17, SJM-s25, Trifecta-s23, Epic Yes No 4 × 2 CTs With extension SJM-s17, SJM-s25, Trifecta-s23, Epic Yes No 4 × 2 CTs K-edge PCD-CT Standard SJM-s17, SJM-s25 No 2 times per valve 4 Total = 50 Inclination of the valves* RAO Cranial 13 (34) 6 (16)*The inclination of the valve was calculated taking for reference a plane passing through and parallel to the metallic ring of the valves. Thereafter, the inclination of this plane was calculated in terms of right/left anterior oblique and cranial/caudal inclination. To calculate the median, the left and the caudal angles were expressed as negative values and only the right anterior and cranial values are presented. Values are expressed as median (interquartile range).
RAO, right anterior oblique.
The thickness of the 2 metallic rings of the metallic valve and of the metallic ring of the biological valves were calculated as the difference of their internal and external diameters. The height of the metallic rings as well as the thickness, height, and width of the metallic leaflets were calculated directly on the images (Figs. 2A1 to C3). Images reconstructed with a Sharp kernel were used for this purpose. These measurements were performed by 1 observer with 10 years' experience in cardiovascular imaging (SB). To account for the different materials, attenuations, and kernels, window level and width and other visualization parameters could be adjusted as desired.
 FIGURE 2:
 PCD-CT maximum intensity projections (MIPs) reconstructions of a SJM-s25 valve with 1 open and 1 close leaflet as seen on a cross-sectional plane parallel to the external rings (A1) and on 2 planes perpendicular to the external rings (B1 and C1, perpendicular and parallel to the long axis of the leaflets, respectively) were used to illustrate the different components of the valves (colored contours in A2, B2, C2) and how these structures were measured (yellow lines in A3, B3, C3). In D, illustration of the volumes used to measure dark streak artifacts on multiplanar (D1) and MIP (D2) reconstructions.
Blooming artifacts were calculated based on an already published formula19: blooming = ([measured outer stent diameter − measured inner stent diameter]/measured outer stent diameter) × 100%. Results of these measurements were compared between CT systems.
Volumetric Analysis of Metallic ArtifactsSix parallelepipeds of 3 × 3 × 6 mm per metallic valve were drawn, 3 per side of the valve (Fig. 2D). The voxels contained in these volumes with a density <3 times the standard deviation (SD) of the contrast media in the tube were considered as an estimate of dark streak artifacts.20
Subjective AnalysisFor subjective analysis, 3 observers with 30 years, 10 years, and 6 months of experience in cardiovascular imaging (PD, SB, CM) independently scored all the acquisitions. The valves with and without lesions were assessed with a 4-point scale regarding conspicuity and sharpness of the different parts of the valve (metallic leaflets, biological cusps, inner and outer metallic ring) and of the lesions: 1 = the target structure is not visible, poor image quality; 2 = the target structure is visible with difficulty, acceptable image quality; 3 = the target structure is visible, good image quality; and 4 = the target structure is well and sharply visible, perfect image quality. In addition, image quality regarding metallic and blooming artifacts were scored: 1 = very important artifacts limiting the interpretation; 2 = moderate artifacts limiting the interpretation; 3 = some artifacts without repercussion on the diagnostic character of the scan; and 4 = no artifacts. These scales were based on the review of the images of some preparatory experiments and agreed upon by the 3 observers before the scoring. Each acquisition was scored independently from the others, and the observers were blinded to the type of the CT system. For subjective analysis, the kernel, the window levels, and other visualization parameters were freely chosen by the observers.
Statistical AnalysisStatistical analysis was carried out with SPSS, version 21 (IBM, Massachusetts). Unless specified otherwise, ordinal and quantitative variables are presented as average ± standard deviation or as median (interquartile range [IQ]) depending on the respect of normal distribution or not. Paired t test or Wilcoxon test was used to compare measurements and scores between CT systems. These comparisons were performed separately without any further correction in this exploratory study where the interest was focused on the pair-wise comparison of the 2 CT systems. Frequencies were compared with the χ2 test. A P value <0.05 was considered as significant.
RESULTS Objective AnalysisWhile calculating objective parameters, it was noticed that some structures were very difficult to visualize, and thus to measure, with DEDL-CT. This was true for the internal ring of the metallic valves, especially in its thinner part. Therefore, only data about its thicker part, where the leaflets are attached (pivot point), could be compared between both scanners. Even at the pivot point, only the height could be compared between CTs because, on DEDL-CT, measurements of diameters were hampered by blooming artifacts from the external ring. For Trifecta-s23, it was not possible to discern the 2 metallic rings with DEDL-CT so that no comparison can be provided between the 2 systems. For components assessable with both CT systems, the objective analysis showed that with PCD-CT valvular metallic rings and metallic leaflets were thinner and with less blooming (all Ps < 0.05). The height of the outer ring of metallic valves, of the metallic ring of biological valves, and of the metallic leaflets were also shorter with PCD-CT (all Ps < 0.05). Other dimensions, such as the height of the internal ring of the metallic valves at the pivot point as well as the width of the 2 leaflets were similar with the 2 systems (P = 0.6, P = 0.29, P = 0.25, respectively). Measures of components per valve type are reported in Table 3.
TABLE 3 - Dimension and Blooming Artifact Measurements for Metallic Valvular Structures DEDL-CT PCD-CT SJM-s25 External ring Thickness, mm 4.93 ± 0.57 3.27 ± 0.31 Blooming, % 16.19 ± 1.79 11.00 ± 1.02 Height, mm 2.97 ± 0.06 2.40 ± 0.00 Internal ring Height (pivotal point), mm 12.00 ± 0.20 11.40 ± 0.00 Leaflet 1 Thickness, mm 1.37 ± 0.21 1.13 ± 0.06 Height, mm 13.47 ± 0.23 13.13 ± 0.58 Length, mm 23.43 ± 0.49 23.57 ± 0.12 Leaflet 2 Thickness, mm 1.4 ± 0.50 1.13 ± 0.06 Height, mm 13.77 ± 0.41 13.37 ± 0.06 Length, mm 23.40 ± 0.44 23.30 ± 0.10 SJM-s17 External ring Thickness, mm 5.57 ± 1.07 3.17 ± 0.06 Blooming, % 27.01 ± 4.65 16.27 ± 0.25 Height, mm 3.20 ± 0.10 2.50 ± 0.10 Internal ring Height (pivotal point), mm 8.13 ± 1.07 8.33 ± 0.15 Leaflet 1 Thickness, mm 1.47 ± 0.06 0.77 ± 0.06 Height, mm 8.60 ± 0.10 7.93 ± 0.12 Length, mm 13.80 ± 0.53 13.07 ± 0.06 Leaflet 2 Thickness, mm 1.50 ± 0.10 0.63 ± 0.06 Height, mm 8.60 ± 0.26 7.97 ± 0.15 Length, mm 13.53 ± 0.25 13.20 ± 0.10 Trifecta-s23 NA* NA* Trifecta-s25 Thickness, mm 4.93 ± 0.57 3.27 ± 0.31 Blooming, % 16.19 ± 1.79 11.00 ± 1.02 Epic Thickness, mm 3.00 ± 0.30 1.67 ± 1.50 Blooming, % 10.76 ± 1.06 6.15 ± 0.55Notes: Data are presented as average ± standard deviation in all cases due to the difficulty to ascertain the distribution in groups with a small number of effectives.
*No data are presented for Trifecta-s25 due to the impossibility to discern the 2 metallic rings with DEDL-CT.
With 11% (IQ = 15) versus 38% (IQ = 9) of voxels representing black streak artifacts, metallic artifacts were also reduced with PCD-CT (P < 0.01) (Supplemental Material Figure S1, https://links.lww.com/RLI/A905).
Subjective Analysis Valvular StructuresFirst of all, subjective analysis showed that some structures were visible only with PCD-CT, namely, the leaflets of the Trifecta-s25 (Fig. 3). In addition, the inner ring of the SJM-s17 was visible only with PCD-CT (Fig. 4).
 FIGURE 3:
 Corresponding images of 2 biological valves (A1–B3 show Trifecta-s23; C1–D3 show Trifecta-s25) obtained with DEDL-CT (A1–A3 and C1–C3) and PCD-CT (B1–B3 and D1–D3). Panels A, B, C1–C2, D1–D2 are volumetric renderings at different angles showing the metallic structure of these valves. Please notice how with DEDL-CT this structure looks thicker and of different colors, reflecting the different attenuation values, due to blooming artifacts. In addition, only with PCD-CT the 2 external rings of the Trifecta-s23 (B1, arrow) and details of the extremities of the structure of both valves (B2, D2, arrowheads) are visible. Multiplanar images (C3 and D3) (reconstructed with 1 mm thickness) show how the biological leaflets of the valves are visible with PCD-CT (D3, arrowheads) but not with DEDL-CT.
 FIGURE 4:
 Corresponding images of the 2 mechanical valves (A1–B5 show SJM-s25; C1–D3 show SJM-s17) obtained with DEDL-CT (A1–A5 and C1–C3) and PCD-CT (B1–B5 and D1–D3). Multiplanar reconstructions on 3 planes (A1–A3, B1–B3 and C1–C3, D1–D3) demonstrate the reduction of blooming artifacts with PCD-CT. Blooming artifact reduction combined with the higher spatial resolution of PCD-CT allows, for instance, to clearly see the internal ring of the SJM-s25 (B, arrowheads). The internal ring can be distinguished from the external ring, also on the SJM 17 mm (D, arrowheads), albeit with more difficulty than for the larger valve. On the contrary, this same structure is very hard to see (SJM-s25) and not visible (SJM-s17) with the DEDL-CT system. Volume rendering reconstructions (A4–A5, B4–B5) of the 2 valves also illustrate the reduction of blooming artifacts obtained with PCD-CT (represented by the thickness of the blue part of the valve) as well as the better definition of the internal ring (that is, the white yellowish part of the valves) thanks to the better separation and homogeneity of attenuation values of the 2 rings.
Furthermore, PCD-CT yielded better scores for the conspicuity and for the sharpness of all structures (all P's < 0.05) (Fig. 5 and Supplemental Material Figure S2, https://links.lww.com/RLI/A906). The only exceptions were the leaflets of the biological valves, scoring very low on both systems as they were not detectable for the Trifecta-s23 with either CT system and detectable only with PCD-CT for the Trifecta-s25 (1 [IQ = 0] vs 1 [IQ = 1] for DEDL-CT and PCD-CT, P = 0.1).
 FIGURE 5:
 Bar graphs of subjective scores regarding conspicuity (A) and sharpness (B) of different part of the valves on PCD-CT and DEDL-CT as well as subjective score of image quality regarding metal and blooming artifacts (C) on the 2 systems.
Both blooming and streak artifacts were reduced with PCD-CT (P ≤ 0.01) (Fig. 5 and Supplemental Material Figure S2, https://links.lww.com/RLI/A906).
LesionsOverall, the use of PCD-CT resulted in better conspicuity and sharpness (2 [IQ=2] and 2 [IQ=2], respectively) of the lesions as compared with DEDL-CT (2 [IQ = 2] and 1 [IQ = 1], respectively) with both Ps < 0.02 (Fig. 6). However, it should be noticed that also with PCD-CT the scores remained low, at the limit of the detectability for conspicuity.
 FIGURE 6:
 In A1–A3 and B1–B3, examples of the 2 lesions in a SJM-s25 as imaged with DEDL-CT (A1–A3) and PCD-CT (B1–B3). The lesions (arrowheads) are clearly visible only with PCD-CT in both the multiplanar image parallel passing through the external rings (B1) and those perpendicular to the ring (B2 and B3). The window levels are different from one panel to the other since they have been adapted to highlight the lesions, consistently with our methodology and clinical routine. In C and D, graphs showing the percentage of each level of subjective score for conspicuity (C) and sharpness (D) of the lesions on DEDL-CT and PCD-CT.
When looking at performances for single lesions, PCD-CT resulted in improved sharpness of 1 lesion (2 [IQ = 2] vs 1 [IQ = 1]).
Overall, adding the extension ring resulted in worse perceived conspicuity and sharpness of the lesions (2 [IQ = 1] vs 3 [IQ = 2] and 1 [IQ = 1] vs 2 [IQ = 2], P < 0.01). On the 2 CT systems combined, subjective scores = 1 amounted to 42% versus 29% for conspicuity and 75% versus 41% for sharpness for acquisitions with versus without extension ring, respectively. When looking more specifically for differences between the 2 scanners, adding the extension ring resulted in reduced conspicuity and sharpness for 1 lesion with DEDL-CT (P = 0.04, P = 0.02) and only in reduced sharpness with PCD-CT (P = 0.04).
Only with PCD-CT differences between the 2 lesions were subjectively judged as detectable (P < 0.05). Nevertheless, even with PCD-CT, hardly any difference was noticeable (median = 1, IQ = 0).
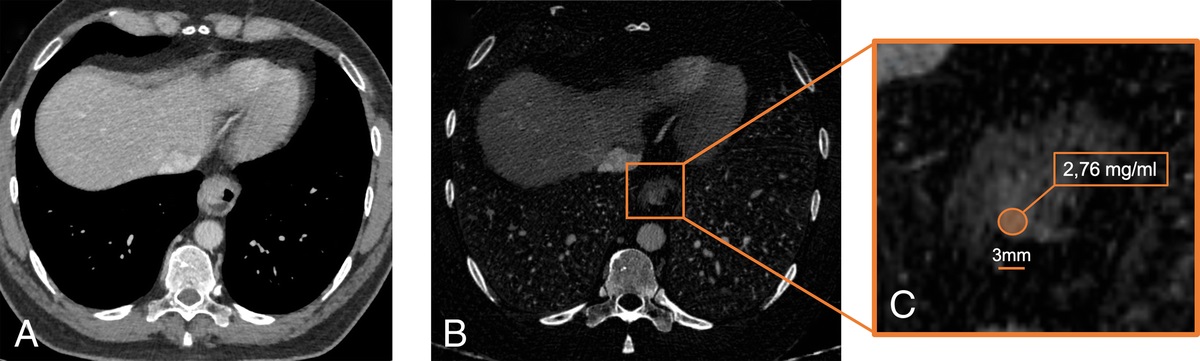
Tungsten K-Edge ImagingTungsten K-edge imaging allowed for the visualization of the only dense structure containing it, the leaflets of metallic valves (median = 4, IQ = 0) (Fig. 7). The leaflets appeared sharper on tungsten K-edge images than on DEDL-CT images (4 [IQ = 1] vs 3 [IQ = 1]; P < 0.001), but they demonstrated similar conspicuity and sharpness as compared with PCD-CT (all Ps > 0.05). Nevertheless, tungsten K-edge was judged presenting better image quality regarding blooming (4 [IQ = 0.8] vs 3 [IQ = 1] vs 2 [IQ = 2]; all Ps < 0.05) and metallic (3.5 [IQ = 1] vs 3 [IQ = 1] vs 2 [IQ = 1]; all Ps < 0.05) artifacts as compared with both conventional PCD-CT and DEDL-CT images.
 FIGURE 7:
 MIP reconstructions of a SJM-s25 valve with conventional (A) and tungsten K-edge (B) imaging obtained with PCD-CT. In B, as expected, solely the leaflets of the valve are visible as they are the only structures of the valve that are coated with tungsten.
DISCUSSIONFirst of all, in our study, we found that some PHV components are only visible and/or assessable with PCD-CT as opposed to DEDL-CT. Valvular metallic parts that could be compared between DEDL-CT and PCD-CT were thinner with PCD-CT. In addition, with PCD-CT, they received higher scores regarding subjective conspicuity and sharpness, with the exception of the metallic leaflets that received high scores with both CT systems. With PCD-CT, blooming and metallic artifacts were reduced both objectively and subjectively. Conspicuity and sharpness of millimetric lesions were improved with PCD-CT notwithstanding the low scores with both CT scanners. Tungsten K-edge allowed the detection of only the leaflets of metallic valves, which contain this material, and further reduction of blooming and metallic artifacts.
With its specific features, PCD-CT is proving capable of overcoming some of the limitations of CT imaging. Several in vitro and animal studies have proven that blooming artifacts of very dense structures such as stents and calcifications are reduced by PCD-CT.14,15,21 These findings were confirmed more recently in vivo as well.9–11,22 In particular for stents, artifact reduction allows for improved depiction of the structure of the stent, better visualization of the lumen, easing the detection of restenosis, and assessment and characterization of the surrounding tissues, including calcifications.9,14,23 These clinical benefits have been attributed, among others, to the improved spatial resolution of PCD-CT that allows obtaining images with almost isotropic voxels of ~0.25 mm with a large matrix of 1024 × 1024 and sharp kernels to take advantage of these features. In the present study, we have demonstrated improvements of image quality with PCD-CT also for PHV.
In fact, the structure of the valves is better identifiable and measurable with PCD-CT. Most interestingly, with PCD-CT, we could detect and see more clearly some structures that were either invisible or very difficult to see with DEDL-CT. In addition, PCD-CT offered a gain for the detection of millimetric valvular lesions. Although the absolute values of subjective scores are still far from excellent even with PCD-CT, they are clearly better compared with DEDL-CT. It should be kept in mind that CT is 1 of the 2, if not the only, noninvasive imaging modality that can depict any such lesion in patients with PHVs. In addition, complications of PHV carry a high mortality rate, especially IE,3,24,25 and should be detected promptly and with high specificity since each pathology requires appropriate treatment.2 Considering all these elements, it is clear that improvements in CT image quality may have a very important impact in clinical practice.
A peculiarity of cardiac valve pathology is that lesions can have repercussions on the function of the valve itself. Therefore, besides the direct visualization and characterization of lesions, it is important to verify the dynamics of the components of the valve. Exactly for this purpose, the leaflets of mechanical valves are made also with tungsten, which, being radiopaque, allows for the assessment of valve motion with x-rays.16 This can be done with either fluoroscopy, obtaining 2D images that do not convey any information regarding the lesions, or CT.26 With the latter, both morphological and dynamic 3D information are available with retrospectively electrocardiogram-gated acquisitions. Nevertheless, metallic artifacts can hamper correct interpretation of these examinations, impeding not only a fine analysis but sometimes even the mere visualization of valvular structures. In this context, K-edge imaging of tungsten, which is imaging only the leaflets, seems a promising feature. K-edge imaging is possibly the most novel feature of PCD-CT as it allows for specific visualization and quantification of specific materials.18,27,28 The projection-based 3 material decomposition technique used by the prototype used in this paper17,18 should be differentiated from other approaches. The latter are image-based and use 2 material decomposition to separate the behavior of contrast media from that of adjacent tissues so that all structures in the voxels are imaged albeit with different relative attenuation.29 The projection-based technique has been tested in various experimental conditions, in most of which the K-edge element to explore was injected as a contrast media.8,27 Depending on the K-edge element, different aspects were investigated: for instance, gadolinium-based contrast media were used for CT angiography,30 and gadolinium- and iodine-based contrast media were injected at different moments for the exploration of endoleaks.31 In the case of metallic prosthetic valves, an element already present in the body of the patient (albeit exogenous) can be selectively imaged. In this study, we have shown that, as expected, only the leaflets of metallic valves are visible on tungsten K-edge images. This might allow for easier detection of valvular dysfunction in humans due to the absence of potentially confusing motion artifacts of the rings in the field of view. Very importantly, although for K-edge imaging, the energy bins of the PCD-CT have to be adjusted for specific K-edge values, also conventional images and other spectral images can be reconstructed from the same acquisition, thus providing information also of other parts of the valves and adjacent tissues.
For the purpose of this study, we decided to focus on conventional and K-edge images. Reconstruction of other spectral images such as monoenergetic images and iodine images is possible with PCD-CT.10,32 Further studies will have to ascertain if the expected benefits of spectral images, such as monoenergetic images, for metal artifact reduction
Comments (0)