
Remember me
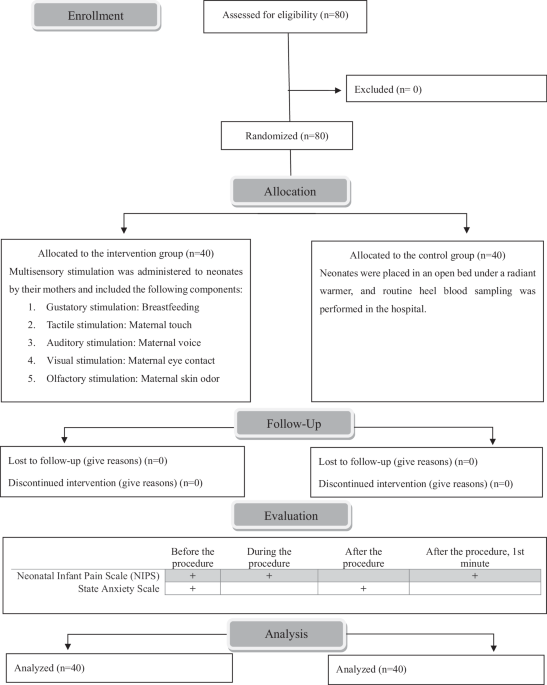
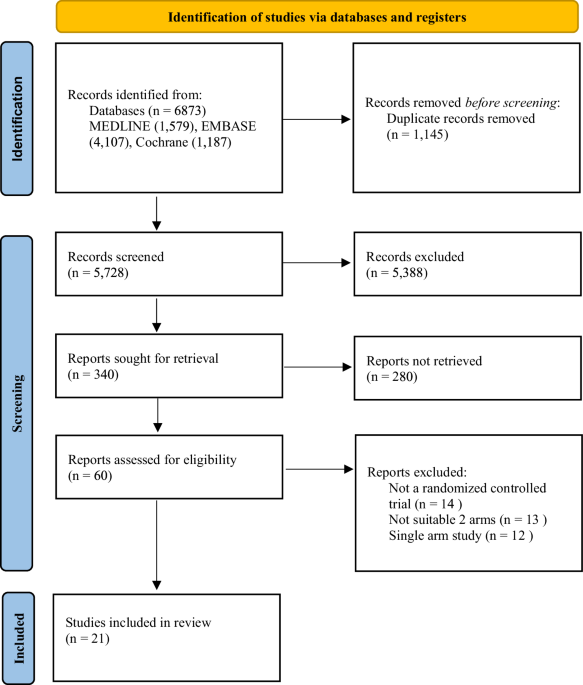
A total of 6873 studies were identified (Fig. 1). Following the removal of duplicates and the subsequent screening of titles, abstracts, and full texts, 21 studies from nine countries (Canada, Egypt, Finland, India, Iran, Israel, Turkey, UK and USA), reporting on 1,130 infants met the final inclusion criteria [16,17,18,19,20,21,22,23,24,25,26,27,28,29,30,31,32,33,34,35,36]. Three separate studies from one cohort were included, each investigating different outcomes with intervals of several years [20, 25, 35].Additionally, for one study [28], only the abstract was available. The baseline characteristics of studies are summarized in Table 1.
Fig. 1
Search strategy flow diagram of literature search and filtering results for a systematic review of the short-term (before 40 weeks’ postmenstrual age or at discharge) and long-term (after 40 weeks’ postmenstrual age or at the outpatient clinic follow-up) effects of vitamin D supplementation for preterm infants, according to the Preferred Reporting Items for Systematic Reviews and Meta-Analyses (PRISMA) 2020 guidelines.
Table 1 Study characteristics of 21 randomized-controlled trials analyzing the effects of different doses of vitamin D supplementation for preterm infants.Short-term outcomesThe Serum 25(OH)D levels and associated outcomes are presented in Fig. 2A, B, Supplementary Fig. 2, and Table 2A. Serum 25(OH)D levels were significantly increased in the high-dose group compared to the low-dose group (MD 15.62; 95% confidence interval [CI] 13.35-17.88; I2 = 90% [95% CI 88–98]; low certainty of evidence; 13 trials, 739 participants) [16, 19, 21,22,23, 25, 28, 30,31,32,33,34, 36]. In addition, the risk of VDD was significantly lower in the high-dose group (RD−0.29; 95% CI−0.37 to −0.22; I2 = 78% [95% CI 48–91]; moderate certainty of evidence; 5 trials, 449 participants) [23, 28, 31, 32, 36]. Moreover, significant difference was not found in the risk of VDE (RD 0.04; 95% CI 0.00–0.08; I2 = 21% [95% CI 0–88]; low certainty of evidence; 4 trials, 302 participants) [16, 19, 23, 36].
Fig. 2: Forest plots comparing the short-term (before 40 weeks’ postmenstrual age or at discharge) outcomes between the high-dose and low-dose vitamin D supplementation for preterm infants.
A Short-term outcomes: continuous variables. B Short-term outcomes: categorical variables. C Subgroup analysis of serum 25-hydroxyvitamin D levels according to different doses among the high-dose vitamin D supplementation group. D Subgroup analysis of categorical variables according to different doses among the high-dose vitamin D supplementation group. CI confidence interval, MD mean difference, RD risk difference; 25(OH)D 25-hydroxyvitamin D.
Table 2 Summary of findings of short-term (before 40 weeks’ post menstrual age or discharge from neonatal intensive care unit) and long-term (after 40 weeks’ postmenstrual age or from follow up to outpatient clinic after discharge) outcomes between the high-dose and low-dose vitamin D supplementation for preterm infants.Skeletal hypomineralization is presented in Fig. 2B, Supplementary Fig. 2, and Table 2A. The RD for skeletal hypomineralization was −0.18, indicating that the high-dose group had a significantly lower risk compared to the low-dose group (95% CI−0.28 to −0.08; I2 = 94% [95% CI 87–97]; low certainty of evidence; 4 trials; 168 participants) [17, 19, 31, 34].
Clinical outcomes are presented in Fig. 2A, B, Supplementary Fig. 2, and Table 2A. Weight gain velocity (g/day), length gain velocity (cm/week), and head circumference gain velocity (cm/week) all demonstrated a significant increase in the high-dose group compared to the low-dose group (weight: MD 2.57; 95% CI 1.10–4.04; length: MD 1.01; 95% CI 0.22-1.80; head: MD 0.57, 95% CI 0.13–1.02; all three outcomes: I2 = 0%; low certainty of evidence; 2 trials; 112 participants) [30, 31]. The significant differences in clinical outcomes, including RDS, BPD, LOS, and length of hospital stay were not found. However, the risk of mortality was significantly lower in the high-dose group (RD−0.13; 95% CI−0.25 to −0.02; I2 = 0%; low certainty of evidence; 2 trials; 114 participants) [16, 25].
Biochemical markers are presented in Supplementary Fig. 2. The PTH level(pg/mL, to convert to pmol/L, multiply by 0.106) was significantly lower in the high-dose group (MD−15.76; 95% CI−21.96 to −9.56; I2 = 84% [95% CI 61–94]; 4 trials, 302 participants) [19, 23, 31, 36]. The levels of the other biochemical markers, did not differ.
To identify the optimal high-dose, the high-dose group was divided into three subgroups, and a subsequent subgroup analysis was performed (Figs. 2C, D, Supplementary Fig. 2). All three high-dose groups (800 IU [16, 19, 23, 25, 27, 30, 33], 960–1000 IU [22, 23, 31, 34, 36], and 2000 IU [24]) demonstrated a significant elevation in serum 25(OH)D levels compared to the low-dose group. The risk of VDD significantly decreased in both the 800 IU [23, 28, 32] and 1000 IU [23, 31] groups compared to the low-dose group. However, the risk of VDE showed a significant increase exclusively in the 1000 IU subgroup [23, 36] (RD 0.07; 95% CI 0.01–0.12; I2 = 48%; 2 trials; 179 participants) and not in the 800 IU group [16, 19, 23].
Long-term outcomesThe Serum 25(OH)D levels and associated outcomes are presented in Fig. 3A, Supplementary Fig. 3, and Table 2B. The significant differences in serum 25(OH)D levels were not found between the low-dose and high-dose groups. In a single study focusing on long-term follow-up of VDD and VDE [32], VDD showed a significant decrease in the high-dose group (RD−0.23; 95% CI−0.40 to −0.05; low certainty of evidence; 80 participants), and VDE did not show a significant difference.
Fig. 3: Forest plots comparing the long-term (after 40 weeks’ postmenstrual age or at the outpatient clinic follow-up) outcomes between the high-dose and low-dose vitamin D supplementation for preterm infants.
A Long-term outcomes: continuous variables. B Long-term outcomes: categorical variables. CI confidence interval, MD mean difference, RD risk difference, 25(OH)D 25-hydroxyvitamin D.
Bone mineral density is presented in Fig. 3A, Supplementary Fig. 3, and Table 2B. Bone mineral density (mg/cm2) at corrected age 3 months displayed no significant difference (MD 0.33; 95% CI−5.47 to 6.12; I2 = 62%; very low certainty of evidence; 2 trials; 107 participants) [21, 32]. Bone mineral density at 9–11 years was reported in one study [22], and significant differences were not found between the two groups.
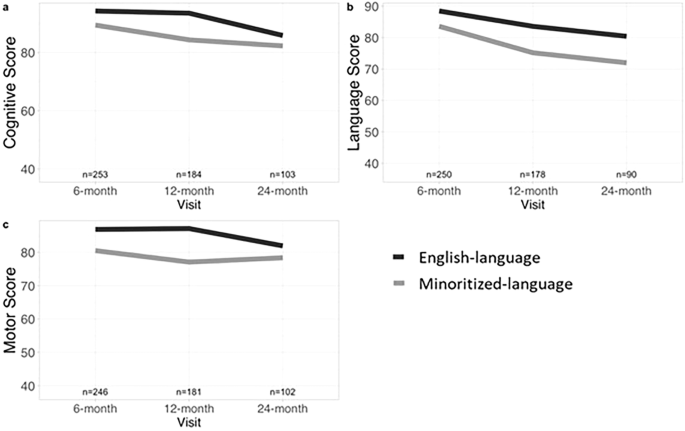
Clinical outcomes are presented in Fig. 3B, Supplementary Fig. 3, and Table 2B. In one study reporting on mortality and neurodevelopmental outcomes at 2 years of age [35], significant differences were not found in terms of mortality, cognitive and language impairment, and total neurodevelopmental impairment.
Quality assessment and certainty of the evidenceAll outcome parameters analyzed are summarized in Table 2. The ROB values are shown in Supplementary Fig. 4. Overall, 25% of the studies had a low risk, 25% raised concerns, and 50% had a high risk. Six studies had concerns regarding bias in the randomization process [17, 20, 24, 29, 33, 34], 9 studies had concerns regarding bias in deviations from the intended interventions [17, 21, 23, 24, 29, 30, 32, 35, 36], and 10 studies had a high risk of bias due to missing outcome data [20, 23,24,25,26, 29, 30, 32,
Comments (0)