Chemicals, antibodies and cell culture
The utilized chemicals and antibodies are detailed in Table 1.
Mouse bone marrow-derived mesenchymal stem cells (BMSCs) were obtained from Chuanqiu Biotechnology Co., Ltd (Shanghai, China; website:http://www.chuanqiubio.com/). Cells were maintained at 37 °C under 5% CO₂ in DMEM containing 10% FBS and 1% penicillin–streptomycin.
RNA sequence
Femoral bone specimens were harvested from three OVX and three SHAM mice, followed by total RNA extraction with TRIzol reagent (Thermo Fisher Scientific, #15,596,018) in accordance with the manufacturer's guidelines. The integrity and concentration of isolated RNA were verified using a NanoDrop ND-1000 spectrophotometer to meet quality control criteria. Inclusion criteria comprised: > 50 ng/μL concentration, RIN ≥ 7.0, and ≥ 1 μg total yield. PCR-amplified target fragments (300 ± 50 bp) were used for strand-specific library preparation. PE150 sequencing was conducted on the illumina NovaseqTM 6000 platform (LC Biotechnology) per standard protocols.
Bioinformatics analysis
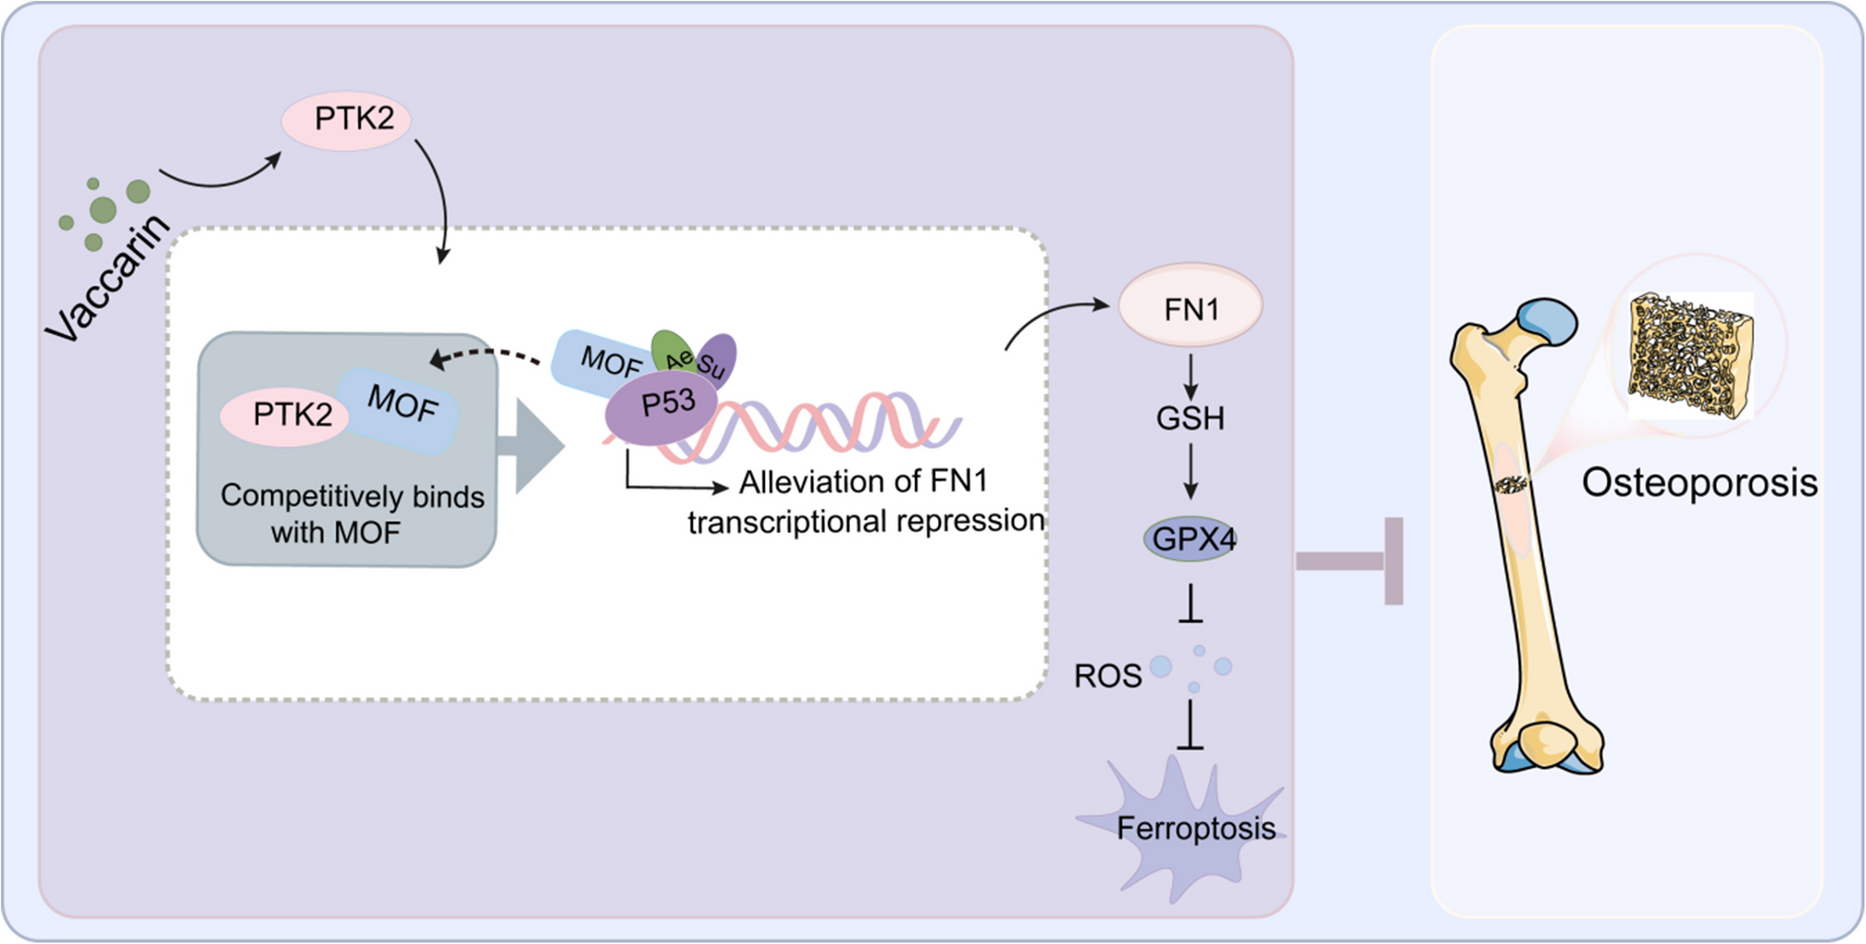
The gene regulatory networks were generated with Cytoscape 3.8.2, whereas STRING was employed to examine protein–protein interactions (PPI), elucidating PTK2's possible involvement in ferroptosis regulation (Luo et al. 2022).
To delineate P53 downstream effector genes, we extracted pertinent expression profiles from the GEO repository by employing the search terms Osteoporosis, P53 knockout, and ferroptosis. Through intersection analysis of datasets GSE202265, GSE171572, and GSE204847, we identified 75 common genes. Subsequent analysis using HIplot revealed the most differentially expressed gene, which was selected as our target gene (Dixon et al. 2012).
FerrDB represents the inaugural globally accessible database designed for the systematic classification of ferroptosis regulators (Chen et al. 2020). This platform enables efficient retrieval of comprehensive ferroptosis-associated gene datasets.
Cell viability assay
Cell proliferation was detected by the Cell Counting Kit-8 (CCK-8; Topscience) following the supplier’s instructions. Briefly, 6,000 cells/well were plated in 96-well plates, cultured for 24 h to ensure adhesion, and exposed to experimental compounds. Subsequently, 10 μL of CCK-8 reagent was introduced into each well, and the plates were incubated (37 °C, 5% CO₂) for 2 h. Optical density at 450 nm was quantified using a BioTek Epoch microplate spectrophotometer.
Collection of human femoral tissues
Femoral tissues were collected from female patients aged > 50 years undergoing hip arthroplasty. All subjects furnished written consent after being fully informed, and their demographic as well as clinical information was meticulously documented. Exclusion criteria included: (a) non-osteoporotic bone metabolic disorders; (b) recent (≤ 12 months) use of bone-modulating agents (e.g., bisphosphonates, SERMs, or calcitonin); and (c) history of tobacco/alcohol use. Inclusion criteria: (a) Osteoporosis is definitively diagnosed when femoral neck bone mineral density (BMD), measured by dual-energy X-ray absorptiometry (DXA), meets WHO diagnostic criteria with a T-score ≤ −2.5 standard deviations. (b) The samples should contain complete cortical and trabecular bone structures and be of sufficient size for experimental analysis; (c) no recent fracture was happened (within 6 months). Tissues were stratified by BMD for RNA comprehensive analysis to investigate molecular pathways in osteoporosis pathogenesis.
RNA purification and real-time quantitative PCR (RT-qPCR)
Total RNA extraction from BMSCs, murine bone tissue, and clinical samples was conducted using TransZol Up reagent (TransGen Biotech, China), following the manufacturer's instructions. cDNA synthesis was achieved through reverse transcription with EasyScript® One-Step gDNA Removal and cDNA Synthesis SuperMix (TransGen Biotech). Quantitative PCR analysis was performed using TransStart® Green qPCR SuperMix (TransGen Biotech) on a Thermo Fisher Scientific platform (Singapore).
Cell transfection
To achieve ectopic gene expression, the open reading frames of PTK2, TP53, and MOF were subcloned into the pcDNA3.1(+) mammalian expression plasmid. Plasmid transfection was performed with GP-transfect-Mate transfection reagent (Shanghai Genepharma) following the manufacturer's protocol. Following a 72-h incubation period to allow adequate protein expression, subsequent analyses were performed.
To knockdown P53 and FN1, unmineralized BMSCs were transfected with gene-specific siRNAs using GP-transfect-Mate reagent. Three independent siRNA oligonucleotides per target gene, synthesized by Tsingke Biotech Co., Ltd. (Beijing, China), were employed. Transfected BMSCs were harvested 48 h post-transfection for further analysis.
Alkaline phosphatase (ALP) staining and activity assay
Following a 14-day period of osteogenic induction, the BMSCs were disrupted via sonication. Subsequently, the ALP activity was measured using a commercial assay kit according to the manufacturer's protocol. Cellular ALP was further assessed by histochemical staining and subsequent microscopic examination.
Alizarin red S (ARS) staining and quantification
Osteogenic mineralization was evaluated following 14 days of induction using ARS staining. Subsequently, the stained cells were lysed with 5% cetylpyridinium chloride solution (Solarbio, Cat. No. C9890, China), and the absorbance at 562 nm was measured with a microplate reader to quantify the mineralization.
Transmission electron microscope (TEM)
The mitochondrial morphology was examined utilizing transmission electron microscopy (Hitachi H-7650 model). Briefly, BMSCs were fixed overnight at 4 °C with 2.5% electron microscopy-grade glutaraldehyde, followed by standard dehydration, embedding, thin-sectioning, and staining procedures.
Mitochondrial membrane potential (ΔΨ) and mtROS determination
Cells were stained with JC-1 kit (Beyotime, China) to measure mitochondrial membrane potential. To assess mitochondrial reactive oxygen species (mtROS) levels, cells were incubated with MitoSOX Red (1 μl/ml; Beyotime, China) for 30 min at 37 °C, followed by observation under a fluorescence microscope (Caikon, Shanghai, China).
Detection of intracellular ROS
The intracellular ROS content was quantified employing a commercially available detection kit (Beyotime Biotechnology, China). Following a 24-h incubation with graded concentrations of the experimental compounds in 12-well culture plates, cellular ROS production was evaluated using fluorescence microscopic analysis (Caikon Instruments, Shanghai).
Mitochondrial permeability transition pore (mPTP) openings
The mitochondrial permeability transition pore (mPTP) opening status of BMSCs across experimental groups was assessed employing a commercial fluorescent detection kit (Abbkine Scientific Co., Ltd, China) following the standardized protocol. Briefly, PBS-washed cells were incubated with calcein AM staining solution (37 °C, 30 min, dark). After replacing with 10% FBS-supplemented medium, the samples underwent further incubation under identical conditions. Nuclear counterstaining was performed using Hoechst (15 min), followed by PBS washes prior to fluorescence microscopic observation (Caikon, Shanghai, China).
Detection of GSH, MDA and Fe content
Commercial assay kits were employed to measure glutathione (GSH) (Nanjing Jiancheng Biotechnology Co., China), malondialdehyde (MDA) (Nanjing Jiancheng Bioengineering Co., Ltd., China), and iron levels (Fe colorimetric detection kit, Elabscience, China), following the manufacturers'protocols. Briefly, cells were plated in 12-well plates, treated with various compounds, and incubated for 24 h. Subsequently, samples were processed by adding the respective reagents as specified in each kit’s instructions before analysis.
Luciferase reporter assay
We generated FN1-wt-luc and FN1-2000 bp-Luc reporter constructs in the pGL3-Basic vector. The BMSCs were transfected with these constructs or empty vector in 24-well plates using PGP-Transfection-Mate. Luciferase activity was assessed 24 h post-transfection, followed by treatment and luminescence measurement after 48 h using TransGen Biotech's dual luciferase kit according to the manufacturer's protocol.
Molecular docking and virtual screening
Molecular docking between PTK2 (PDB: 4NY0) and MOF (PDB: 7CMR) was performed using the HDock web server (Jiang et al. 2015a) Following 100 independent simulation runs, the generated protein complexes were systematically evaluated and prioritized according to their binding affinity. Structural visualization was performed using PyMOL.
To identify PTK2-activating natural compounds, we performed structure-based virtual screening against the L1400 natural product library (3,060 compounds), using AutoDock Vina (Li et al. 2009). Potential binding sites on PTK2 (PDB: 4NY0) were initially predicted using ProteinPlus. Molecular docking results were subsequently analyzed and visualized in PyMOL.
Cellular thermal shift assay (CETSA)
The supernatant fractions were incubated with either DMSO or Vaccarin at 37 °C for 120 min. Before electrophoretic separation, aliquots were subjected to thermal stress (0–60 °C, 5 min) followed by prompt centrifugation at 4 °C (10,000 × g, 10 min). Protein extracts were then immunoblotted for analysis.
Animal experimentsEstablishment of the osteoporosis model in the mice
We employed forty 8-week-old female C57BL/6 J mice (Dalian Medical University Laboratory Animal Center origin) in this ethically approved study. The experimental protocol received institutional approval (Approval No. AEE21084) from Dalian Medical University's Animal Ethics Committee, adhering strictly to NIH guidelines for laboratory animal care. Animals were randomly assigned to four treatment cohorts (n = 10/group) employing a blocked randomization protocol: (I) SHAM group, (II) OVX + ADV-NC group, (III) OVX + ADV-PTK2 group, and (IV) OVX + Vaccarin group. Animals were maintained under pathogen-free conditions with standardized illumination (12 h light/dark) and thermoregulation at 23 ± 2 °C. Female mice were housed under standard conditions with free access to purified water and regular chow. After sodium pentobarbital-induced anesthesia, the animals were randomly allocated to receive either bilateral OVX or sham surgery. Postoperative animals were housed under standard conditions, with the experimental cohort (Group IV) initiating daily intraperitoneal administration of Vaccarin (5 mg/kg body weight) commencing 7 days after surgical intervention. At the 4-week postoperative time point, adenovirus was administered via tail vein injection in II/III groups. After completing a 9-week controlled dietary regimen, subjects were euthanized humanely via sodium pentobarbital overdose, followed by femoral tissue collection for further analysis.
Establishment of the calvarial defects
Female C57BL/6 J mice (8 weeks old) were administered anesthesia to achieve surgical immobilization and alleviate procedural distress. Following standard procedures, the cranial fur was removed, and a 15-mm sagittal incision was made along the skull midline. Bilateral 2-mm craniotomies were then performed using an electric drill, symmetrically positioned relative to the midline. The prepared cells were mixed with basal-membrane-matrix (phenol red). (I) The left side was filled with blank basal-membrane-matrix (phenol red), and the right side was filled with a basal-membrane-matrix (phenol red) and osteoblast mixture. (II) The left side was filled with a basal-membrane-matrix (phenol red) and osteoblast mixture, and the right side was filled with vaccarin-treated osteoblasts and basal-membrane-matrix (phenol red) mixture. (III) The left side was filled with a mixture of basal-membrane-matrix (phenol red) and ADV-NC transfected cells, and the right side was filled with a mixture of ADV-PTK2 transfected cells. The wound was sutured, and the skull was harvested 4 weeks later for subsequent experiments.
Micro-CT and analysis
The left femurs were taken from each of the three mice for micro-CT analysis. After anesthesia with 1% pentobarbital, the femurs of the mice were removed and fixed with paraformaldehyde. The femur was imaged by a Venus Micro CT (China). After image reconstruction, a 1 mm section was taken 1 mm below the growth plate for analysis. Data acquisition and parameter quantification were performed utilizing the Cruiser analytical platform. The assessed morphometric indices included trabecular separation (Tb.Sp, mean value in mm), connectivity density (Conn.D, mm⁻3), bone volume fraction (BV/TV), trabecular number (Tb.N, mm⁻1), and three-dimensional trabecular network integrity (trabecular connectivity).
The contents of Ca, ALP, ACP, GSH and MDA in serum were detected
Calcium (Ca) levels were determined using microplate method (No: C004-2–1) following standard protocols.
Alkaline phosphatase (ALP) activities were measured using colorimetric assays with specific substrates (p-nitrophenyl phosphate for ALP (No.: A059-1–1)) and quantified at 520 nm. Acid phosphatase (ACP) activities were measured using colorimetric assays with specific substrates (acid phosphatase substrate for ACP (No.: A058-1–1)) and quantified at 530 nm.
Glutathione (GSH) and malondialdehyde (MDA) levels were assessed using commercially available kits (Manufacturer) following the prescribed protocols. For GSH quantification (Catalog No.: A003-4–1), an enzymatic recycling assay utilizing 5, 5'-dithiobis-(2-nitrobenzoic acid (DTNB) as chromogen was performed with absorbance read at 405 nm. Concurrently, MDA levels (Catalog No.: A006-2–1) were evaluated through thiobarbituric acid reactive substances (TBARS) methodology with spectrophotometric detection at 532 nm.
Histological and immunofluorescence staining
Femorods were cross-linked in 4% paraformaldehyde (48 h, RT), PBS-washed (3 × 10 min), and ethanol-dehydrated before methyl methacrylate embedding. Tissue sections were subsequently stained using hematoxylin/eosin (H&E) and Masson trichrome protocols.
For immunofluorescence staining, bone sections were permeabilized with 0.2% Triton X-100 (5 min) prior to blocking with 1% BSA (60 min, RT). Subsequently, sections were incubated overnight at 4 °C with primary antibodies targeting transferrin receptor (TFR, 1:500) and glutathione peroxidase 4 (GPX4, 1:500). After extensive washing with TBST (3 × 10 min), species-matched secondary antibodies were applied (60 min, RT), followed by nuclear counterstaining with DAPI (10 min).
Immunoblotting and immunoprecipitation analysis
Protein expression levels were determined through immunoblotting analysis following standardized experimental procedures (Nagasaka et al. 2022). Co-immunoprecipitation assays were performed using cellular extracts prepared with RIPA lysis buffer (Beyotime Biotechnology, Shanghai), followed by pre-clearing with 10 µL protein A-agarose beads. Following centrifugation at 12,000 × g, the resultant supernatant was immunoreacted with 1 μg of primary antibody at 4 °C for 2 h, then mixed with 20 μl protein A-agarose suspension and maintained at 4 °C for 12 h. The immunocaptured protein complexes were subsequently subjected to immunoblotting analysis with corresponding antibodies. Antigen–antibody interactions were detected using an enhanced chemiluminescence kit (Advansta, Beijing, China), with signal acquisition performed on a ChemiDoc MP Imaging System (Tanon, China). Densitometric quantification of protein bands was carried out using ImageJ analysis software (Version 1.8.0).
Statistical analysis
Statistical analyses were performed using GraphPad Prism 8.0. Results are expressed as mean ± SD (n = 3–6 independent replicates). Between-group comparisons were assessed by Student’s t-test or one-way ANOVA, as specified in respective figure legends, with statistical significance set at P < 0.05.


Comments (0)