Animals models
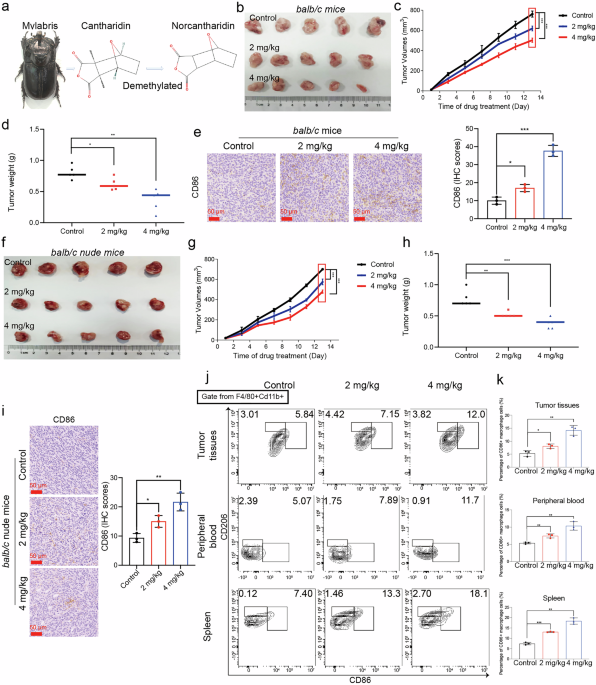
The subcutaneous CRC models were used to evaluate the antitumor effect of NCTD in vivo. A total of 2 × 10⁶ CT26 cells in 100 μL PBS were subcutaneously injected into the dorsal flank of balb/c mice (n = 5 for each group). In addition, 2×10⁶ HCT116 cells were subcutaneously injected into the dorsal flank of balb/c nude mice (n = 5 for each group). Mice were randomized into Control group (PBS, once a day, i.p.), NCTD 2 mg/kg group (i.p., once a day), and NCTD 4 mg/kg group (i.p., once a day). Tumor volume was monitored after inoculation according to the following formula: volume = length × width2 × 0.5.
The macrophage clearance mouse model was constructed to evaluate whether the antitumor effects of NCTD are dependent on macrophages. Clodronate liposomes were employed for the depletion of macrophages in mice. The clodronate liposomes (LipoCLO, #40337ES10, Shanghai, China) and the control PBS liposomes (LipoPBS, #40338ES10, Shanghai, China) were procured from Yeasen. One day prior to the injection of cancer cells, 100 µL of LipoCLO (at a concentration of 5 mg/mL) or LipoPBS was administered intraperitoneally. This liposomal administration was subsequently repeated every two days.
This investigation conforms to the Guide for the Care and Use of Laboratory Animals (US National Institute of Health, publication No. 85–23, revised 1996) and was in accordance with the institutional guidelines for animal care and use approved by the Institutional Animal Care and Use Committee of Nanjing University of Chinese Medicine.
The present study obtained the endorsement of the Ethics Committee for Animal Experimentation of Nanjing University of Chinese Medicine and was conducted in strict compliance with the regulations set forth by the committee.
Cell lines and culture
Human colorectal cancer cell lines HCT116 and LoVo, mouse colorectal cancer cell lines CT26, the human monocyte cell line THP-1 and the mouse macrophage cell line RAW264.7 were obtained from the Cell Bank of China Science Academy (Shanghai, China). HCT116, CT26 and THP-1 cells were cultured in RPMI-1640 medium, LoVo cells were cultured in F-12K medium and RAW264.7 cells were cultured in DMEM medium (Basalmedia Technologies, China). All medium was supplemented with 10% fetal bovine serum (ABWBIO, China), 1% penicillin-streptomycin (Basalmedia Technologies, China). All cells were cultured in a humidified atmosphere containing 5% CO2 at 37 °C.
Macrophage polarization
Human monocytic THP-1 cells were differentiated into M0 macrophages by treatment with 200 ng/mL Phorbol 12-myristate 13-acetate (PMA, MedChemExpress, #HY-18739) for 48 h. To generate M1-polarized THP-1 macrophages, THP-1 cells were incubated with PMA (200 ng/mL) for 24 h and then treated with 100 ng/mL PMA plus 100 ng/mL lipopolysaccharide (LPS, MedChemExpress, #HY-D1056) and 20 ng/mL recombinant human IFN-γ (Proteintech, #HZ-1301) for a further 48 h. To generate M1-polarized RAW264.7 macrophages, RAW264.7 cells were stimulated with 100 ng/mL LPS plus 20 ng/mL recombinant mouse IFN-γ (MedChemExpress, #HY-P7071) for 24 h.
Cell viability assay
Cell Counting Kit-8 (#40203ES60, Yeasen) was used to evaluate cell viability as described previously [20]. Briefly, 8 × 10³ cells were planted into 96-well plates, after adhesion, cells were incubated with different dose of NCTD for 48 h or 24 h. The plates were added with CCK‑8 solution (10 μL/well) at a specific time and incubated for another 2 h at 37 °C. Cell viability was assessed by optical density measurements.
Colony formation assay
The cells were seeded in 12-well plates (800 per cell) with different doses of NCTD. When the cells showed obvious colonies after 14 days, colonies formed by at least 50 cells were stained with crystal violet and counted.
Ethynyl-2′-deoxyuridine (EdU) staining
EdU cell proliferation staining was performed with an EdU staining kit (Beyotime, #C0071S) following the manufacturer’s protocol. Briefly, 2 × 10⁵ CRC cells were seeded in 12-well plates and treated with NCTD for 48 h. Subsequently, EdU solution (10 µM) was added to the cell medium for 6 h, followed by fixation, penetration and three washes of the cells. The click reaction solution containing Azide 488 was then applied to the cells for 30 min and cell nuclei were counterstained with Hoechst 33342 buffer.
Apoptosis assay
Apoptosis was measured using the Apoptosis Detection Kit (Yeasen, #40304ES50) as described previously [10]. Briefly, cells were plated in a 6-well plate with 1 × 10⁶ cells per well concentration and treated with various concentrations of NCTD. After 48 h, cells were washed twice with PBS and incubated with Annexin V-Alexa Fluor 647/PI for 15 min at room temperature.
Cell-cycle assay
Cells were fixed with ice-cold 70% ethanol at −20 °C for overnight. The fixed cells were washed with ice-cold PBS, incubated with RNase A (10 mg/mL, Solarbio Biological Technology, #R1030) in PBS at 37 °C for 1 h, and then stained with 10 μg/mL propidium iodide (PI, Yeasen, #40711ES10) solution.
Analysis of different T and macrophage cells detected by flow cytometry
Peripheral blood mononuclear cells (PBMCs) were collected and isolated using the mouse peripheral blood lymphocyte isolation kit (Solaibao Biological Technology, #P8620). The mouse spleens were harvested and grinded in 70 μM cell strainer to obtain a single-cell suspension, subsequently the cell suspensions were enriched and purified with a mouse spleen lymphocyte isolation kit (Solaibao Biological Technology, #P8860) according to the manufacturer’s instructions. Freshly resected tumor tissues were digested and converted into a single cell suspension with the tumor dissociation kit (Miltenyi, #130-096-730). Blocking with anti-mouse CD16/32 (BioLegend, #01302) was conducted before staining immune cells with the specified antibody. Then surface staining was performed with antibodies including CD3, CD4, CD8, CD25, CD45, F4/80, CD11b and CD86 in the flow cytometry buffer (eBioscience™, #00-4222-57) and stained for 30 min on ice. FOXP3 staining was performed with a FOXP3/Transcription factor staining buffer set (eBioscience™, #00-5523-00) according to the manufacturer’s instructions. CD206 staining was performed immediately after cell surface antibody staining, followed by cell fixation using Fixation Buffer (BioLegend, #420801) for 30 min and permeabilization using Intracellular Staining PermeabilizationWash Buffer (BioLegend, #421002) for 15 min.
Mitochondrial membrane potential measurement
The JC-1 staining according to the manufacture’s protocol (Beyotime, #C2006). In brief, cells were plated in 6-well plates at a density of 1 × 10⁶ cells/well. Following treatment, the cells were detached and suspended in medium containing with JC-1 staining buffer at 37 °C for 30 min in the dark, then subjected to flow cytometry analysis.
Detection of reactive oxygen species
The intracellular levels of reactive oxygen species (ROS) were measured using an ROS assay kit (Beyotime, #S0033M) according to the manufacture’s protocol. Briefly, cells were harvested and incubated with 10 μM 2’,7’-Dichlorodihydrofluorescein diacetate (DCFH-DA) at 37 °C for 30 min, then washed three times with serum-free solution. The levels of ROS were quantified through flow cytometric analysis, followed by the measurement of the geometric mean fluorescence intensity (MFI).
Transwell assays
For migration, 5 × 10⁴ cells were seeded into the upper chambers of transwell filters (Labselect). After a 24-h incubation, cells were fixed with 4% paraformaldehyde and stained with 1% crystal violet solution. Non-migrated cells inside the upper chamber were gently removed with cotton swabs, and the migrated cells at the bottom of the filter were photographed by counting three randomly microscopic fields per well and the mean was determined. For invasion, transwell plate was coated with diluted Matrigel matrix firstly, and the subsequent procedures were identical to those in the migration assays.
Wound healing assay
Scratch wound assays were performed by quantifying the area of scratches at various time intervals. A total of 2 × 10⁵ cells were plated into each well of 6-well plates. After a 48-h incubation, a linear scratch was made with a 200 μL pipette tip at the bottom of the wells. Images of the same regions were captured at specified time points (0, 24 and 48 h) after wounding.
ELISA assay
The ELISA kits (Shanghai Enzyme-linked, China) were performed for the detection of CSF2 levels in serum and in culture supernatant following the manufacturer’s protocols.
CRC cells-macrophage cells coculture
A transwell insert with a 3.0 μm polycarbonate membrane pore size for 6-well plate (Labslect) was used for the coculture experiments. For the HCT116-macrophage cell coculture, M1 macrophages were induced by THP-1 cells as described previously. M1 macrophages were plated 48 h in a 6-well plate in advance and then cocultured with HTC116 at a 1:2 ratio at 37 °C. After 48 h, the macrophages were harvested, and the mean fluorescence intensity (MIF) of CD86 expression levels was analyzed. For the CT26-macrophage cell coculture, RAW264.7 macrophages were differentiated into M1 macrophages as described previously. RAW264.7 cells were plated 48 h in a 6-well plate in advance and then allowed interaction with CT26 at a 1:2 ratio at 37 °C. After 48 h, macrophages were collected and the CD86 expression levels were measured.
Western blot
Total proteins from HCT116 and LoVo cells were lysed with RIPA buffer (Beyotime, #P0013B) which was supplemented with 50× Protease and phosphatase inhibitor cocktail (Beyotime, #P1008 and #P1045), in accordance with the provided protocol. An equal amount of total protein lysates (20 μg) was loaded onto SDS-PAGE gel and subsequently transferred to PVDF membranes (Millipore). After blocking with a diluted Protein Free Rapid Blocking solution (EpiZyme, #PS108P), the membranes were washed with TBST (Servicebio, #G2150) and incubated with primary antibodies at 4 °C overnight. The membranes were washed with TBST three times and then incubated with secondary antibodies for 1 h at room temperature. The antibodies were detailed in Table 1.
Table 1 Antibodies used in this study.RNA isolation and real time PCR
Total RNA was extracted using the MolPure® Cell/Tissue Total RNA kit (Yeasen, #19211ES) and quantified with a NanoDrop-2000 spectrophotometer (Thermo Fisher). Reverse transcription was performed using the Hifair® II 1st Strand cDNA Synthesis Kit (gDNA digester plus) (Yeasen, #11123ES) according to the protocols, to synthesize cDNA. The amplification of the target genes was performed using 2× ChamQ SYBR qPCR Master Mix (Low Rox Premixed) (Vazyme, #Q331) on the QuantStudio5 real-time PCR system (Applied Biosystems). The specific primer sequences were shown in Table 2.
Table 2 Primers used in this study (5’-3’).RNA sequencing and data analysis
Total RNA was extracted using the TRIzol reagent (Thermo Fisher, #15596018CN), following the manufacturer’s protocol, and then sent to OE Biotech Co., Ltd. (Shanghai, China). Subsequently, the libraries were constructed using VAHTS Universal V6 RNA-seq Library Prep Kit according to the manufacturer’s instructions. The quantified and validated libraries were sequenced on the Illumina Novaseq 6000 platform, generating 150 bp paired-end reads. The differentially expressed genes (DEGs) were identified using DESeq2, then underwent Kyoto Encyclopedia of Genes and Genomes (KEGG) pathway analysis, gene set enrichment analysis (GSEA) and Ingenuity pathway analysis (IPA).
Hematoxylin eosin (H&E) and immunohistochemistry (IHC) staining analysis
For H&E staining, paraffin sections of tumor tissues were deparaffinized, rehydrated, and stained with hematoxylin and eosin according to a standard protocol. For IHC staining, slides of paraffin-embedded tumor tissues were dewaxed, antigen-retrieved, blocked by hydrogen peroxide. After blocking with 5% goat serum for 1 h, the anti-Ki67 antibody (1:200) and the anti-CD86 antibody (1:200) were added and incubated overnight at 4 °C. Afterwards, the secondary antibody was added and incubated at 37 °C for 30 min, followed by 100 μL of DAB working solution, and incubation at room temperature for 5 min.
Statistical analysis
Statistical analysis was conducted using GraphPad Prism software (V.9.0). The results are presented as the means ± standard deviation of three independent experiments, and the data were analyzed using Student’s t-test to assess the significant difference between the two groups. P < 0.05 was considered statistically significant.


Comments (0)