
Remember me

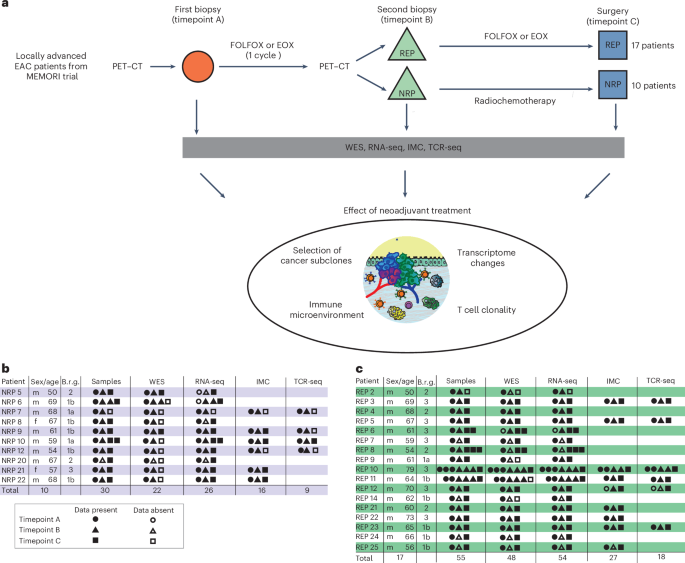

EAC patients in the MEMORI trial19 underwent baseline 18F-FDG-PET (18-fluorodesoxyglucose positron emission tomography) followed by one cycle of neoadjuvant platinum-based chemotherapy (CTx), with metabolic response assessed at day 14–21 by 18F-FDG-PET. Responders (REPs; as shown by PET–CT scan) continued to receive chemotherapy, whereas nonresponders (NRPs) by PET–CT were switched to intensified radiochemotherapy (RCTx); for detailed information see Methods. The clinical trial outcomes have been fully reported previously19 and here we report on subsequent molecular genetic analyses of a completed trial. Of screened MEMORI patients, 13% (n = 21) were excluded due to no/low FDG uptake in the primary tumor19. FDG uptake intensity was not associated with global transcriptomic differences (Extended Data Fig. 1a), suggesting no major stratification in biologically different subgroups based on initial PET signal intensity. Pathological response in the post-treatment sample was assessed via tumor regression grades according to Becker20. Overall, 70% of NRPs showed remission grade I, compared to only 35% of REPs (Extended Data Fig. 1b); however, despite the addition of RCTx leading to an augmented histological response rate, poor early metabolic response was still associated with inferior progression-free survival and overall survival (Extended Data Fig. 1c,d). Analogous results were reported in the AGITG DOCTOR trial21. Given that initial PET-measured metabolic response correlated with outcome, our study design therefore aimed to analyze ecological and evolutionary dynamics in REPs and NRPs to understand the cellular and molecular effect of different treatment modalities in EAC.
Longitudinal molecular analysis was performed on 10 NRPs and 17 REPs (Fig. 1a). From most patients, three cancer samples were collected: one pretreatment biopsy (timepoint A), one biopsy after the first cycle of platinum-based chemotherapy (timepoint B) and the surgical cancer resection specimen sample after completion of neoadjuvant treatment (timepoint C) (Fig. 1a–c). For two patients (REP10 and REP11) we performed more extensive multi-timepoint and multi-region sampling (≥6 samples per patient).
Fig. 1: Experimental workflow and overview of the study cohort.
a, Flowchart summarizing patient treatment and study design, including respective neoadjuvant treatment, sample acquisition and analyses. FOLFOX, oxaliplatin and 5-FU; EOX, epirubicin, oxaliplatin and capecitabine; WES, whole-exome sequencing; RNA-seq, RNA-sequencing; IMC, imaging mass cytometry; TCR-seq, T cell receptor sequencing. b,c, Overview of the study cohort of NRPs (b) and REPs (c) with indication of samples present for each type of data analysis. Samples from different timepoints are indicated with different shapes. Age, age at diagnosis; Brg, Becker remission grade.
After clinical and histopathological review (Supplementary Table 1) all samples were microdissected (Methods) and whole-exome sequenced (22 tumor samples from NRPs and 48 tumor samples from REPs; at mean coverage of 300× (range 44–478×) with matched blood germline control at mean coverage of 282× (Supplementary Table 2). We called single-nucleotide variants (SNVs), indels and copy number alterations (CNAs). Tumor cellularity was not significantly different between timepoints (Extended Data Fig. 2a). Matched bulk 3′ RNA-seq was performed on 26 samples from NRPs and 54 samples from REPs (Supplementary Table 3). Immune composition during treatment was analyzed with a 21-marker IMC panel (39 regions of interest (ROIs) from 16 NRP samples and 74 ROIs from 27 REPs samples; Fig. 1b,c). Bulk TCR sequencing was performed on 18 samples from REPs and 9 samples from NRPs (Fig. 1b,c).
Limited evidence for clonal selection during treatmentWe first assessed genetic changes in REPs and NRPs (Fig. 2a–c), finding an average mutational burden of 23.09 SNVs/Mb (range 7.5–127.7 SNVs per Mb) in treatment-naive EAC, consistent with previous literature after accounting for our higher sequencing depth22,23.
Fig. 2: Evolutionary dynamics of mutations during neoadjuvant treatment in EAC.
a–c, Violin plots showing the distribution of mutational burden during neoadjuvant treatment for all patients (a), stratified by treatment response (b) and stratified by clonality of mutation (c). Mutations of each sample were classified as clonal or subclonal based on the copy number and cellularity adjusted cancer cell fraction. P values in a–c were calculated by the two-sided Wilcoxon test. d, Selected phylogenetic trees with clade length indicating the number of shared mutations between samples. Timepoint of samples are annotated at the tip of the clades with the letters A–C. Numbers at the nodes indicate bootstrap values. EAC drivers harboring SNVs (without brackets) or indels (in squared brackets) and number of neoantigenic SNVs are annotated on the clades of the trees. HI, homoplasy index; NeoSNVs, neoantigenic SNV. e, Proportion of SNV types in treatment-naive SNVs (left), SNVs occurring under chemotherapy (middle) and SNVs occurring under RCTx (right) from phylogenetic tree analyses. A, adenine; T, thymine; C, cytosine; G, guanine. n = 5,341 CTx-induced SNVs, n = 283 RCTx induced SNVs, n = 9,787 treatment-naive SNVs. f, Proportion of COSMIC signatures in NRPs and REPs during treatment (COSMIC signature calling was limited to those with a weight >5% in the respective groups). Samples from NRP: n = 10 at timepoint A, n = 10 at timepoint B, n = 2 at timepoint C; samples from REP: n = 19 at timepoint A, n = 14 at timepoint B, n = 15 at timepoint C. g, Line graph showing changes in the proportion of COSMIC signature 4 in responders during treatment. For multi-region samples means were plotted for each timepoint.
The overall SNV burden between pre- and post-treatment samples showed neither a significant difference in the overall cohort (Fig. 2a) nor when stratified by initial response (Fig. 2b).
We assessed changes in mutation clonality, reasoning that if treatment drove clonal selection, we might see increased clonal and/or subclonal mutational burden between pre- and post-treatment; however, no significant difference was detected for either mutation class (Fig. 2c), nor after stratifying by the treatment that was given (Extended Data Fig. 2b,c).
To probe clonal dynamics, we constructed SNV-based phylogenetic trees for 13 patients with multi-timepoint and multi-region samples (≥3 samples) (Fig. 2d and Extended Data Fig. 2d)24. The majority of phylogenetic trees were visually ‘balanced’ with similar clade lengths for all samples. We observed progressive clonal sweeps during neoadjuvant treatment in only one sample (NRP9; Fig. 2d and Extended Data Fig. 2d). In all other cases, samples from timepoint C were either most similar to precursor clones of samples from timepoints A and B (for example REP22), or most similar to a clone detected at timepoint A (for example REP10). Notably, patients with multi-region sampling (REP10 and REP11) showed more similarity between samples from different timepoints than between multi-region samples. A parsimonious explanation of these observations is that the cancer was a mosaic of clones, and inferred clonal relationships between timepoints and/or spatial samples were determined by spatial sampling rather than by a clonal sweep driven by treatment.
Known high-frequency driver events such as TP53 and CDKN2A were mostly truncal on the phylogenetic trees, indicating that these drivers persisted through treatment. TP53 SNVs were present in 17 patients (Figs. 2d and 3e and Extended Data Fig. 2d) and TP53 indels in 4 out of 27 patients (Figs. 2d and 3e and Extended Data Fig. 2d), with 14 out of 23 patients with ≥2 samples harboring clonal TP53 alterations present in all samples. CDKN2A SNVs were present in two patients (Fig. 3e and Extended Data Fig. 2d) and CDKN2A indels in four patients (Figs. 2d and 3e) with clonal genetic CDKN2A alterations in 5 out of 23 patients with ≥2 samples (Figs. 2d and 3e), consistent with previous literature22,23,25,26. We examined the phylogenetic trees from 11 patients with sequencing from pre- and post-treatment timepoints, finding in 6 patients that there were new low-frequency putative drivers (those mutated in <5% of samples in IntOGen cohorts) post-treatment and in the remaining 5 patients there were no new drivers post-treatment. This suggests no major changes in the clonal make-up for the majority of patients during neoadjuvant treatment.
Fig. 3: Dynamics in copy number alterations during neoadjuvant treatment.
a, Plot showing genome-wide copy number state. Each row represents a sample, with samples from the same patient grouped together and patient ID is annotated on the left. Treatment response and timepoint of each sample are annotated on the right. Dashed vertical lines indicate the centromere of each chromosome and continuous vertical lines are separating different chromosomes. CNS, copy number state; CNt, copy number. b, Percentage of altered exome in REPs and NRPs during neoadjuvant treatment. CNS: copy number state. Samples from NRPs n = 10 at timepoint A, n = 10 at timepoint B, n = 2 at timepoint C; Samples from REPs: n = 19 at timepoint A, n = 14 at timepoint B, n = 15 at timepoint C. c, Fragment size of clonal, subclonal and private CNAs. Box plots show the median, two hinges representing the first and third quartiles and two whiskers showing the minimum and maximum. In patients with only two samples available, no distinction between subclonal and private could be made and therefore CNAs were summarized in ‘subclonal/private’ category. Number of clonal fragments: n = 281 in REPs, n = 180 in NRPs. Number of subclonal fragments: n = 315 in NRPs, n = 1,492 in REPs; number of subclonal/private fragments n = 460 in NRPs, n = 307 in REPs; number of private fragments n = 202 in NRPs, n = 995 in REPs. P values are calculated by the two-sided Wilcoxon test. Subcl./priv., subclonal/private. d, Fraction of exome with changing copy number state between timepoint A and B in NRPs and REPs. P values are calculated by a two-sided Wilcoxon test. TP, timepoint. e, Plot shows genetic alterations, including CNAs, SNVs and indels for putative cancer driver genes identified by IntOGen. Each vertical column represents a sample. Samples of the same patients are grouped together and patient ID is annotated at the top. Information on timepoint, cancer cellularity and the patient’s pathological regression grade treatment are found in the top three rows. The following rows show information on genetic alterations in EAC driver genes. Cellularity was defined as low (10–30%), medium (31–60%) or high (61–100%). Regression grades were evaluated by a pathologist according to Becker regression classification.
dN/dS analyses (the ratio of nonsynonymous to synonymous substitutions) to detect evidence of clonal selection of treatment induced SNVs showed dN/dS~1 for treatment-naive and RCTx induced SNVs, indicating no evidence of selection. dN/dS of 0.8 (CI 0.7–0.96) for CTx-induced SNVs showed weak evidence of negative selection (Supplementary Table 5).
As distinct treatment regimens have been associated with specific mutational footprints27, we computed mutational signatures for our cohort. SNVs from our phylogenetic trees were classified into treatment-naive SNVs, SNVs acquired during chemotherapy exposure (CTx-SNVs) and SNVs acquired during RCTx exposure (RCTx-SNVs). Treatment-naive SNVs, CTx-SNVs and RCTx-SNVs showed significant differences in their six-channel mutation signatures (chi-squared test P < 0.001), with an increase in C > A mutations during CTx, which is consistent with previously described platin-induced mutation signatures10,11,27 (Fig. 2e). To further investigate this, we called 96-channel COSMIC signatures for all samples (Extended Data Fig. 2e). Across subgroups from different treatment response and timepoints, we detected eight prevalent COSMIC signatures (Fig. 2f), of which all have been previously identified in EAC9,12,28,29,30,31. REPs showed a nonsignificant increase in S4 signature during treatment, which is dominated by C > A changes and thus most likely oxaliplatin driven27 (Fig. 2f,g).
Copy number evolution through treatmentEAC genomes typically have high CNA burden23,28,32; consistent with this our cases had median 69.4% genome altered (PGA, range 1.1–100%) (Fig. 3a). Copy number amplifications were seen frequently on chromosomes 1q, 3q, 5p, 7p, 8q, 19 and 20, while losses or loss of heterozygosity (LOH) predominated on chromosomes 3p, 4q, 5q, 9p and 17p, consistent with previous work10,28,33 (Fig. 3a).
Treatment-naive tumors from REPs and NRPs displayed similar proportions of amplifications, deletions, loss and LOH (Fig. 3b). Chemotherapy did not increase PGA, whereas RCTx, known to cause broad single- or double-strand breaks, led to higher PGA (t-test P value = 0.03) (Fig. 3b). Segments that changed their copy number state during treatment were significantly smaller than fragments that were clonally altered (Fig. 3c). Furthermore, private CNAs were smaller in NRPs than in REPs (t-test P value < 0.001).
We examined whether CNA dynamics correlated with early treatment response in EAC. REPs showed significant changes in CNA burden with a mean of 63% (range 36–87%) of genome changing its copy number status after the first cycle of chemotherapy, whereas copy number states in NRPs were slightly more stable with a mean of 33% (range 11–61%) of genome altering copy number state (Wilcoxon rank-sum test P value 0.009; Fig. 3d). We speculate that NRPs may have genomes that confer pre-existing resistance to the effect of neoadjuvant chemotherapy, whereas REPs have profiles that confer chemotherapy sensitivity, therefore the first dose of chemotherapy prompts further alteration.
Genetic and transcriptomic dynamics in EAC driversWe examined genetic alterations in 108 genes suggested to be drivers of EAC evolution (Supplementary Table 6 and Extended Data Fig. 3)33,34 and we show 15 common EAC driver genes in Fig. 3e. In 19 out of 27 patients, we observed that TP53 LOH or loss co-occurred with TP53 SNVs or indels, presumably leading to a loss of TP53 function. CDKN2A showed copy number loss or LOH in 21 out of 27 patients, which co-occurred with SNVs or indels in 5 patients (consistent with literature22). We observed amplifications containing MYC, KRAS, ERBB2, ERBB3, GNAS, TOP2A and PI3KCA and deletion of SMAD4. Of note, CNAs in driver genes were mostly present before treatment and persisted in their CNA category (amplification, LOH and loss) during treatment, although the exact copy number state could vary (Fig. 3e). Both REP and NRPs showed no significant change in the burden of genomic alterations of driver genes during treatment (Extended Data Fig. 4a–f). REPs showed a mean of 85.3 genetically altered putative driver genes at timepoint A, 92.4 at B and 76.7 at timepoint C (Extended Data Fig. 4b). NRPs had a mean of 77.1 genetically altered putative drivers at timepoint A, 65.4 at B and 94.0 at timepoint C; however, we did not detect any specific cancer gene that was enriched for CNAs, SNVs or indels in REPs versus NRPs (Fig. 3e and Extended Data Fig. 3). We note that work in colorectal cancer has shown that mutations that are drivers ‘on average’ in a cohort may not be a driver in an individual cancer16, and the driver status of CNAs is unclear, so we do not claim that all these driver alterations are necessarily important for EAC evolution.
We next explored gene expression changes in high-frequency drivers using our matched RNA-seq data. Significant expression changes were observed for most driver genes: expression tended to increase for GNAS, PIK3CA and SMAD4, decrease for ARID1A, CDKN2A, ERBB2, ERBB3, TOP2A, SMARCA4, KRAS and KMT2D and was stable for TP53, MYC, APC and AXIN1 (Extended Data Fig. 4g). We found little evidence that copy numbers drove expression, with correlations between copy number state and RNA expression in only a few genes (Extended Data Fig. 5a). Correlation analyses between SNVs in driver genes and their expression were only possible for TP53 and CDKN2A, as analyses for other drivers were underpowered. We observed significantly higher CDKN2A expression in CDKN2A mutated samples and significantly lower TP53 expression in TP53 mutated samples (Extended Data Fig. 5b).
Neoadjuvant treatment alters the EAC transcriptomeWe assessed gene and pathway expression changes during neoadjuvant treatment using RNA-seq in 26 samples from 10 NRPs and 54 samples from 17 REPs.
Principal-component analysis (PCA) using hallmark pathways35 separated samples from timepoint A and B from timepoint C (Fig. 4a); however, samples from REPs and NRPs were intermixed. Most patients with multi-region sampling showed pre- and post-treatment samples clustering on the opposite sides of PC1, with samples from timepoint B found in between (Extended Data Fig. 5c), suggesting a gradual change of the transcriptome over time.
Fig. 4: Neoadjuvant treatment leads to profound changes in gene and pathway expression in EAC.
a, PCA of single sample gene set enrichment analysis of cancer hallmark gene sets. Background shading represents a visual highlight. PC, principal component. b, Principal-component feature loadings (magnitude and direction) from PCA in a. Vectors are colored according to their biological classification of cancer hallmark gene sets. c, Hierarchical clustering with heatmap showing the significantly differentially expressed pathways between the two clusters (right cluster is predominantly samples from timepoint A/B and left cluster is predominantly timepoint C). Sample IDs and timepoints are annotated at the bottom of the heatmap. d, Enrichment analyses in KEGG pathways in REPs between timepoint A and C. Samples from REPs: n = 19 at timepoint A and n = 19 at timepoint C. e, Enrichment analyses in KEGG pathways in NRPs between timepoint A and C. Samples from NRPs: n = 8 at timepoint A and n = 10 at timepoint C. f, Enrichment analyses in KEGG pathways during chemotherapy (all samples at timepoint B versus REPs at timepoint C). Samples at timepoint B: n = 24 and REPs at timepoint C: n = 19. Dotted lines in d–f indicate significance level of Padj < 0.05 (false discovery rate (FDR)-adjusted P values). g, Plot shows immune cell composition based on CIBERSORT analysis in REPs and NRPs during neoadjuvant treatment. Samples from NRPs: n = 8 at timepoint A, n = 8 at timepoint B, n = 10 at timepoint C; Samples from REPs: n = 19 at timepoint A, n = 16 at timepoint B, n = 19 at timepoint C. sig., significant; diff., differentiation.
Hallmark pathways were grouped into ‘classes’ according to their biological function (‘oncogenic’, ‘immune’, ‘stromal’ and ‘cellular stress’)36. PCA loading assessment showed that samples from timepoint A and B were enriched for oncogenic pathways, whereas samples from timepoint C were enriched in immune and stromal pathways as well as selected oncogenic pathways (KRAS, Hedgehog and WNT signaling; Fig. 4b). We identified hallmark genes that were on average significantly differentially expressed between pre/early-treatment samples and samples at the end of neoadjuvant treatment, and performed hierarchical clustering of all samples using these genes. Expectedly, and consistent with PCA analysis, the dendrogram separated into two groups (Fig. 4c): group 2, containing most samples from timepoint A/B, was enriched for ‘oncogenic’ acting pathways, such as MYC, cell cycle associated pathways, DNA repair and MTORC signaling (Fig. 4c); and group 1, including mostly samples from timepoint C, showed significant enrichment of epithelial–mesenchymal transition (EMT) and stemness-associated WNT signaling and promoters of stem cell-like state such as TGF-β signaling and hypoxia. Moreover, immune pathways such as IL6 and IL2 signaling and inflammatory response and oncogenic KRAS and PI3K-AKT-MTOR signaling were significantly enriched in the post-treatment group (Fig. 4c).
Pathway enrichment between pre- and post-treatment samples in REPs and NRPs showed significant upregulation of WNT, PI3K, RAS, MAPK and JAK-STAT, indicating that both chemotherapy and RCTx lead to major and similar transcriptomic changes in tumor cells (Fig. 4d,e). Immune-related pathways were also significantly altered during treatment in REPs (Fig. 4d,e). Further, there was significant upregulation of immune activation pathways in post-treatment samples after CTx (Fig. 4f and Extended Data Fig. 5d), whereas post-treatment samples after RCTx showed no significant changes in immune-related pathways.
We used immune deconvolution tools to delineate cellular composition changes from RNA-seq data. Using CIBERSORT37, we observed a gradual increase in absolute numbers of immune cells during neoadjuvant treatment in REPs and NRPs (Fig. 4g); however, this may be due to lower tumor cellularity in post-treatment samples. Proportions of individual immune cell types stayed stable during treatment (Fig. 4g), with CD4+ and CD8+ cells comprising 40–50% of all immune cells. Other deconvolution tools (ConsensusTME and Syllogist) confirmed the gradual increase in immune infiltrates during treatment (Extended Data Fig. 6a,b) but there was variability in the estimated proportions of immune cell types.
In summary, cancer-relevant gene expression programs significantly changed during treatment, with enrichment of developmental programs such as EMT, stemness-associated WNT signaling and promoters of stem cell-like state such as TGF-β signaling and hypoxia, despite infrequent clonal replacement. Our data therefore suggest that cancer cells alter their phenotype without clonal replacement and that phenotypic plasticity might underly these observations.
Immune escape correlates with treatment responseNeoantigens were called from WES data on 22 samples from 10 NRPs and 48 samples from 17 REPs. We did not observe any significant changes in the neoantigenic mutation burden during neoadjuvant treatment (Fig. 5a,b and Extended Data Fig. 6c). Next we examined whether neoantigens were subject to selection (immune editing). We observed no change in proportions between immunogenic and total mutations during neoadjuvant treatment (Fig. 5c), indicating no enhanced negative selection of neoantigenic mutations during treatment. Subclonal neoantigenic mutational burden was not significantly different between pre- and post-treatment samples (Fig. 5d and Extended Data Fig. 6d) and most patients had comparable proportions of neoantigenic SNVs on the clades of their phylogenetic tree (Fig. 2d), indicating that neoantigenic subclones are not removed during treatment.
Fig. 5: Increasing immune escape during neoadjuvant treatment correlates with poor treatment response.
a–d, Violins showing the neoantigenic mutational burden during neoadjuvant treatment in all samples (a), stratified by treatment response (b), expressed as a proportion of total SNVs (c) and stratified by clonality (d). Clonal and subclonal neoantigenic mutational burden during neoadjuvant treatment. Mutations of each sample were classified as clonal or subclonal based on the copy number (CN) and cellularity-adjusted CCF. e, Distribution of neoantigenic SNVs based on their copy number states. The CN-normalized proportion of neoantigenic SNVs in each CN segment was calculated. f, Expression of neoantigens during treatment. g,h, Neoantigen expression in EAC according to immune infiltration score for CD8+ T cells (g) and CD4+ T cells (h). i, Presence of HLA-LOH, PD-L1 overexpression and B2M mutations in individual samples from NRPs (left) and REPs (right). Samples from individual patients are separated by vertical black lines. PD-L1 overexpression was defined as PD-L1 expression >2 s.d. from the mean of all treatment-naive samples. j, Proportion of early and late occurrence of genetic and nongenetic immune escape in cohort of n = 27 patients. Genetic immune escape refers to mutations or LOH in HLA or B2M mutations, whereas PD-L1 overexpression represents transcriptomic immune escape. P value calculated by the two-sided chi-squared test (P = 0.003). k, PD-L1 expression during neoadjuvant treatment. l, Proportion of immune escaped samples and their escape mechanism stratified by treatment response in NRPs (n = 17 samples) and REPs (n = 47 samples) with matching WES and RNA-seq data. m, Proportion of samples with HLA-LOH stratified by treatment response in NRPs (n = 22 samples) and REPs (n = 48 samples). P values in j–m are calculated by the two-sided chi-squared test. P values in all other panels are calculated by a two-sided Wilcoxon test, unless stated otherwise. Amplif., amplification; I.E., immune escape; overexpr., overexpression.
Next, we explored the relationship between CNAs and neoantigens. We hypothesized that gains of alleles carrying antigenic mutations were likely to experience negative selection, and so expected that gained alleles would be relatively depleted for neoantigens. To test this, we calculated the copy number-normalized proportion of neoantigens in each CNA segment. Diploid regions showed a ratio of ~1, whereas gains (balanced and unbalanced) were significantly depleted for neoantigens and regions of copy number loss were weakly enriched for neoantigens (Fig. 5e).
We hypothesized that transcriptional downregulation of neoantigens during treatment might also underlie immune evasion and potentially mediate treatment response. Counter to our hypothesis, we detected a significant increase in neoantigen expression during treatment (Fig. 5f). High neoantigen expression correlated with high CD8+ and CD4+ cell infiltration (Fig. 5g,h), suggesting that tumor cells with a high neoantigen expression were indeed recognized as ‘nonself’ and attracted immune cells. This can be explained if tumors subsequently develop stronger immune escape mechanisms during treatment or that the immune infiltrate becomes nonfunctional during treatment.
To test this, we first looked for tumor-cell-mediated immune escape mechanisms38 (LOH or mutations in HLA, B2M mutations or programmed death-ligand 1 (PD-L1) and pathways or immune cells associated with immune suppression). Genetic immune escape mechanisms such as HLA-LOH or B2M mutations were detected significantly more often before treatment (early), whereas transcriptomic PD-L1 overexpression occurred mostly during and after neoadjuvant treatment (late) (Fig. 5i–k). Increased expression of PD-L1 may represent a mechanism of rapid adaptation that is positively selected during treatment. Moreover, RNA-seq deconvolution revealed a significant increase in immune-suppressive M2-macrophages during treatment in NRPs and an increase in signaling pathways associated with immune suppression such as TGF-β, Il2-STAT5 and Il6-Jak-STAT3 signaling in both REPs and NRPs (Extended Data Fig. 6e–j).
We examined the correlation between immune escape and treatment response. Samples from NRPs were more often immune escaped than REPs, suggestive of a role for the immune system in potentiating the chemotherapy treatment response (Fig. 5l). The main immune escape mechanism in NRPs was HLA-LOH, occurring in 46% of NRPs and only in 13% of REPs (Fig. 5m). Our data suggest that immune escape has an important role in treatment resistance, highlighting that immunotherapy could help to circumvent resistance to standard treatment.
A distinct tumor microenvironment defines treatment responseWe assessed the cellular organization of the immune microenvironment using multiplex IMC on 24 ROIs from 16 NRP samples and 42 ROIs from 27 REP samples. We quantified expression of 19 markers, representing canonical lymphoid and myeloid immune populations, together with tumor cell markers (Fig. 6a,b and Extended Data Fig. 6k).
Comments (0)