Mice
C57BL/6 CD45.1+ and CD45.1 × CD45.2 young (8 weeks old) and old (80–105 weeks old) female mice were bred and maintained in house. For all in vivo experiments, host C57BL/6 CD45.2+ female mice (8 weeks old) were purchased from EnVigo laboratories (C57BL/6OlaHsd). Donors and recipients of adoptive T cell transfers were sex-matched. Mice were housed at 22 °C with 55% relative humidity on a 12-h light–dark cycle. Mice were fed ad libitum with Safe-150 chow. All animal experiments were performed in the animal facility in Epalinges at the University of Lausanne (UNIL), as approved by the veterinary authorities of the canton of Vaud and performed in accordance with Swiss federal law (VD3572).
Cell lines
B16-HER2-mK2 and Phoenix ECO cells were a kind gift from G. Coukos (UNIL) and were cultured in RPMI 1640-Glutamax medium supplemented with 10% heat-inactivated FBS and 1% penicillin–streptomycin. EL4-mCD19 cells were a kind gift from M. L. Davila (Moffitt Cancer Center) and were cultured in RPMI 1640-Glutamax medium supplemented with 10% heat-inactivated FBS and 1% penicillin–streptomycin.
Preparation of murine CAR-T cells
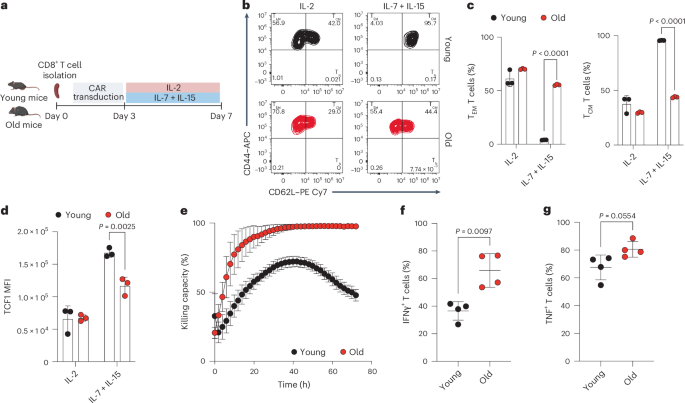
HER2-directed CAR containing a 41BBz costimulatory domain was cloned in the MSGV retroviral transfer vector as described previously13,30. For some experiments, an shRNA for silencing murine Cd38 was cloned in the HER2_41BBz vector. For retrovirus production, Phoenix ECO cells were transfected with HER2 CAR plasmid and pCL-Eco-packaging plasmid using TurboFect transfection reagent (LifeTechnologies) in OptiMEM medium (Thermo Fisher). After 48 h and 72 h, supernatants were recovered and virus was collected by ultracentrifugation (Beckman Avanti J-26). Spleens from wild-type CD45.1 or CD45.1 × CD45.2 mice were smashed through a 70-μm cell strainer. CD8+ T cells were purified using the EasySep mouse CD8+ T cell isolation kit (StemCell), according to the manufacturer’s instructions. CD8+ T cells were plated at a concentration of 0.5 × 10⁶ cells per ml and activated with Activator CD3/CD28 Dynabeads (Thermo Fisher) at a 2:1 bead-to-cell ratio in the presence of recombinant murine IL-2 (10 IU per ml; PeproTech). T cells were maintained in RPMI 1640-Glutamax medium supplemented with 10% heat-inactivated FBS, 1% penicillin–streptomycin, 5 μM 2-mercaptoethanol (Gibco) and sodium pyruvate (Gibco). T cells were transduced 24 h and 48 h after activation using 48-well plates precoated with RetroNectin (20 μg ml−1; Takara). After overnight coating at 4 °C, 48-well plates were blocked for 30 min with 2% BSA in PBS, followed by a PBS wash before adding the concentrated retroviruses. Retroviruses were centrifuged for 90 min at 2,000 rcf and 32 °C. Then, T cells were added on top of the viruses and centrifuged for 10 min at 300 rcf and 25 °C. On day 3, activation beads were removed and T cells were expanded using either mouse IL-2 or human IL-7 and IL-15 (10 ng ml−1; Miltenyi Biotec). T cell media and cytokines were replaced on day 5 and transduction efficacy was assessed on day 7. Metabolic and phenotype analyses, as well as ACT for in vivo experiments, were always performed on day 7 unless otherwise stated in the figure legend. Where stated, CAR-T cells were treated with NMN (1 mM; Sigma Aldrich), 78c (200 nM; Sigma Aldrich) and/or olaparib (5 μM; Lubio Science) on days 3 and 5 after activation.
Flow cytometry
The following conjugated antibodies were used for murine experiments: CD3ε–PercP Cy5.5 (clone 145-2C11, 100328, Biolegend, 1/50) or PB (clone 17A2, Department of Oncology, UNIL, 1/100), CD4–PE Cy5 (clone RM4-5, 15-0042-82, eBioscience, 1/100), CD8β–BUV661 (clone 53.6.7, 376-0081-82, Thermo Fisher, 1/100), CD45.1–PE (clone A20.1, 12-0453-82, Biolegend, 1/1,000), CD45.2–BUV395 (clone 104, 363-0454-82, Thermo Fisher, 1/50), CD44–APC (clone IM.781, 103012, Biolegend, 1/100), CD62L–PECy7 (Mel-14, 25-0621-82, eBio, 1/1,000), Thy1.1–BV605 (clone OX-7, 202537, Biolegend, 1/100), CD38–APCCy7 (clone 90, 102728, Biolegend, 1/200), PD1–BV605 (clone 29F.1A12, 135220, Biolegend, 1/200) or PD1–AF647 (clone 29F.1A12, 135230, Biolegend, 1/200), TIM3–BV421 (clone RMT3-23, 119723, Biolegend, 1/200), LAG3–PercP eFluor710 (clone C9B7W, 46-2231-82, Thermo Fisher, 1/200), TOX–PE (clone REA473, 130-120-716, Miltenyi Biotec, 1/50), IFNγ–APC (clone XMG1.2, 17-7311-82, Thermo Fisher, 1/200) and TNF–FITC (clone MP6-XT22, 506304, Biolegend, 1/200). TCF1 (clone C63D9, 2203S, Cell Signaling, 1/200) was stained with an unconjugated antibody. An additional staining was performed with secondary goat anti-rabbit IgG (4412S, Cell Signaling, 1:250). The following conjugated antibodies were used for human experiments: CD3–BV711 (clone UCHT1, 300464, Biolegend, 1/200), CD4–BV605 (clone OKT4, 317438, Biolegend, 1/200), CD8–APC (clone SK1, 344722, Biolegend, 1/200), CCR7–BV421 (clone G043H7, 353208, Biolegend, 1/100), CD45RA–PE TexasRed (clone MEM-56, MHCD45RA17, Thermo Fisher, 1/50), CD62L–PercP Cy5.5 (clone DREG-56, 304824, Biolegend, 1/200) and CD38–AF700 (clone HIT2, 303524, Biolegend, 1/200).
For assessment of intracellular markers, cells were fixed and permeabilized using FoxP3 fixation and permeabilization buffer (00-5523-00, eBioscience). For live–dead discrimination, live/dead Aqua or live/dead NIR kits were used (L34957 and L10119, LifeTechnologies). To assess mitochondrial activity and mitochondrial size, cells were stained with TMRM (T668; 25 nM) and MitoTracker Green (M7514; 100 nM) for 30 min at 37 °C. For cytokine staining, T cells were restimulated using anti-CD3ε-coated plates for 4 h in the presence of brefeldin A (420601, BioLegend, 1/1,000). For pH2AX staining, cells were stained upon fixation and permeabilization using the PECy7-conjugated anti-H2A.X (S139) antibody for 1 h at 4 °C (613420, Biolegend). The samples were acquired using the CytoFLEX S (Beckman Coulter), CytoFLEX LX (Beckman Coulter) or Aurora (Cytek Biosciences). Data analysis was performed using FlowJo (version 10.9.0).
In vivo CAR-T experiments
For the HER2_41BBz-B16 model, B16-HER2 (105) cells were subcutaneously injected on the right flank of 8-week-old C57BL/6 CD45.2+ mice. After 9 days, mice were exposed to sublethal irradiation (5 Gy) followed by one round of intravenous CAR-T cell transfer (2–3 × 10⁶ cells per mouse) performed on day 10. Before the transfer, mice were randomized to have comparative tumor volumes. For the mCD19_28z-EL4 model, EL4-mCD19 cells (5 × 10⁵) cells were subcutaneously injected into the right flank of 8-week-old C57BL/6 CD45.2+ mice. After 6 days, mice were exposed to sublethal irradiation (5 Gy) followed by one round of intravenous CAR-T cell transfer (3 × 10⁶ cells per mouse) performed on day 7. Before the transfer, mice were randomized to have comparative tumor volumes. Mice were monitored three times a week and tumor length (L; greatest longitudinal measurement) and width (W; greatest transverse measurement) were measured with a caliper. Tumor volumes (V) were calculated using the formula: V = (L × W2)/2. Mice were killed at endpoint by CO2 and, where indicated, tumors, spleens and lymph nodes were collected. As permitted by the Swiss federal law, a maximal tumor size of 1,000 m3 was reached. In some cases, this limit was exceeded on the last day of measurement and the mice were immediately killed. No statistical methods were used to predetermine sample sizes but our sample sizes are similar to those reported in previous publications23,61. Data collection and analysis were not performed blind to the conditions of the experiment.
Construction of CD38 OE vector
Murine CD38 complementary DNA was synthesized and flanked with the restriction enzymes Not1 and SalI, which were cloned into a retroviral MSCV vector containing a Thy1.1 promoter. The construction of the CD38 OE vector was performed by GenScript Biotech. The sequence can be found in Supplementary Table 2.
EM
Young and old naive CD8+ T cells were sorted using the EasySep mouse naive CD8+ T cell isolation kit (StemCell). For the analysis, EM was performed as described previously62. Sorted cells were fixed in their culture medium with glutaraldehyde (EM Sciences) at a final concentration of 2.5% in phosphate buffer (0.1 M PB pH 7.4; Sigma) for 10 min at room temperature (RT). As noted previously, they were directly postfixed by a fresh mixture of glutaraldehyde 2.5%, osmium tetroxide 1% (EM Sciences) and potassium ferrocyanide 1.5% (Sigma) in PB for 1 h at RT. The samples were then washed three times in distilled water and spun down in low-melting-point agarose 2% in H2O (Sigma), left to solidify on ice, cut into 1-mm3 cubes and dehydrated in acetone solution (Sigma) at graded concentrations (30%, 40 min; 50%, 40 min; 70%, 40 min; 100%, 1 h twice). This was followed by infiltration in Epon (Sigma) at graded concentrations (Epon 1:3 acetone, 2 h; Epon 3:1 acetone, 2 h; Epon 1, 1–4 h; Epon 1, 1–12 h) and finally polymerized for 48 h at 60 °C in oven. Ultrathin sections of 50 nm were cut on a Leica Ultracut (Leica Mikrosysteme) and picked up on a copper slot grid (2 × 1 mm; EM Sciences) coated with a PEI film (Sigma). Sections were poststained with uranyl acetate 2% (Sigma) in H2O for 10 min, rinsed several times with H2O followed by Reynolds lead citrate in H2O (Sigma) for 10 min and rinsed several times with H2O. Micrographs were recorded with a transmission EM instrument (Philips CM100, Thermo Fisher Scientific) with a TemCam-F416 digital camera (TVIPS). Image analysis and quantification were carried out using ImageJ software (version 2.16.0). The number of mitochondria per cell was quantified. For assessing mitochondrial cristae, each dot represents the crista number in one mitochondrion from one high-magnitude EM image of a live cell.
Seahorse XFe96 analysis
OCRs were determined using a Seahorse Bioanalyzer XFe96. Briefly, CD8+ T cells were resuspended in Seahorse XF basic medium supplemented with 10 mM glucose, 1 mM sodium pyruvate and 2 mM glutamine (pH 7.4, at 37 °C). CD8+ T cells were plated in a Cell-Tak-coated (22.4 μg ml−1) Seahorse XFe96 microplate (2 × 10⁵ cells per well). The injection ports were loaded with 1 μM oligomycin, 2 μM carbonyl cyanide-p-trifluoromethoxyphenylhydrazone (FCCP) and 0.5 μM rotenone–antimycin. During sensor calibration, cells were incubated in a 37 °C non-CO2 incubator for 45 min. Data were analyzed using Seahorse Wave (version 2.4.3).
Killing assay
To determine the killing capacity of murine CAR-T cells, the IncuCyte ZOOM system was used. Specifically, 104 B16-HER2 cells containing the red fluorescent protein mK2 were plated in flat-bottom 96-well plates. After 4 h of incubation, young or old CAR-T cells expanded with IL-2 or IL-7 and IL-15 were added on top at a 2:1 effector-to-target ratio. Upon coculture, plates were placed immediately in the IncuCyte ZOOM system for 3 days. Killing capacity was determined by quantifying the red area and normalizing to negative controls (that is, B16-HER2 mK2 cells cultured in the absence of CAR-T cells). To evaluate the killing capacity of human CAR-T cells upon multiple rechallenges, 103 NALM6–GFP cells were seeded in a flat-bottom 96-well plate and CAR-T cells were added at an effector-to-target ratio of 1:4. Subsequently, 105 NALM6–GFP cells were added every 2–3 days for repeated tumor challenges. The cytotoxic activity of CAR-T cells was monitored over 23 days by measuring the GFP signal density (objects per mm²) using the IncuCyte ZOOM system.
Metabolomics
The intracellular level of different metabolites was determined by performing LC–MS/MS analysis. For metabolite extraction, cell lysates were extracted by the addition of methanol and H2O (4:1), followed by homogenization with ceramic beads in the Cryolys Precellys 24 sample homogenizer. Homogenized extracts were then centrifuged for 15 min at 4,000g and 4 °C and the resulting supernatant was collected and evaporated to dryness in a vacuum concentrator. Dried extracts were resuspended in methanol and H2O before LC–MS/MS analysis. Raw LC–MS/MS data were processed using the Agilent Quantitative analysis software. Raw data can be found in Supplementary Table 1.
NAD ELISA
For NAD and reduced NAD (NADH) quantification, the NAD/NADH quantitation kit (SigmaAldrich) was used. For each sample, 1 × 10⁶ cells per sample were collected and the manufacturer’s instructions were followed.
mtDNA and nuclear DNA (nDNA) measurement
DNA was isolated using the DNeasy kit (Qiagen), according to the manufacturer’s instructions. To determine the mtDNA-tonDNA ratio, qPCR was performed using Power SYBR green master mix (Thermo Fisher) and analyzed on the 7900HT system (Applied Biosystems) to estimate the relative values for mtDNA (COX1) and nDNA (NDUFV1).
Forward COX1: 5′-TGCTAGCCGCAGGCATTAC-3′
Reverse COX1: 5′-GGGTGCCCAAAGAATCAGAAC-3′
Forward NDUFV1: 5′-CTTCCCCACTGGCCTCAAG-3′
Reverse NDUFV1: 5′-CCAAAACCCAGTGATCCAGC-3′
In vitro exhaustion model
CD8+ T cells were isolated and activated using plates coated with Ultra-LEAF anti-mouse CD3e (3 μg ml−1, Biolegend) and soluble Ultra-LEAF anti-mouse CD28 (1.5 μg ml−1, Biolegend). After 3 days, cells were washed and expanded for 4 days in the presence of IL-7 and IL-15. On days 7, 9 and 11, CD8 T cells were restimulated using CD3-coated plates. Fresh medium and IL-7 and IL-15 were added to the wells at the time of restimulation. Where indicated, cells were treated with NR (1 mM) on days 7, 9 and 11. Phenotypic and functional readouts were performed on day 12.
Preparation of human CAR-T cells
Human blood samples were obtained from healthy young donors (aged 25–28 years) and elderly donors (aged 66–70 years). To generate CAR-T cells, CD3+ T cells were negatively isolated using the RosetteSep human T cell enrichment cocktail (StemCell, 15061). T cells were treated with ACK lysis buffer (Gibco, A10492-01) and resuspended in RPMI 1640 medium (Gibco, 21875158) supplemented with 10% FBS, 1% penicillin–streptomycin, 1 mM sodium pyruvate (Gibco, 11360-070) and 10 mM HEPES (Gibco, 15630-056). For stimulation, T cells were cultured with CD3/CD28-activating Dynabeads (Gibco, 11132D) at a 1:1 bead-to-cell ratio. The following day, T cells were transduced with the hCD19_41BBz (FMC63 scFv) or hCD19_CD28z lentiviral vector at a multiplicity of infection of 4. Recombinant human IL-2 (Proleukin, Roche) or a cytokine combination of IL-2, IL-7 (Peprotech, 200-07) and IL-15 (Peprotech, 200-15) was added every other day to a final concentration of 30 IU per ml and 10 ng ml−1, respectively. Cells were counted and fed every 2 days until day 10, after which they were cryopreserved. All T cell functional assays were conducted in media without cytokines. For the generation of CAR-T cells from participants with melanoma, 2 × 10⁵ frozen PBMCs from young (aged 40–44 years) and elderly (aged 79–84 years) donors were seeded in a round-bottom 96-well plate and processed as described above.
Donations from healthy volunteers were approved by the Comission Cantonale d’Ethique de la Recherche Genève (CCER). Samples from participants with cancer were taken from a biobank supported by the study protocol CCER 2016-01237. Written informed consent was obtained from all individuals.
Reanalysis of public single-cell RNA sequencing (scRNA-seq) data
An scRNA-seq dataset of human baseline PBMCs from 20 participants with LBCL was obtained from the Gene Expression Omnibus (GSE197268). Metadata on age and response to therapy were obtained from the supplementary material of the associated publication49. To exclude low-quality cells and outliers, the following quality control filters were applied on the scRNA-seq data: percentage of mitochondrial genes < 25%, number of detected genes = 300–5,000, number of UMIs = 500–20,000 and log10 genes per UMI > 0.6. Raw counts were normalized using a standard log1p normalization implemented in Seurat (version 5.0.1)63. Broad cell types for each scRNA-seq sample were predicted using the scGate tool and its default PBMC model64. CD8 T cell subtypes were annotated using ProjecTILs65 and a published reference map of human CD8 T cell subtypes66. Gene signatures for NAD metabolism and DNA repair were downloaded from MSigDB67 under the ‘Gene Ontology biological process’ subset. On the basis of these gene sets, signature scores were calculated using the UCell method with default parameters68. Statistical comparisons (Wilcoxon test) were performed at the sample level by averaging signature scores for each participant and cell type. To assess the expression of CD38 in the context of markers of stemness and exhaustion, we interrogated two multistudy reference maps of murine65 and human66 tumor-infiltrating T cells. For each T cell subtype, we calculated the normalized average expression of CD38, HAVCR2, TOX and TCF7.
Statistical analysis
All statistical analyses were performed using GraphPad Prism version 10.0.3. The sample size (n) is stated in each figure legend together with the statistical test adopted. Data are shown as the mean ± s.e.m. P values < 0.05 were considered significant. Data distribution was assumed to be normal but this was not formally tested. All statistical tests used were two-sided.
Reporting summary
Further information on research design is available in the Nature Portfolio Reporting Summary linked to this article.


Comments (0)