
Remember me


The study complied with all relevant ethical regulations regarding the use of human material. Human DCCs were obtained from SLNs or regional LNs of patients with melanoma and control skin-draining LNs were obtained from patients without melanoma (no. 07-079 and 18-948-101, ethics committee of the University of Regensburg). Human peripheral blood mononuclear cells were obtained from a healthy donor (no. 20-1991-101, ethics committee of the University of Regensburg) and human tumor-free lung samples were obtained from patients with lung cancer (no. 2701-2015, ethics committee of Medical School Hannover). Written informed consent was obtained from all participants. Participants provided explicit consent for the inclusion of information listed in Table 2 and Source data. Participants did not receive any compensation for their involvement in this study.
Cell linesMelDCC lines were derived from DCC xenografts or directly propagated in vitro as described previously2. Patient origin was verified by short tandem repeat (STR) analysis (Cell-ID, Promega), melanoma origin was verified by a surgical pathologist and genotype was verified by CNAs. The NCI-H1975 cell line was obtained from the American Type Culture Collection and the HeLa cell line was a gift from T. Hehlgans (Leibniz Institute for Immunotherapy). Both lines were authenticated using STR profiling. MelDCC, NCI-H1975 and HeLa cells were cultured in RPMI 1640 with 10% FBS, 2 mM l-glutamine and 1% penicillin–streptomycin (P/S) (all Pan-Biotech). Adult human epidermal melanocytes (Lonza) were cultured in MGM-4 with supplements and 1% P/S and used at passage 1 for scRNA-seq. All cells were maintained at 37 °C and 5% CO2 in humidified conditions and tested for Mycoplasma by PCR.
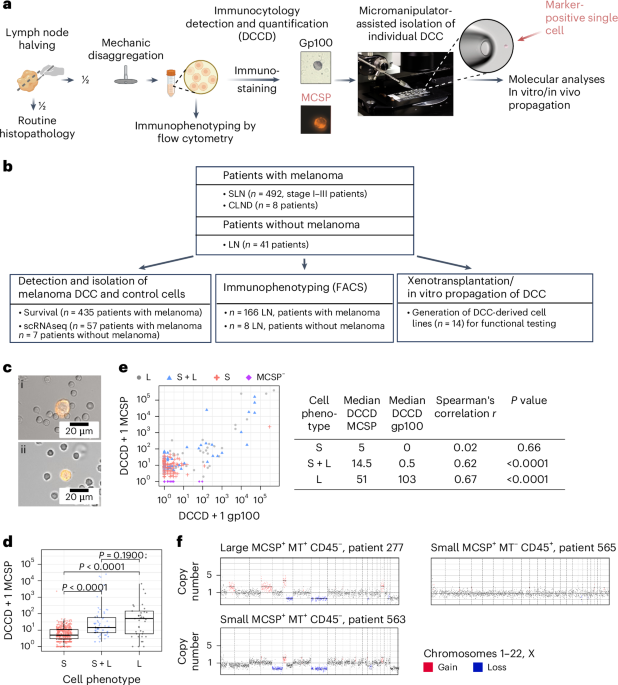
LN disaggregation and ICQuantitative IC with primary antibodies to gp100 and MCSP (clone 9.2.27) was performed on unfixed SLN tissue following SLN biopsy or regional LN removal as described previously2,17,18. LNs were defined as gp100+ or MCSP+ if they contained at least one positive cell. The number of positive cells per million lymphocytes (DCCD) was recorded as DCCDgp100 or DCCDMCSP. MCSP+ cells were isolated using a micromanipulator (Eppendorf PatchMan NP2, Eppendorf) and RNA and genomic DNA were extracted using WTA and WGA, respectively. Images of MCSP+ cells were acquired on Axiovert 200M (Zeiss) or IX81 (Olympus) microscopes.
For multiparameter immunofluorescence staining for MCSP, CD74 and Melan A, SLN cell suspensions were stained on adhesion slides. After blocking with 300 µl per spot of human TruStain FcX and 5% BSA in PBS for 30 min at room temperature (RT), slides were sequentially stained with primary and secondary antibodies and reagents in 5% BSA in PBS with 150 µl per spot for 30 min (secondary antibodies and reagents) or 60 min (primary antibodies) at RT. Slides were washed three times for 3 min each with PBS between staining steps. Slides were first stained with an unconjugated anti-human MCSP (clone LHM2) antibody, followed by goat anti-mouse IgG1 AF546. Free binding sites of the goat anti-mouse IgG1 antibody were blocked with 5% mouse serum in PBS, followed by staining with anti-human Melan A biotinylated antibody and anti-human CD74 APC antibody. In the final steps, slides were stained with streptavidin AF488, followed by DAPI for 10 min at RT, and fixed with 1% formaldehyde in PBS for 5 min at RT. Slides were stored at 4 °C until image analysis. Images were acquired with an IX81 (Olympus) microscope using identical settings for all samples. Fluorescence intensity quantification for Melan A and CD74 was performed using ImageJ (Fiji). All primary and secondary antibodies and staining reagents are listed in Supplementary Table 8.
Patient survival analysisKaplan–Meier survival curves were generated using the survfit function (survival_3.3-1)52. A univariable proportional hazard model was applied to patient features (age, gender, MT status, log10 DCCDMCSP, log10 DCCDgp100, N status, thickness and ulceration) using coxph (survival_3.3-1). For multivariable proportional hazard models, only features selected according to selectCox function (pec_2022.05.04) were visualized with ggforest (survminer_0.4.9).
IHC and CODEXIHC was performed on LNs and tissue microarrays of primary tumors and metastases using anti-HMB45 and anti-MCSP (clone 9.2.27) antibodies. Staining was automated (Ventana Benchmark ULTRA autostainer with OptiView DAB detection kit) or manual (standard protocol with antigen retrieval in Tris–EDTA buffer at 120 °C for 5 min).
For CODEX multiplexed imaging of LNs with low DCCD, 2.5-µm sections of formalin-fixed paraffin-embedded LN blocks with incipient metastatic colonization were prepared, with every second slide stained for Melan A or MCSP (clone 9.2.27) on a Ventana Benchmark ULTRA autostainer using the OptiView DAB detection kit (Roche Diagnostics), according to the manufacturer’s instructions. One of the remaining slides in between (closest to the Melan A IHC staining with the best tumor single cells and clusters) was selected for CODEX staining and performed as described previously53. Following deparafinization, hydration and antigen retrieval (Dako Target Retrieval Solution, pH 9, 108 °C, 20 min), autofluorescence was quenched by bleaching (100 ml of 1× PBS + 18 ml of H2O2 30% + 3.2 ml of 1 M NaOH) between two light-emitting diode (LED) plates (Aibecy A5 Ultra Bright 25,000-lux LED light box-tracing pads, AliExpress) for 45 min twice as per the manufacturer’s instructions (Akoya Biosciences). After washing with 1× PBS for 5 min and 1× Tris-buffered saline with Tween-20 for 10 min (Cell Marque), nonspecific binding was blocked with 200 µl of CODEX buffer S2 with 0.065 mg ml−1 mouse IgG (Biozol), 0.065 mg ml−1 rat IgG (Biozol), 0.43 mg ml−1 sheared salmon sperm DNA (Invitrogen, Thermo Fisher Scientific) and a mixture of nonfluorescent CODEX oligonucleotides (Biomers) at a final oligonucleotide concentration of 0.5 mM. After 1 h, slides were incubated overnight at 4 °C with DNA-conjugated antibodies in CODEX buffer S2 (anti-human Melan A, anti-human CD3, anti-human IFNG, anti-human TIM3 and anti-human CD47). Slides were washed with CODEX buffer S2 for 2 min, fixed with CODEX buffer S4 containing 1.6% paraformaldehyde for 10 min, treated with ice-cold 100% methanol (Thermo Fisher Scientific) for 5 min and subjected to final fixation with 3 mg ml−1 BS3 fixative (Thermo Fisher Scientific) in PBS for 20 min. Slides were stored in CODEX buffer S4 at 4 °C. CODEX imaging was performed on PhenoCycler Fusion 2.0 (low DCCD) or BZ-X810 microscope with PhenoCycler (high DCCD). Overlay images were created after visual assessment of antibody staining using ImageJ (Fiji, version 2.0.0) and QuPath (version 0.5.1)54, respectively, for high-DCCD and low-DCCD tissues. Details on all primary and secondary antibodies and staining reagents are given in Supplementary Table 8.
WGA and analysis of CNAsSingle-cell genomic DNA was collected during WTA by precipitation and amplified using the Ampli1 WGA kit (Menarini Silicon Biosystems) or previously described methods23,55. CNA analysis was performed with the Ampli1TM LowPass kit (Menarini Silicon Biosystems) as per the manufacturer’s instructions. Libraries were sequenced on MiSeq (Illumina) or NovaSeq6000 (Illumina). Genomic coordinates were analyzed with the LowPass bioinformatics pipeline (Menarini Silicon Biosystems) or HIENA (Fraunhofer ITEM) and submitted to Progenetix (version 4.0, 2022)56 for cumulative frequency plot generation.
WTAmRNA isolation from single cells, reverse transcription and global amplification of first-strand complementary DNA were performed as described previously22,23. WTA product quality was assessed by a multiplex housekeeping gene expression assay comprising three genes4. High quality was assigned to cells with at least one of three transcripts detected.
Marker expression analysis in single cellsEndpoint PCR for specific transcripts was carried out on all WTA products as previously described57. Primers are given in Supplementary Table 9.
Next-generation sequencing mRNA library preparation and sequencingNext-generation sequencing (NGS) mRNA libraries were prepared from single MCSP+ cells from patients with and without melanoma and human epidermal melanocytes (Lonza) as previously described4. Libraries were quantified on the MiSeq System (MiSeq reagent kit v2, 50 cycles, Illumina), pooled and sequenced on an Illumina NovaSeq6000.
RNA from 1–2 million MelDCC cells was extracted using the RNeasy mini kit (Qiagen) and libraries were generated using the TruSeq Stranded mRNA library prep kit (Illumina). Sequencing was performed (SE-82-10) on a NextSeq550 at the NGS Core Unit, Leibniz Institute for Immunotherapy and University Medical Center Regensburg.
scRNA-seq data analysisFastQC (version 0.11.5)58 was used for sequence quality evaluation. After trimming with BBDuk, STAR (version 2.6.1c)59 and RSEM (version 1.3.1)60 were used to get expected gene counts on the basis of GRCh38. Cells with fewer than 50,000 counts, >70% mitochondrial gene counts or <1,000 expressed genes were excluded and genes expressed in at least three cells were kept. Seurat (version 4.1.0)61 was used for data processing with the NormalizeData and FindVariableFeatures tools for expression normalization and identification of top 2,000 variable genes. Principal component (PC) analysis dimensions were selected on the basis of Elbowplot and JackStrawplot. Testing of 5, 10, 15, 20, 25 and 30 dimensions revealed that 20 is the minimal number of dimensions to separate melanocytes from DCCs. RunUMAP was performed on the top 20 PCs with the parameters umap.method ‘umap-learn’ (n.epochs = 1,000, mindist = 0.1 and n.neighbors = 15). Clusters were computed using FindNeighbors (reduction = ‘umap’, k.param = 10 and dims = 1:2) and FindClusters (resolution = 0.2).
Cluster robustness and consistency was assessed with clusterMany (clusterExperiment, version 2.12.0)62 using multiple algorithms (pam, clara, kmeans, spectral, hierarchicalK and tight), ks = 3:10 and PCs 5, 10, 15, 20, 25 and 30, yielding 288 clustering schemes. Consensus of pairwise cell clusters under 288 clustering schemes was calculated and compared to clusters given by Seurat graph-based clustering. Bluster (version 1.2.1) was used to confirm cluster modularity through UMAP and PC analysis. FindAllMarkers (test.use = ‘mast’) was used to detect cluster-specific markers. DEGs (upregulated) with P < 0.01 were input for Enrichr63 on the basis of the Gene Ontology 2015 and MSIGDB_HALLMARK 2020 (ref. 64) databases.
Gene expression signature scores for melanoma DCC subtypes were calculated with AUCell65 (aucMaxRank = 0.3) and rescaled (R package scales, version 1.2.0). Pseudotime and cell trajectories were inferred with slingshot (version 2.0.0)39, using UMAP and Seurat clusters, with the cluster that had the lowest DCCD (cluster 0) serving as the start. Trajectories were verified by constructing an Elastic structure66 in ElPiGraph.R (version 1.0.0) and UMAP with parameter NumNodes = 6 and GetSubGraph with parameter structure = ‘end2end’. NumNodes = 6 was the minimal number that could bind all Seurat clusters in one tree. The node with lowest DCCD level was set as the tree root. For each lineage retrieved, pseudotime was calculated. Signature score changes along pseudotime were tested (gam, version 1.20.1) with chi-square P values in each lineage for both slingshot and ElPiGraph.
Metacells were created for each cluster using scWGCNA (version 0.0.0.9000)67 (construct_metacells, k = 5, reduction = ‘pca’) and a weighted gene coexpression network was built with the top 1,000 variable genes using WGCNA (version 1.70-3)68 (blockwiseConsensusModules, consensusQuantile = 0.3, power = 10, networkType = signed, mergeCutHeight = 0.2 and minModuleSize = 50). Power = 10 was chosen according to pickSoftThereshold. Respective gene modules were obtained accordingly.
Module preservation was assessed with WGCNA (version 1.70-3; modulePreservation and resampling), which confirmed the high conservation of detected modules. Only modules with an ANOVA P value < 0.001 between clusters were processed for pathway enrichment analysis using the same method as for DEG gene set analysis.
CONICsmat (version 0.0.0.1)69 inferred CNAs using gene expression at chromosome arm levels, including 200 melanocytes70 as controls. Chromosome arms with Bayesian information criterion difference > 70 and adjusted P value < 0.01 were kept as CNA candidates and posterior probabilities of CNA were binarized at threshold = 0.9.
SCENIC (version 1.2.4)65 inferred transcription factor gene-regulatory networks using GENIE3 and motif database (https://resources.aertslab.org/cistarget/databases/old/homo_sapiens/hg19/refseq_r45/mc9nr/gene_based/hg19-tss-centered-10kb-7species.mc9nr.feather). Regulatons with highest scores > 0.3 in ≥5 cells with scores > 0.1 were kept. Differentially activated transcription factors for each cluster were identified using a pairwise t-test (Benjamini–Hochberg-adjusted P value < 0.05).
Cells from this project were integrated with LN and skin cell types from the Human Cell Atlas71 using SCTransform and IntegrateData from the Seurat package, followed by PC analysis and UMAP (dims = 1:30).
Bulk RNA-seq data analysis of MelDCCGene counts were calculated as for scRNA-seq and normalized using log counts per million. Gene set variation analysis72 with the marker gene set for each melanoma DCC cluster (0–4) was used to obtain DCC cluster signature scores for each MelDCC line.
Isolation of sEV by dUCA total of 2 × 10⁶ MelDCC cells were seeded in T175 cell culture flasks and cultured for 3 days. On day 3, medium was removed, cells were washed with PBS and 30 ml of FBS-free medium was added. Conditioned medium was collected after 48 h and subjected to dUC as previously described40. Briefly, the medium was centrifuged at 300g for 10 min at 4 °C to remove dead cells and debris, followed by 2,000g for 20 min at 4 °C (2 K pellet) and then 10,000g (10K pellet) for 40 min at 4 °C and finally at 100,000g (100K pellet) for 90 min at 4 °C. Respective pellets were pooled, washed in 35–50 ml of PBS and recentrifuged at the same speed at which they were initially harvested before resuspending in 1 µl of PBS (1 × 10⁶ EV-producing cells) at the time of supernatant harvesting.
SECThe 100K pellets from dUC were pooled before the last washing step and loaded onto an SEC Column (Plastic XXL column with 45 ml of 2% BCL agarose bead standard, 50–150 µm, with plastic XXL column frit, Agarose Bead Technologies). The column was connected to a Zetasizer Nano ZS (Malvern Panalytical) for real-time particle detection, allowing separation of the vesicle and protein fractions. The vesicle fraction was concentrated at 100,000g for 90 min at 4 °C. The protein fraction was concentrated using a Macrosep Advance 3K device (Pall) at 3,200g (30 min, 4 °C) followed by Vivaspin 500 (molecular weight cutoff: 5,000, PES, Sartorius). Both fractions were characterized by WB and used in CD8 T cell assays.
Label-free MS-based proteomicsThe 100K EVs of MelDCC 10a (duplicates) were resuspended in 50 µl of gel-aided sample preparation (GASP) buffer (50 mM Tris-HCl pH 8.8, 6 M urea, 1.5 M thiourea and 4% SDS) and sonicated for 15 cycles 60/30 (BioRuptor pico, Diagenode). After centrifugation (20,000g, 15 min, 4 °C), proteins were quantified using the SERVA purple protein assay (SERVA Electrophoresis). Sample preparation for liquid chromatography–MS followed the GASP protocol73 with slight modifications74. Then, 2 µg of peptides were spiked with 100 fmol of RePLiCal (Polyquant) and analyzed on an Eksigent ekspert nanoLC 400 system coupled to a TripleTOF 5600+ MS instrument (SCIEX). Samples were loaded onto a YMC-Triart C18 trap column (3-μm particle size, 0.5-cm length; YMC America) at a flow rate of 10 µl min−1 for 5 min (isocratic conditions A: 0.1% formic acid and 0.1% acetonitrile). Peptides were then separated on a reverse-phase column (YMC-Triart C18, 1.9-µm particle size, 120 Å, flow rate of 5 µl min−1, 40 °C) using a 94-min binary acetonitrile gradient (3–40% B in 87 min, 40–45% B in 7 min). Duplicate samples were run twice.
SWATH acquisition was performed with a 50-ms full MS scan (400–1,000 m/z) followed by 60 SWATH windows (35 ms each, 230–1,500 m/z). Libraries were generated from pooled samples measured in data-dependent acquisition mode (DDA, TOP20 method) with a full MS scan for 250 ms and MS/MS scans for 50 ms each. MS/MS spectra from the DDA runs were searched against the respective UniProt database (Swissprot-human 12-2021) using ProteinPilot 5.0 and imported into PeakView 2.1 using the SWATH MicroApp 2.0, allowing six peptides per protein and six transitions per peptide. Raw values were normalized to total intensity.
Immuno-WBWB was performed as previously described4 with minor modifications. Protein (cell lysates) or sEVs were denatured by incubation for 5 min at 95 °C in the presence of 1× Leammli buffer (Bio-Rad) containing 10% 2-mercaptoethanol (Sigma-Aldrich) and loaded on 10% or 4–20% Mini-PROTEAN TGX Stain-Free protein gels (Bio-Rad). Incubation of blotted PVDF membranes with primary antibodies was performed overnight. Details on all primary antibodies, secondary antibodies and staining reagents are given in Supplementary Table 8. After washing, blots were incubated with horseradish-peroxidase-conjugated anti-mouse, anti-rat or anti-rabbit IgG secondary antibodies for 2 h at RT. Protein bands were visualized using SuperSignal West Pico PLUS chemiluminescent substrate (Thermo Fisher Scientific). Chemiluminescence was recorded by a ChemiDoc MP imaging system (Bio-Rad) and analyzed with Image Lab (version 6.1, Bio-Rad).
NTA measurement of sEVFor the detection of CD81+ sEVs, 1 µl of 100K pellet and 1 µl of anti-human CD81 PE/Dazzle 594 were incubated for 30 min at RT in 10 µl of PBS (Gibco) and then diluted 1:10,000 in PBS to a final volume of 10 ml. For sEV enumeration from MelDCC culture supernatants, cells were incubated in EV production medium (serum-free RPMI without phenol red (Gibco), 2 mM l-glutamine and 1% P/S; all Pan-Biotech). After 48 h, the supernatant was harvested, centrifuged at 300g for 10 min and filtered (0.22 µm). sEVs were stained with 1 µl of a 1:10 dilution of CMG plasma membrane stain (Thermo Fisher Scientific) in PBS (100 µl, 1 h, RT) and then diluted 1:25–30 in PBS to 1 ml. For EV analysis, default software settings were used. Each measurement scanned 11 cell positions, capturing 30 frames per position. In scatter mode, sensitivity was set to 80 and trace length was set to 15; for CD81-stained or CMG-stained particles, the 500-nm long-pass fluorescence filter was used with sensitivity set to 96 and trace length set to 7 or 10. Data were analyzed with ZetaView Software (version 8.05.14 SP7) and FlowJo (version 10.8.1).
TEM imaging of EVEVs were isolated from MelDCC cells by dUC and diluted 1:10 using HEPES-buffered saline (pH 7.4). Then, 4 µl of this suspension were applied onto hydrophilized, carbon-coated grids (400-mesh, Cu; Plano) for 30 s, blotted with filter paper and stained with a 1% uranyl acetate solution for 30 s, before final blotting and air-drying. For freeze-etching, undiluted EVs were processed with unidirectional platinum and carbon shadowing (45°, 1.5 nm) and carbon coating (90°, 15 nm) as described previously75. Samples were screened and imaged with a 200-kV field-emitter TEM (JEM-2100F, JEOL) and a 16-megapixel complementary metal–oxide–semiconductor camera (F416, TVIPS). Microscope and imaging parameters were controlled using SerialEM software (version 3.8)76. Images were recorded at magnifications from ×2,000 up to ×40,000, resulting in pixel sizes from 5.5 nm to 0.28 nm.
Inhibition of EV biogenesis by macitentanMelDCC 6 were incubated with DMSO or 50 µM macitentan (Selleckchem) in culture medium. After 24 h, the medium was replaced with serum-free medium for sEV production or serum-free medium without phenol red for NTA. The medium was supplemented with DMSO or macitentan and cells and supernatants were harvested after 48 h. Cells were analyzed by flow cytometry for cell surface expression of CD155, CD276 and CD81. sEVs for WB analysis were isolated by UC and the fold change in sEV numbers in the native culture supernatant was analyzed by NTA.
Topology assessment of EV-associated ICLssEVs (0.5 × 10⁶ MelDCC cells) were incubated for 2 h at 37 °C in 50 mM Tris-HCl pH 8.0 with 5 mM CaCl2 (Sigma-Aldrich) in the presence or absence of 0.125 mg ml−1 PK (Promega or Roche) with or without 1% Triton X-100 (Sigma-Aldrich). Proteinase activity was inhibited by incubation with 1 mM PMSF(Sigma-Aldrich) for 10 min at RT before WB against CD155, CD276, CD81 and GAPDH was performed.
CRIPSR–Cas9 genetic engineeringKnockout of CD155 and CD276 in MelDCC 10 was performed with 1.5 μM Cas9 protein (Alt-R S.p. HiFi Cas9 nuclease V3), 1.8 μM trans-activating CRISPR RNA (Alt-R CRISPR–Cas9 tracrRNA), 1.8 μM CD276 AD crRNA (Hs.Cas9.CD276.1.AD), PVR AB crRNA (Hs.Cas9.PVR.1.AB) or control crRNA, 1.8 μM Alt-R Cas9 electroporation enhancer (all IDT) and 100,000 cells per transfection. Transfection was performed using the NEON transfection instrument (Thermo Fisher Scientific; settings: 1,600 V, 10-ms pulse width, three pulses).
Induction of dedifferentiation in MelDCC linesA total of 1×10⁶ MelDCC cells were seeded in T25 flasks 1 day before 500 U of IFNG (Peprotech) in PBS and 0.1% BSA was added to the culture medium. IFNG-containing medium was replaced every 2–3 days for 28 days. On day 28, the medium was switched to EV production medium (phenol-red-free and serum-free RPMI (Gibco), 2 mM l-glutamine and 1% P/S; all Pan-Biotech). Control cells were plated at 400,000 cells per T25 flask and the medium was switched to EV production medium after 48 h. After another 48 h, supernatants were collected from both IFNG-treated and control cells for NTA or sEV isolation by dUC. Flow cytometry was performed on seeded MelDCC at days 0, 28 and 30 and cell counts were recorded at harvest.
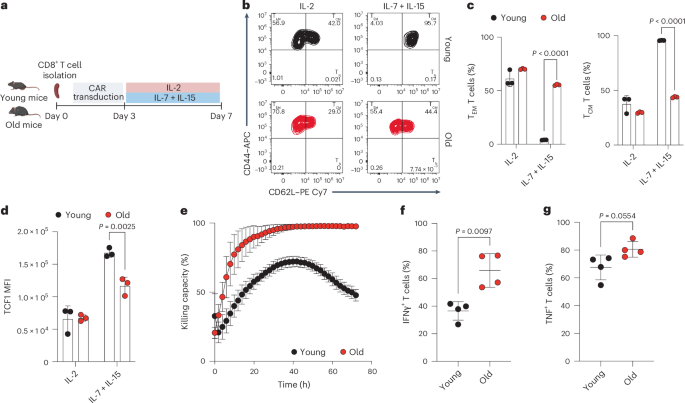
CD8 T cell isolationPeripheral blood mononuclear cells were prepared by density gradient centrifugation (60% Percoll solution, GE Healthcare) and cryoconserved. Upon thawing with 100 µg ml−1 DNAse I (Roche), cells were rested overnight at 2 × 10⁶ cells per well in a 96-well plate in 200 µl of RPMI 1640 medium with 10% FBS, 2 mM l-glutamine and 1% P/S (all Pan-Biotech), 100 mM HEPES (Sigma-Aldrich) and 0.1% 2-mercaptoethanol (Thermo Fisher Scientific). The next day, cells were pooled and CD8 T cells were isolated using the MojoSort Human CD8 T cell isolation kit (Biolegend) with LS columns (Miltenyi Biotec) and MACS buffer (PBS (Thermo Fisher Scientific), 0.5% BSA (Roche) and 2 mM EDTA (Thermo Fisher Scientific)) as per the manufacturer’s instructions.
Testing of CD8 T cell-inhibitory function of sEVsPolyclonal or MART127L26-35-specific CD8 T cells were labeled with 2 µM CFSE (eBioscience) for 10 min at 37 °C in PBS with 1% FBS. The reaction was stopped with RPMI 1640 with 10% FBS (all Pan-Biotech). A total of 1 × 10⁵ CFSE-labeled CD8 T cells per well were stimulated on 96-well plates coated with 2 µg ml−1 anti-CD3 (OKT3) and 2 µg ml−1 CD28 (CD28.2) antibodies (both Biolegend) in 200 µl of PBS and overnight at 4 °C. sEVs were added 18 h before or after stimulation in a total volume of 200 µl and a ratio of 50:1, if not indicated otherwise. To block the CD155–TIGIT interaction, anti-TIGIT neutralizing antibody or the isotype control (as listed in Supplementary Table 8) was added at a final concentration of 10 µg ml−1. On day 4, cultures were restimulated for 4 h with 1× cell stimulation cocktail including protein transport inhibitors (eBioscience) and analyzed for CFSE dilution and INFG and GZMB production by flow cytometry.
In vitro cytotoxicity assayCD8 T cells from an HLA A02:01 healthy donor were expanded using artificial antigen-presenting cells (aAPCs) loaded with MART127L26-35 as described previously77. To assess antigen-specific cytotoxicity, CD8 T cells were exposed to PBS or sEVs (50:1 ratio) before stimulation on anti-CD3/CD28-coated plates (2 µg ml−1). On day 4, CD8 T cells were mixed at a 1:1 ratio with 25,000 target and control cells and plated on a round-bottom 96-well plate. T2 target cells were labeled with CFSE (2 µM; eBioscience), preloaded with 10 µg ml−1 MART127L26-35 peptide (1 h at 37 °C, 5% CO2) and washed. Unloaded T2 cells labeled with 2 µM CellTrace violet (eBioscience) were used as nontarget controls. After 24 h, T2 cells were analyzed by flow cytometry. Specific cytotoxic lysis was calculated as follows: (1 − (r with T cells/r without T cells) × 100), where r = (% CFSE+/% CellTrace violet+).
PCLSsPCLSs were prepared from tumor-distant tissue after tumor resection as described previously78. Lung lobes were filled with 4% low-melting-point agarose (Thermo Fisher Scientific), punched into 8-mm cores and sliced into 300-µm-thick slices using a Krumdieck tissue slicer (Alabama R&D). PCLSs were cultured in 48-well plates (one slice per well in 250 µl of DMEM F/12 (Thermo Fisher Scientific)) and treated with anti-CD3/CD28 beads (Thermo Fisher Scientific) 18 h before adding sEV or 5 µM pimecrolimus (Merck). Flow cytometry was performed 6 days after treatment on dissociated PCLS (six replicated per condition). Tissue was minced and dissociated with 2.2 mg ml−1 collagenase D and 0.055 mg ml−1 DNase I (Roche) in DMEM F/12 with 1% P/S (Thermo Fisher Scientific), shaken for 1 h at 37 °C and filtered through 100-µm sieves to obtain single-cell suspensions.
Uptake of CFSE-labeled sEV by CD8 T cellsThe 100K pellets were labeled with 20 µM CFSE (eBioscience) for 2 h at 37 °C. The reaction was stopped with 10% EV-free FBS (120,000g for 23 h) for 10 min at RT. PBS was processed identically as a control. CFSE-labeled sEVs or volume-matched PBS was added in a ratio of 50:1 and 10:1 to 1 × 10⁵ CD8 T cells stimulated for 18 h with 2 µg ml−1 plate-bound anti-CD3/CD28 antibodies (Supplementary Table 8). After 24 h at 37 °C and 5% CO2, cells were analyzed by flow cytometry for CFSE positivity.
Flow cytometrySingle-cell suspensions of LNs or PCLSs, CD8–EV cocultures or MelDCC lines were incubated for 5 min at 4 °C with PBS and 10% AB serum (Bio-Rad) or human TruStain FcX receptor blocking solution (Biolegend) to reduce nonspecific antibody binding, stained with fluorescence-labeled antibodies for 30 min at 4 °C and washed once with PBS, 2% FBS and 0.01% NaN3. For intracellular cytokine staining, cells were fixed for 20 min at RT with FluoroFix (Biolegend) and permeabilized with intracellular staining permeabilization wash buffer (Biolegend). Intranuclear staining was conducted with the Foxp3 transcription factor staining buffer set (Thermo Fisher Scientific). Cells were stained for 30 min using the antibodies and isotype controls listed in Supplementary Table 8. Fixable viability dye eFluor 780 (eBioscience) or the Zombie NIR fixable viability kit (Biolegend) was used for live–dead cell discrimination. Cells were analyzed on an LSR II, FACSCelesta, FACSymphonyA5 SORP or Cytoflex (Beckman Coulter) machine and data were analyzed with FloJo (version 10.8.1; Tree Star). Sorting of CD155 and CD276 MelDCC lines after CD155 and CD276 CRIPSR–Cas9 knockout was performed with a FACSAria IIu cell sorter (BD Bioscience).
Statistics and reproducibilityNo statistical method was used to predetermine the sample size. For RNA-seq experiments, sample size was determined by the availability of high-quality RNA from DCCs and control cells in LNs to ensure sufficient power for meaningful patterns. For other experiments, sample numbers were based on practical considerations to reliably address primary objectives. Post hoc assessments confirmed that sample numbers were adequate for valid results.
To ensure reproducibility, independent replicate experiments were performed, including biological and technical replicates where applicable. Technical replicates were used to assess measurement accuracy, assay reproducibility and technical variability. Data were analyzed using multiple statistical approaches to confirm robustness. All replication attempts were successful, with consistent results across biological samples and experimental conditions. WB analyses were performed in at least two independent biological replicates and microscopy images were obtained from multiple replicates, with consistent findings observed.
Statistical analyses were conducted using GraphPad Prism (version 9.3.1) and R (version 4.1.0). Data distribution was assumed to be normal but this was not formally tested. Data distribution (individual data points) is shown when possible and always for n ≤ 10. Differences in mean values were assessed using Student’s t-test or a one-way ANOVA with post hoc tests. Univariable, multivariable and survival analyses were performed using Cox regression and the Mantel–Cox log-rank test. All tests were two-sided, with P < 0.05 considered statistically significant. DCCD values were log-transformed as DCCD = log10(DCCD + 1).
Patient samples were included in the study according to availability, which was determined by factors such as the number of isolated cells, RNA quality and available survival data. No preassigned groupings or patient selections were made before data analysis. As the study did not involve controlled experimental conditions or treatment interventions, random allocation of samples was not applicable. No formal covariate-based randomization was performed, as the study addressed the natural variability within the available patient samples. For in vitro experiments involving cell lines, sEVs and CD8 T cells, the samples were first pooled and then allocated to the various experimental conditions.
All patient samples were pseudonymized according to EU General Data Protection Regulation (GDPR) and pseudonyms linked clinical and outcome data. Investigators were blinded to patient disease progression and clinical status until final bioinformatics analysis. This ensured that the data collection and initial analysis were conducted without bias related to disease state. For post-RNA-seq analyses, such as survival analysis, reidentification was necessary to link clinical outcomes to the molecular data. Blinding was not feasible for survival analysis, as patient outcomes were required to interpret these findings; however, bias was minimized by the use of pseudonymized data during the initial steps of the experiment. For cell line, sEV and T cell experiments, investigators were not blinded because different treatments were required for separate groups.
Reporting summaryFurther information on research design is available in the Nature Portfolio Reporting Summary linked to this article.
Comments (0)