
Remember me
To assess the number of FIKK orthologues in each Laverania species, the word ‘FIKK’ was entered into the search engine of the PlasmoDB website (www.PlasmoDB.org) (release 66) selecting Plasmodium adleri G01, Plasmodium billcollinsi G01, Plasmodium blacklocki G01, Plasmodium falciparum 3D7, Plasmodium gaboni G01, Plasmodium praefalciparum G01 and Plasmodium reichenowi CDC genomes. To assess syntenicity, the JBrowse genome browser of PlasmoDB was used, selecting the ‘Syntenic Sequences and Genes (Shaded by Orthology)’ track. The P. falciparum 3D7 genome was used as a reference to evaluate whether the chromosome sequences from the other Laverania species were complete. ‘No genome information’ signifies that chromosome sequence was not available in the database, probably due to degradation of telomeric regions.
Field genomes FIKK pseudogenization analysisTo identify genetic variants in fikk genes, a global dataset of clinical P. falciparum samples was examined with bcftools, using the Pf3K project release 5 (ref. 29). Out of the 2,483 P. falciparum clinical samples of diverse geographical origin, 2,085 with high-quality data were selected (>80% of the genome covered with ten or more reads). For each isolate genome, fikk pseudogenes were defined by the presence of at least one internal STOP codon variant with an alternative allele frequency greater than 0.5 (Alt reads divided by total number of reads of that position). To identify natural genomic deletions that include fikk genes, deleted genes were defined as 95% of the gene sequence with coverage under three reads. The large majority of deleted FIKK kinases had zero reads over the entire length of the gene, with the rest of the genome being over 10× coverage (typically ~50×). As a complementary approach, we made use of the microarray transcriptomic data from Mok et al.73. From the 2,085 genome samples, 693 transcriptomes from the same isolates were also available. A negative log2 value was defined as ‘no expression’.
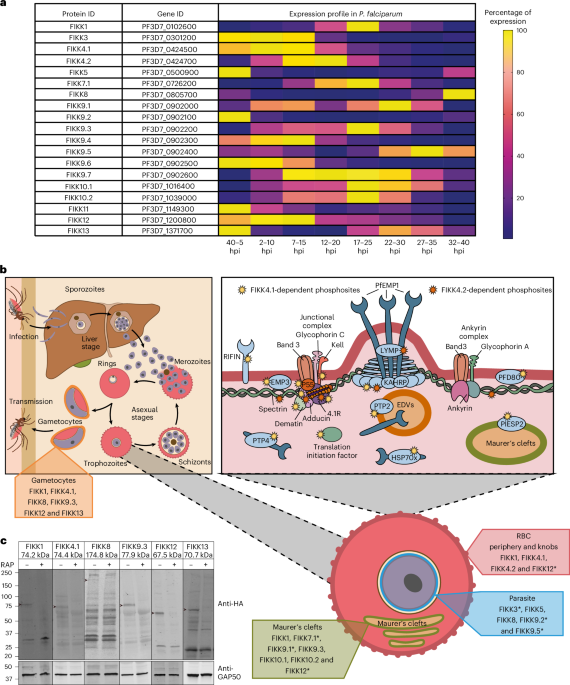
FIKK percentage of expression heat mapExpression data were taken from Hoeijmakers et al.74 RNA-sequencing dataset available on PlasmoDB release 66 (www.PlasmoDB.org). The dataset gives a transcript per kilobase millions (TPM) value for eight different time windows throughout P. falciparum 48 h asexual replication cycle ((40–5 hours post-infection (hpi)), (2–10 hpi), (7–15 hpi), (12–20 hpi), (17–25 hpi), (22–30 hpi), (27–35 hpi) and (32–40 hpi)). Percentage of expression was calculated for each P. falciparum FIKK kinase using the following formula \(\frac\,\mathrm\,\mathrm\,\mathrm\,\mathrm)}\,\mathrm\,\mathrm)}\times 100\). Percentage of expression values were then plotted in GraphPad Prism10 and represented as a heat map with dark blue cells representing no expression and yellow cells representing 100% expression.
Human cellsHuman RBCs were acquired from the National Health Service Blood and Transplant service.
In vitro maintenance and synchronization of Plasmodium parasitesHuman erythrocytes infected with P. falciparum asexual stages were cultured at 37 °C in complete medium. Complete medium consists of 1 l RPMI-1640 medium supplemented with 5 g Albumax II (Thermo Fisher Scientific) to act as a serum substitute, 0.292 g l-glutamine, 0.05 g hypoxanthine, 2.3 g sodium bicarbonate, 0.025 g gentamycin, 5.957 g HEPES and 4 g dextrose. A haematocrit of 1–5% was used and the blood was from anonymous donors provided through the UK Blood and Transfusion service. According to standard procedures, parasites were grown in a gas atmosphere consisting of 90% N2, 5% CO2 and 5% O2 (ref. 75). Thin blood smears fixed in 100% methanol, air dried and stained with Giemsa were routinely used to assess parasitaemia and developmental stages by light microscopy. P. knowlesi parasites in the asexual RBC stages were cultured in complete medium supplemented with 10% human serum as described previously76. Parasite cultures were synchronized by Percoll (GE Healthcare) for isolation of mature schizont stages parasites. Purified schizonts were incubated in complete medium at 37 °C with fresh RBCs for 4 h in a shaking incubator. Any remaining schizonts were removed with a second Percoll purification leaving only tightly synchronized ring-stage parasites in the flask.
Gametocyte induction, culture, FIKK gene excision and collectionAn adapted version of previously described techniques was used to obtain synchronous gametocytes77. Briefly, highly synchronous ring-stage parasites at 8–10% parasitaemia were stressed by retaining half the spent culture medium and replenishing the rest with fresh complete medium. The following day, the stressed cultures were spun and the spent culture medium was replaced with complete media. Cultures were left shaking until the following day when all the schizonts had ruptured and reinvaded. A certain proportion of the reinvaded rings should have then committed to gametocytogenesis. These committed parasites were then split into two flasks and treated for 4 h at 37 °C with either 100 nM rapamycin (Sigma) or dimethyl sulfoxide (DMSO) (0.1% (v/v)) as described previously78. Parasites were then washed three times with complete medium and cultured in complete medium supplemented with 10% human serum. From this point onwards, parasite culture medium was exchanged daily with prewarmed complete medium supplemented with 10% human serum and heparin at 20 units per ml to prevent asexual growth. When a majority of stage III gametocytes could be seen on Giemsa smears, the cultures were submitted to Percoll purification allowing isolation of sexual stages which were lysed in 5× SDS sample buffer for western blot analysis of FIKK kinases expression.
ImmunoblottingParasites submitted to western blot analysis were first collected by Percoll purification. Then, 1 µl of parasite pellets were resuspended in 15 µl PBS, lysed with 5× SDS sample buffer (25 mM Tris–HCl pH 6.8, 10% SDS, 30% glycerol, 5% β-mercaptoethanol and 0.02% bromophenol blue) and denatured at 95 °C for 5 min. Samples were then subjected to SDS–PAGE, transferred onto a Transblot Turbo mini-size nitrocellulose membrane (Bio-Rad) and blocked overnight in 5% skimmed milk in PBS with 0.2% Tween 20 at 4 °C. For FIKK kinases expression in gametocytes (Fig. 1c), the membranes were probed with rat anti-HA high affinity (clone 3F10, 11867423001, Roche, 1:1,000) and rabbit anti-GAP50 (ref. 79) (a gift from Julian Rayner, 1:2,000) antibodies. For western blots investigating Adducin S726 phosphorylation (Fig. 6 and Supplementary Figs. 10 and 11), the membranes were probed with rabbit anti-Adducin pS726 (Abcam, ab53093, 1:1,500), rabbit anti-MAHRP1 (a gift from J. Rayner and L. Parish, 1:2,000), rabbit anti-GAP50 (1:2,000) or mouse anti-GAPDH (1:10,000) (monoclonal antibody 7.2 (anti-GAPDH), which was obtained from The European Malaria Reagent Depository (http://www.malariaresearch.eu), source Dr. Jana McBride80). For western blots assessing protein biotinylation by FIKK4.1 and FIKK4.2::TurboID (Supplementary Fig. 1b), the membranes were probed with rabbit anti-MAHRP1 (1:2,000) and mouse anti-V5 (Abcam, ab27671, 1:1,000). Following primary antibody staining, the membranes were incubated with the relevant secondary fluorochrome-conjugated antibodies (LI-COR, 1:20,000) or IRDye 800CW Streptavidin (926-32230, 1:2,000). The antibody reactions were carried out in 5% skimmed milk in PBS with 0.2% Tween 20 for 1 h in the dark and membranes were washed three times between each antibody staining in PBS with 0.2% Tween 20. After a final wash with PBS, the antigen–antibody reactions were visualised using the Odyssey infrared imaging system (LI-COR Biosciences).
Transcription evidence of PfFIKK kinases in sexual and mosquito stagesData were obtained from the Malaria Cell Atlas (www.malariacellatlas.org)31. The SmartSeq2 cell view was used and an FIKK kinase was considered expressed if at least two sample analysed showed an expression above 0.
Generation of FIKK::TurboID parasite linesFIKK::TurboID parasite lines were generated using CRISPR–Cas9. Briefly, suitable gRNAs for FIKK4.1 and FIKK4.2 were identified using the Eukaryotic Pathogen CRISPR guide RNA/DNA Design Tool81. A pair of complementary oligonucleotides corresponding to the 19 nucleotides closest to the identified PAM sequence was synthesized (Integrated DNA Technologies (IDT)), phosphorylated using T4 polynucleotide kinase, annealed and ligated into pDC_Cas9_hDHFRyFCU82 digested with BbsI. To generate compatible, sticky ends between the annealed primer pairs encoding the gRNAs and the BbsI digested vector, the forward oligonucleotide had 5′-ATTG added to the 19 nucleotides corresponding to the gRNAs, whereas the compatible oligonucleotide had a 5′-AAAC overhang added (Supplementary Table 13). This way, gRNAs targeting fikk4.1 and fikk4.2 genes were assembled using oligonucleotide pairs gRNA_4.1_310For/Rev and gRNA_4.2_235For/Rev, respectively. Repair templates containing a 5′HR, a recodonized sequence, a linker, a TurboID-coding sequence, a V5-tag and a 3′HR flanked by two XhoI restriction sites were ordered from GeneArt (Supplementary Table 13). For transfection, 60 µg repair template plasmid was linearized with XhoI for 4 h at 37 °C before inactivation at 80 °C for 20 min. Next, 20 µg of gRNA plasmid was added and the plasmid mixture was ethanol precipitated, washed and resuspended in 10 µl sterile TE buffer (10 mM Tris and 1 mM EDTA). In parallel, highly synchronized segmented schizonts (48 hpi) of NF54::DiCre parasites83 were collected by Percoll enrichment and washed once with complete medium. The DNA constructs in TE buffer were mixed with 90 µl P3 primary cell solution (Lonza) and used to resuspend 20 µl segmented schizonts, which were subsequently transferred to a transfection cuvette. Transfections were performed by electroporation using the FP158 program from an Amaxa 4D Electroporator machine (Lonza). Following transfection, the parasites were transferred to prewarmed flasks containing 2 ml complete medium and 300 µl fresh uninfected RBCs (uRBCs). After 40 min of gentle shaking at 37 °C, 8 ml complete medium were added to the flask. Transfected parasites were incubated for 24 h, then selection was performed with 2.5 nM WR99210 (Jacobus Pharmaceuticals) for 4 days. Following establishment of the transgenic lines, correct modification of the parasite genome was confirmed by PCR using the primers described in Supplementary Fig. 1a and Supplementary Table 13.
Phylogenetic treeAll FIKK amino acid sequences were retrieved from the UniProtKB84. Heavily truncated sequences (<200 amino acids) were removed manually. The full-length protein sequences were then aligned using the MAFFT L-INS-i algorithm85. Alignment positions where more than 20% of sequences contain a gap (-gt 0.8) were removed from the multiple sequence alignment using trimAl software86.
A maximum-likelihood estimate of the FIKK phylogeny was generated with IQ-TREE2 software87, using the ModelFinder parameter (-m MFP) to automatically detect the best evolutionary model88. Branch support for the maximum-likelihood phylogeny was assessed using 100 replicates of the Felsenstein bootstrap (-b 100)89. The phylogenetic tree was visualized using the ggtree package in R90 after removing homologues to the FIKK7.2 and FIKK14 pseudogenes.
The dN/dS analysis was performed in CodeML using a published protocol91,92. Codon alignments were generated using TranslatorX93. The phylogenetic tree was generated as described above. A global dN/dS ratio (M0 model) was first estimated across all branches and sites. A branch model was then performed to compare dN/dS ratios between exported and non-exported kinases.
Immunofluorescence assaysAir-dried blood films were fixed for 5 min in ice-cold methanol and subsequently rehydrated in PBS for 5 min. Slides were blocked in 3% (w/v) bovine serum albumin (BSA) in PBS containing kanamycin (50 µg ml−1) for 1 h and subsequently incubated with primary antibodies in 1% (w/v) BSA in PBS containing kanamycin (50 µg ml−1) for 1 h at room temperature. Primary antibodies dilutions were as follow: high affinity rat anti-HA (clone 3F10, 11867423001, Roche; 1:1,000), mouse anti-FIKK4.2 (1:1,000) (monoclonal antibody 126 (anti-FIKK4.2) obtained from The European Malaria Reagent Depository (http://www.malariaresearch.eu) source, Dr. Odile Mercereau-Puijalon17), rabbit anti-phosphoAdducin S726 (1:1,500) (ab53093, Abcam), rabbit anti-SBP1 (1:10,000) (gift from T. Spielmann94). After three washes with PBS, the coverslips were incubated with the relevant Alexa Fluor secondary antibodies (1:2,000 in PBS with 1% BSA) at room temperature for 1 h in the dark. After three final washes with PBS, the slides were mounted with Prolong Gold antifade reagent (Invitrogen) containing the DNA dye 4,6-diamidino-2-phenylindole (DAPI), covered with a coverslip and sealed with nail polish. Images were taken using a Ti-E Nikon microscope using a 100× objective at room temperature equipped with a light-emitting diode illumination and Orca-Flash4 camera. The images were processed using Nikon Elements software (Nikon).
Proximity labelling experimentsWe first performed a NF54-FIKK4.2::TurboID comparison at the peptide level. We then repeated the assay with NF54, FIKK4.1::TurboID and FIKK4.2::TurboID. Both experiments were performed following the same protocol and data from both experiments were combined.
Cell culture and lysisFor all experiments, NF54 wild-type (WT) parasites used as controls, FIKK4.1::TurboID and FIKK4.2::TurboID parasites were tightly synchronized to a 4 h window using Percoll. For each line, parasites were grown in biological triplicate in 200 ml of complete medium containing biotin (0.2 mg l− ≈819 nM) at at least 10% parasitaemia in 2 ml of blood, each replicate being cultured in blood coming from different donors. iRBCs were collected at late schizont stage (44–48 hpi) using Percoll. Subsequently, parasites were washed three times with 50 ml of complete medium and five times with 5 ml PBS. Parasites were then lysed in 8 M urea in 50 mM HEPES pH 8.0 containing protease inhibitors (cOmplete, Roche). Samples were further solubilized by sonication with a microtip sonicator on ice for three rounds of 30 s at an amplitude of 30%. Lysates were then clarified by centrifugation at 21,130g for 30 min at 4 °C. The protein concentrations were then calculated using a BCA protein assay kit (Pierce), first diluting 20 µl aliquots from all lysates 1:25 in H2O to reduce the concentration of urea and then following the instructions provided in the kit.
Protein digestionThen, 4 mg of each lysate was then reduced with 5 mM dithiothreitol (DTT) for 1 h at room temperature and subsequently alkylated in the dark with 10 mM iodoacetamide for 30 min at room temperature. Following alkylation, the lysates were diluted with 50 mM HEPES pH 8.0 to <2 M urea and digested overnight with trypsin (Promega) at 1:50 (enzyme:protein) at 37 °C.
Sep-Pak desaltingSamples were cooled on ice for 10 min before being acidified with trifluoroacetic acid (TFA; Thermo Fisher Scientific) to a final concentration of 0.4% (v/v) and left on ice for a further 10 min. All insoluble material was removed by centrifugation (21,130g, 10 min, 4 °C) and the supernatants were desalted on Sep-Pak C18 1cc Vac cartridges (Waters) in conjunction with a vacuum manifold. The columns were first washed with 3 ml acetonitrile, conditioned with 1 ml of 50% acetonitrile and 0.5% acetic acid in H2O, and then equilibrated with 3 ml of 0.1% TFA in H2O. The acidified samples were loaded, desalted with 3 ml of 0.1% TFA in H2O, washed with 1 ml of 0.5% acetic acid in H2O and finally eluted in 1.3 ml of 50% acetonitrile and 0.5% acetic acid in H2O. Each sample was then dried by vacuum centrifugation.
Charging protein G agarose beads with anti-biotin antibodiesA total of 60 µl of protein G agarose bead slurry (Thermo Fisher Scientific) were taken per sample. Beads were washed three times with 10 bead volumes of Biosite buffer95 (50 mM Tris–HCl pH 8.0, 150 mM NaCl, 0.5% Triton x100, pH 7.2–7.5) at 4 °C. According to the supplier’s recommendations, protein G agarose beads were functionalized with 100 µg antibodies per 100 µl slurry with two different anti-biotin antibodies (150–109 A, Bethyl Laboratories; ab53494, Abcam) by adding 300 µg of each antibody to the beads which were incubated rotating overnight at 4 °C.
ImmunoprecipitationSamples were dissolved in 1.5 ml biosite buffer on ice and the pH adjusted with 1–5 µl 10 M NaOH to 7–7.5 at 4 °C. Any undissolved material was removed by spinning at 21,130g, for 10 min at 4 °C and the peptide BCA assay (Pierce) was performed on the supernatant to determine the peptide concentration in each sample. Protein G agarose beads functionalized with anti-biotin antibodies were washed three times with 10 bead volumes (3 ml). Biosite buffer and equal amount of peptides per sample was added onto the antibody loaded beads (60 µl slurry per sample). The mixture was incubated rotating for 2 h at 4 °C. Beads were pelleted at 1,500g for 2 min at 4 °C and washed three times with 500 µl biosite buffer, once with 500 µl of 50 mM Tris–HCl pH 8.0 and three times with 500 µl H2O. Peptides were eluted from the beads by adding 50 µl of 0.2% TFA, gently shaken and spun at 1,500g for 2 min at 4 °C. Elution was repeated four times for a total volume of 200 µl.
Stage-tip desaltingAll samples were desalted before liquid chromatography–tandem mass spectrometry (LC–MS/MS) using Empore C18 discs (3 M). Briefly, each stage tip was packed with one C18 disc, conditioned with 100 µl of 100% methanol, followed by 200 µl of 1% TFA. The samples were loaded onto the stage tip in 200 µl of 0.2% TFA, washed twice with 300 µl of 1% TFA and eluted with 40 µl of 40% acetonitrile + 0.1% TFA. The desalted peptides were vacuum dried in preparation for LC–MS/MS analysis.
LC–MS/MSSamples were loaded onto Evotips according to the manufacturer’s instructions. After a wash with 0.1% formic acid in H2O, samples were loaded onto an Evosep One system coupled to an Orbitrap Fusion Lumos (Thermo Fisher Scientific). A PepSep 15 cm column was fitted onto the Evosep One and a predefined gradient for a 44 min method was used. The Orbitrap Fusion Lumos was operated in data-dependent mode with a 1 s cycle time, acquiring IT HCD (higher-energy collisional dissociation) MS/MS scans in rapid mode after an OT MS1 survey scan (R = 60,000). The target used for MS1 was 4E5 ions whereas the MS2 target was 1E4 ions. The maximum ion injection time utilized for MS2 scans was 300 ms, the HCD normalized collision energy was set at 32 and the dynamic exclusion was set at 15 s.
Data processingAcquired raw files were processed with MaxQuant v2.0.3.1 (ref. 96). The Andromeda97 search engine was used to identify peptides from the MS/MS spectra against Plasmodium falciparum (PlasmoDB_v46)13 and Homo sapiens (UniProt, 2020)84. Acetyl (Protein N-term), Biotin (K), Oxidation (M) were selected as variable modifications whereas Carbamidomethyl (C) was selected as a fixed modification. The enzyme specificity was set to Trypsin with a maximum of three missed cleavages. The minimum peptide length was set to six amino acids. Biotinylated peptides search in MaxQuant was enabled by defining a biotin adduct (+226.0776) on lysine residues as well as three diagnostic ions: fragmented biotin (m/z 227.0849), immonium ion harbouring biotin with a loss of NH3 (m/z 310.1584) and an immonium ion harbouring biotin (m/z 327.1849).
The precursor mass tolerance was set to 20 ppm for the first search (used for mass recalibration) and to 4.5 ppm for the main search. The datasets were filtered on posterior error probability to achieve a 1% false discovery rate on protein, peptide and site level. Other parameters were used as pre-set in the software. ‘Unique and razor peptides’ mode was selected to allow identification and quantification of protein in groups (razor peptides are uniquely assigned to protein groups and not to individual proteins). Intensity-based absolute quantification in MaxQuant was performed using a built-in quantification algorithm96 enabling the ‘Match between runs’ option (time window 0.7 min) within replicates.
Data analysisThe MaxQuant output files were processed with Perseus v1.5.0.9 (ref. 98). Modified peptides data were filtered to remove contaminants and IDs originating from reverse decoy sequences. Intensity-based absolute quantification intensities were log2 transformed and peptides with less than one valid value in total were removed. Non-biotinylated peptides (background) were also removed from the datasets. Additionally, peptides with intensities only in the NF54 samples were removed as they are likely to represent background binding to the beads. Replicates were grouped for each condition (NF54 and FIKK4.2::TurboID for the first experiment and NF54, FIKK4.1::TurboID and FIKK4.2::TurboID for the second experiment) and only peptides with at least two valid values in at least one group were conserved for further analysis. Data for the first experiment (NF54 – FIKK4.2::TurboID) and the second experiment (NF54 – FIKK4.1::TurboID – FIKK4.2::TurboID) are available in Supplementary Table 14.
NetworkThe network representation of the TurboID data (Fig. 2c) was generated using Cytoscape v3.10.1 (ref. 99). Proximal proteins were included in the network if they contained at least one peptide that was biotinylated in two or more of the three biological replicates from either the FIKK4.1 or FIKK4.2 TurboID assays. All proteins in the vicinity of FIKK4.1 or FIKK4.2 were annotated as potential kinase targets if they were found to be less phosphorylated upon knock out of the respective kinase, using data published in ref. 16. Regulated phosphosites on candidate substrates were scored against the FIKK4.1 or FIKK4.2 kinase specificity models shown in Supplementary Fig. 3, using a simple scoring function that outputs a normalized summation between 0 (minimum) and 1 (maximum)100. Data on protein proximity, target status and motif scores are given in Supplementary Table 7.
Recombinant protein expression and purificationThe DNA sequences coding for P. falciparum 3D7 and P. gaboni G01 FIKK kinase domains were obtained from PlasmoDB (https://plasmodb.org/plasmo/)13 and were codon optimized for E. coli expression (IDT)101 (see Supplementary Table 15 for recodonized FIKK kinase sequences). For FIKK4.2, blocks of low-complexity repeat sequences and the short low-complexity downstream sequence (amino acids 403–928) were removed as per ref. 17. Sequences were subsequently inserted into a pET-28a vector (Novagen) to produce a N-terminal thrombin cleavage His6 tag fusion (MGSSHHHHHHSSGLVPRGSHMASMTGGQQMGRGS, where the sequence in bold is the His6 tag, the underlined sequence is the thrombin site and the sequence in italics is the T7 tag). The insert sequence was verified by DNA sequencing. For expression in E. coli, BL21-Gold (DE3) cells (Stratagene) were transformed with pET-28a-FIKK vectors, grown over 2 days at 18 °C in ZYM-5052 media supplemented with 50 µg ml−1 kanamycin and collected by centrifugation. In a typical preparation, 10 g of cells were resuspended in 100 ml lysis buffer (50 mM Tris–HCl pH 7.5, 500 mM NaCl, 1 mM TCEP, 20 mM imidazole, 10 mM MgSO4, 10% glycerol and two protease inhibitor cocktail tablets (cOmplete, EDTA free, Roche)), lysed by sonication and clarified by centrifugation at 20,000g for 30 min at 4 °C. The supernatant was loaded into a 1 ml HisTrap column (GE Healthcare) and the bound proteins were eluted in 50 mM Tris–HCl pH 7.5, 500 mM NaCl, 1 mM TCEP, 300 mM imidazole and 10% glycerol. After concentration, the samples were loaded on a Hi-Load Superdex 200 16/600 column (GE Healthcare) equilibrated with 50 mM Tris–HCl pH 7.5, 250 mM NaCl, 1 mM TCEP and 10% glycerol. The fractions containing the different recombinant FIKK kinase domains were analysed by SDS–PAGE stained by Coomassie (Supplementary Fig. 2).
Peptide arraysOPAL and phosphoproteome peptide libraries synthesis was performed by the Francis Crick Institute Peptide Chemistry Science Technology platform as described previously37,102. Briefly, peptide arrays were synthesized on an Intavis ResResSL automated peptide synthesiser (Intavis Bioanalytical Instruments) by cycles of N(a)-Fmoc amino acids coupling via activation of the carboxylic acid groups with diisopropylcarbodiimide in the presence of ethylciano-(hydroxyamino)-acetate (Oxyma pure) followed by removal of the temporary α-amino protecting group by piperidine treatment. Subsequent to chain assembly, side chain protection groups are removed by treatment of membranes with a deprotection cocktail (20 ml 95% trifluoroacetic acid, 3% triisopropylsilane and 2% H2O) for 4 h at room temperature, then washing (4× dichloromethane, 4× ethanol, 2× H2O and 1× ethanol) before being air dried. For the phosphoproteome peptide libraries, the final product is a cellulose membrane containing a library of 11-mer peptides. Sequences of the peptides can be found in Supplementary Table 9. For the OPAL libraries, the final product is a cellulose membrane containing a library of 9-mer peptides with the general sequences: A-X-X-X-X-S-X-X-X-X-A, A-X-X-X-X-T-X-X-X-X-A or A-X-X-X-X-Y-X-X-X-X-A. For each peptide, 1 of the 20 naturally occurring proteogenic amino acids was fixed at each of the 8 positions surrounding the phosphorylated residue (S, T or Y), with the remaining positions, represented by X, degenerate (approximately equimolar amount of the 16 amino acids excluding cysteine, serine, threonine and tyrosine). Cellulose membranes were placed in an incubation trough and moisten with 5 ml ethanol. They were subsequently washed twice with 50 ml kinase buffer (20 mM MOPS, 10 mM magnesium chloride and 10 mM manganese chloride, pH 7.4; Alfa Aesar) and incubated overnight in 100 ml reaction buffer (kinase buffer + 0.2 mg ml−1 BSA (BSA Fraction V, Sigma) + 50 μg ml−1 kanamycin). The next day, the kinase buffer was removed and the membranes were incubated at 30 °C for 1 h in 30 ml blocking buffer (kinase buffer + 1 mg ml−1 BSA + 50 μg ml−1 kanamycin). After incubation, the blocking buffer was replaced with 30 ml reaction buffer supplemented with 300 μl 10 mM ATP and 125 μCi [γ-32P]-ATP (Hartmann Analytics). The reaction was started by adding 100 nM of the recombinant FIKK kinase domain studied and left to incubate for 20 min at 30 °C with gentle agitation. After incubation, the reaction buffer was removed and the membranes were washed 10× 15 min with 100 ml 1 M NaCl, 3× 5 min with 100 ml H2O, 3× 15 min with 5% H3PO4, 3× 5 min with 100 ml H2O and 2× 2 min with 100 ml ethanol. The membranes were left to air dry before being wrapped up in plastic film and exposed overnight to a PhosphorScreen. The radioactivity incorporated into each peptide was then determined using a Typhoon FLA 9500 phosphorimager (GE Healthcare) and quantified with the program ImageQuant (version 8.2, Cytiva LifeScience). Data corresponding to the ‘signal above background’ was used.
PWM generation from OPAL dataPWMs were constructed from the raw OPAL data using a standard approach presented in refs. 103,104. First, raw OPAL values for S, T and Y amino acids were replaced with average (median) values for each corresponding peptide position to control for the possibility of spurious phosphorylation in flanking region. The OPAL values were then normalized per position to give a mean PWM score of 1 per amino acid and a total score of 20 per position. The raw OPAL data from S, T and Y libraries were then combined to generate a S/T/Y PWM. This was achieved by summing OPAL scores (after correcting flanking S/T/Y scores) from each of the peptide libraries. The OPAL data were then normalized as before to yield a mean PWM score of 1 per amino acid and a total PWM score of 20 per position. The relative scores between S, T and Y at position were calculated by taking the ratio of the total OPAL scores for the S, T and Y libraries. For ease of visualization, the PWM logos display only amino acids with the scores above the arbitrary threshold of 2.5 using the software package ggseqlogo105. These PWM scores were then log2 transformed to generate heat maps of the matrix specificity scores.
FIKK13 peptide RaPID selectionIn vitro selections were carried out with Bio-His-FIKK13 following previously described protocols. Briefly, initial DNA libraries (including 6–12 degenerate NNK codons) were transcribed to mRNA using T7 RNA polymerase (37 °C, 16 h) (Thermo Scientific) and ligated to a puromycin linker primer ([5′Phos]CTCCCGCCCCCCGTCC[SP18][SP18][SP18][SP18][SP18]CC[Puromycin]) using T4 RNA ligase (30 min, 25 °C) (New England Biolabs). First round translation was performed on a 150 µl scale, with subsequent rounds performed on a 5 µl scale. Translations were carried out (30 min, 37 °C then 12 min, 25 °C) using a custom methionine(−) Flexible In vitro Translation system composed by PURExpress (ΔRF123) kit (New England Biolabs) solution B, an in-house solution A (50 mM HEPES–KOH pH 7.6, 2 mM ATP, 2 mM GTP, 1 mM CTP, 1 mM UTP, 20 mM creatine phosphate, 100 mM potassium acetate, 2 mM spermidine, 6 mM magnesium acetate, 1.5 mg ml−1E. coli tRNA mix (Roche) and 14 mM DTT) and additional ClAc-D-Tyr-tRNAfMetCAU (25 µM). Ribosomes were then dissociated by addition of EDTA (18 mM final concentration, pH 8) and the library mRNA reverse transcribed using MMLV RTase, Rnase H Minus. The reaction mixture was buffer exchanged into selection buffer (50 mM Tris pH 7.5, 50 mM NaCl, 2 mM DTT, 10 mM MgCl2, 1.5 µM ADP and 0.1% Tween) using 1 ml homemade columns containing pre-equilibrated Sephadex resin (Cytiva) before the addition of 2× blocking buffer (50 mM Tris pH 7.5, 250 mM NaCl, 2 mM DTT, 10 mM MgCl2, 1.5 µM ADP, 0.1% Tween, 4 mg ml−1 sheared salmon sperm DNA (Invitrogen) and 0.1% acetyl-BSA final (Invitrogen)). Libraries were incubated with negative selection beads (Dynabeads M280 streptavidin (Life Technologies)) (3× 30 min, 4 °C) followed by incubation with bead-immobilized His-bio-FIKK13 (200 nM, 4 °C, 30 min) before washing (3× 1 bead volume selection buffer, 4 °C) and elution of retained mRNA/DNA/peptide hybrids in PCR buffer (95 °C, 5 min). Library recovery was assessed by quantitative real-time PCR relative to a library standard, negative selection and the input DNA library. Recovered library DNA was used as the input library for the subsequent round. Following six rounds of selection, double-indexed libraries (Nextera XT indices) were prepared and sequenced on a MiSeq platform (Illumina) using a v3 chip as single 151 cycle reads. Sequences were ranked by total read numbers and converted into their corresponding peptides sequences for subsequent analysis (Supplementary Table 16).
The library DNA was 5′-TAATACGACTCACTATAGGGTTAACTTTAAGAAGGAGATATACATATG(NNK)nTGCGGCAGCGGCAGCGGCAGCTAGGACGGGGGGCGGAAA.
Bead preparation was carried out as follows: To assess the binding capacity of biotinylated FIKK13 to streptavidin, Bio-His-FIKK13 was incubated with different quantities of magnetic streptavidin beads (Invitrogen) for 30 min. Beads were then washed three times with cold selection buffer and protein elution was performed by boiling the beads at 95 °C for 5 min. Samples were then run in an SDS–PAGE gel and stained with Coomassie. Bead capacity was calculated quantifying the gel bands with FIJI.
FIKK13 cyclic peptide synthesisPeptides were synthesized using NovaPEG Rink Amide resin as C-terminal amides by standard Fmoc-based solid-phase synthesis as previously described, using a Liberty Blue Peptide Synthesis System (CEM), a SYRO I (Biotage) or a Activotec P-11 peptide synthesizer. Following synthesis, the N-terminal amine was chloroacetylated by reaction with 0.5 M chloromethylcarbonyloxysuccinimide (ClAc-NHS) in dimethylformamide (1 h, room temperature). The resin was washed (5× dimethylformamide and 5× dichloromethane) and dried in vacuo.
Peptides were cleaved from the resin and globally deprotected with TFA/triisopropylsilane/1,2-ethanedithiol/H2O (92.5:2.5:2.5:2.5) for 3 h at room temperature. Following filtration, the supernatant was concentrated by centrifugal evaporation and precipitated with cold diethyl ether. Crude peptides were resuspended in DMSO/H2O (95:5) and, following basification with triethylamine to pH 10, were incubated with rotation for 1 h at room temperature. Peptides were then acidified with TFA and purified by HPLC (Shimadzu) using a Merck Chromolith column (200 × 25 mm) with a 10–50% gradient of H2O/acetonitrile containing 0.1% TFA. Pure peptides were lyophilized and dissolved in DMSO for further use. Peptide stock concentrations were determined by absorbance at 280 nm based on their predicted extinction coefficients.
Surface plasmon resonanceSingle-cycle kinetics analysis by SPR was carried out using Biacore S200 and a Biotin CAPture kit, series S (Cytiva). Bio-His-FIKK13 was immobilized on the chip to yield a response of approximately 1,400 RU. The running buffer contained 50 mM Tris pH 7.5, 250 mM NaCl, 2 mM DTT, 10 mM MgCl2, 1.5 µM ADP, 0.02% Tween and 0.1% DMSO and experiments were performed at 25 °C. Samples were run with 100 s contact time and data were analysed using the Biacore S200 analysis software. Data represent the average ± s.d. of at least two independent replicates. SPR data are available in Supplementary Table 9.
ADP-Glo assayRecombinant FIKK kinase domains activity was measured using the ADP-Glo kinase assay (Promega), which quantifies the amount of ADP produced during the kinase reaction. Briefly, the kinase reactions were conducted at room temperature for 1 h by mixing 100 nM recombinant FIKK kinase domain with 10 µM ATP and 10 µM substrate when specified, in 40 µl kinase buffer (20 mM MOPS, 10 mM magnesium chloride and 10 mM manganese chloride, pH 7.4 (Alfa Aesar)). When kinase inhibition by ATP analogues was assessed, compounds (diluted in DMSO, final concentration ≤1%) were tested at 10 µM, or otherwise specified, by incubation for 15 min with the recombinant kinase domain before the addition of ATP ± substrate. ADP-Glo reagent (40 µl) was added to stop the kinase reaction and deplete the unconsumed ATP. After incubation at room temperature for another hour, 80 µl kinase detection reagent was added and incubated for 30 min at room temperature. Luminescence was measured using the multimode microplate reader FLUOstar Omega (BMG Labtech).
Protein sequence identity matrixAs described above, P. falciparum FIKK amino acid sequences were retrieved from UniProt and aligned using the MAFFT L-INS-i algorithm85.
Heavily gapped alignment positions (more than 20% gapped) were filtered out of the multiple sequence alignment using the trimAl software86. The sequence identity of this processed alignment was then calculated using seqidentity (normalise=TRUE) function in the R package bio3d106.
Phosphoproteome libraries analysisPWMs were calculated for each FIKK kinase as described above. These data were then cross-referenced with the phosphoproteome peptides presented in Fig. 4. Each peptide in the array was scored for its match to the FIKK preferred phosphorylation motif, using a simple matrix similarity score (MSS) of the PWM against the peptide sequence100. This function outputs a normalized score that has a minimum of 0 and a maximum of 1. In each case, a Pearson’s correlation coefficient is calculated between the motif score (x) and a log10 transformation of the phosphorylation signal from the phosphoproteome peptide array (y), from curves of the form y = log(x).
Peptides from the library were divided into a motif ‘match’ and ‘no match’ with respect to the FIKK specificity matrix. This was based on a null distribution of randomized peptide sequences for phosphosites not affected by the FIKK knockout tested previously16. Peptides with a motif score (MSS) below an empirical P value of 0.05 were considered a ‘match’. Peptides with an MSS above 0.05 in P value were considered ‘no match’.
The sequence logo of phosphoproteome targets (for example in Fig. 4c) represents the relative frequency of amino acids among peptides phosphorylated above background levels (log10(signal >4.0)) for the FIKK kinase of interest. Sequence logos were generated using ggseqlogo105.
Expression and purification of P. falciparum FIKK13 kinase domain proteins for crystallizationCodon-optimized DNA encoding the kinase domain of PfFIKK13 residues 149–561 (PlasmoDB PF3D7_1371700) was
Comments (0)