
Remember me


The main objective of our study is to determine if this novel respiratory etiquette technique, into the shirt, is feasible to perform, study, and analyze using available standard technology to make preliminary observations. Our investigator-driven, single-center study was approved by the University of Utah Institutional Review Board (the protocol is available with the full text of this article at http://www.biomedcentral.com, Appendix. S1 in the Supplementary Appendix). We provide an open-bench, observational, respiratory etiquette pilot study conducted as a small observational experiment with healthcare workers as the volunteer participants. A group email was sent to all emergency department staff in the two weeks prior to the experiment, requesting volunteers. It included an explanation of the experiment and had a consent cover letter (Fig. S1 in the Supplementary Appendix). All participants provided informed consent.
Eligible participants were screened for the following infectious respiratory disease symptoms: cough, body aches, chills, fever, and loss of taste or smell. Additionally, temperatures were taken on all participants. No participants were excluded due to IRD symptoms.
The study was conceived and conducted by the investigators at the University of Utah, who collected and analyzed the data. All authors had access to the data and vouch for the accuracy and fidelity of this report (available at http://www.biomedcentral.com). All research was performed in accordance with the Declaration of Helsinki.
ParticipantsThe healthcare worker participants were selected via response to an email, based on availability and willingness to participate at the experiment time. All participants worked primarily in the emergency department at the University of Utah Medical Center. Three of the participants were female and 2 were male. They all had different backgrounds, including four registered nurses, one emergency medical technician, and one pharmacist. One nurse was excluded for the inability to produce a robust voluntary cough or measurable plume. Data from these five participants were analyzed to conclude feasibility and obtain preliminary observations.
Study siteThe experiment was conducted in an outside unoccupied negative pressure overflow tent intended for respiratory patients with possible SARS-Cov-2 symptoms.
ProceduresAppointments were made with volunteers for scheduled times, allowing participants to be screened with exclusion criteria as per prior, reread the consent letter, answer any questions, and provide written informed consent. After completing the prescreening, participants were asked to change into a black long sleeve shirt and proceed to the coughing station. The coughing station was set up using a black photographer’s curtain as a backdrop, illuminated by two umbrella studio lights. Markings were made at 12-inch increments along the top of the black photographers’ curtain backdrop extending to 120 inches. Participants were asked to stand at a dedicated location and read the coughing instructions (Fig. S2 in the supplementary appendix). The participants were asked to produce four coughs: unobstructed, into the elbow, into the mask, and into the shirt. To simulate a cough plume or cloud, (hereafter referred to as a cough plume, respiratory plume or plume), the experiment used powdered sugar to simulate a cough plume with droplets. The participants were asked to: take a deep breath to fully inflate their lungs, empty the powdered sugar from the dosing cup into their mouths, then elicit their best effort coughs using the above respiratory etiquette maneuvers in an open bench format. The cough plume was recorded using a Samsung Note 10 + 5G phone on a tripod was used to capture each cough in slow motion mode (240 frames per second at a resolution of 1920 × 1080 pixels). Multiple video clips were made for each participant (Links S1-S4 in the Supplementary Appendix). All five participants completed the 4 different cough maneuvers and were given adequate time in-between coughs recover for the next sequence.
Data processingFollowing video capture, we analyze each cough recording to find the cough maximal plume area (MPA). Although we did not encounter this term or abbreviation in the existing RE literature, we will hereafter refer to this area measurement as cough MPA for ease of description. (Details of our software process are illustrated in Fig. S3 in the Supplementary Appendix). Our data processing software is written in Python using OpenCV and Numpy libraries. Our software processes slow-motion videos to find an approximate area occupied by the white plume. The white tape on the background and pixels occupied by the participant prohibits the image’s simple thresholding from finding which frame of the video has the cough MPA. We found the easiest way to limit the number of pixels occupied by the participant, and the tape is to create a “tape mask”, which in image processing means to replace the regions with gray values below the threshold used to find cough particles.
The algorithm first creates the tape mask by taking the video’s 0th frame and marking the tape lines via thresholding in hue saturation value color space. We use the 0th frame because the plume we are looking for is white, and the 0th frame does not yet contain any plume pixels. We mark these regions with a dark color that is below our thresholding value.
We sequentially analyze every frame, in search of the highest number of cough (white) pixels. For each frame N, we remove “skin” pixels by thresholding in hue saturation value (HSV) color space. We choose to automatically remove tape and skin as much as possible to find a more accurate account of which frame in a participant’s sequence had the largest number of white pixels.
The HSV threshold values are as follows:
[0, 0, 180] ≤ tape threshold ≤ [255, 38, 255].
[0, 0, S] ≤ skin threshold ≤ [40, 90, 255], for S in [210,240].
Once we minimized the number of the skin or background pixels, we applied Contrast Limited Adaptive Histogram Equalization [30] (with a clip Limit = 3.0, tile Grid Size = (8, 8)) on the luminance channel in LAB color space to brighten the image. We found this to be an essential step in separating the plume from the background. Next, we threshold the contrast adjusted image, empirically finding that a plume threshold of 99 in [0, 255] worked for the images in our dataset. We recorded the frame number and number of white pixels for this frame and repeated the other frames’ processing.
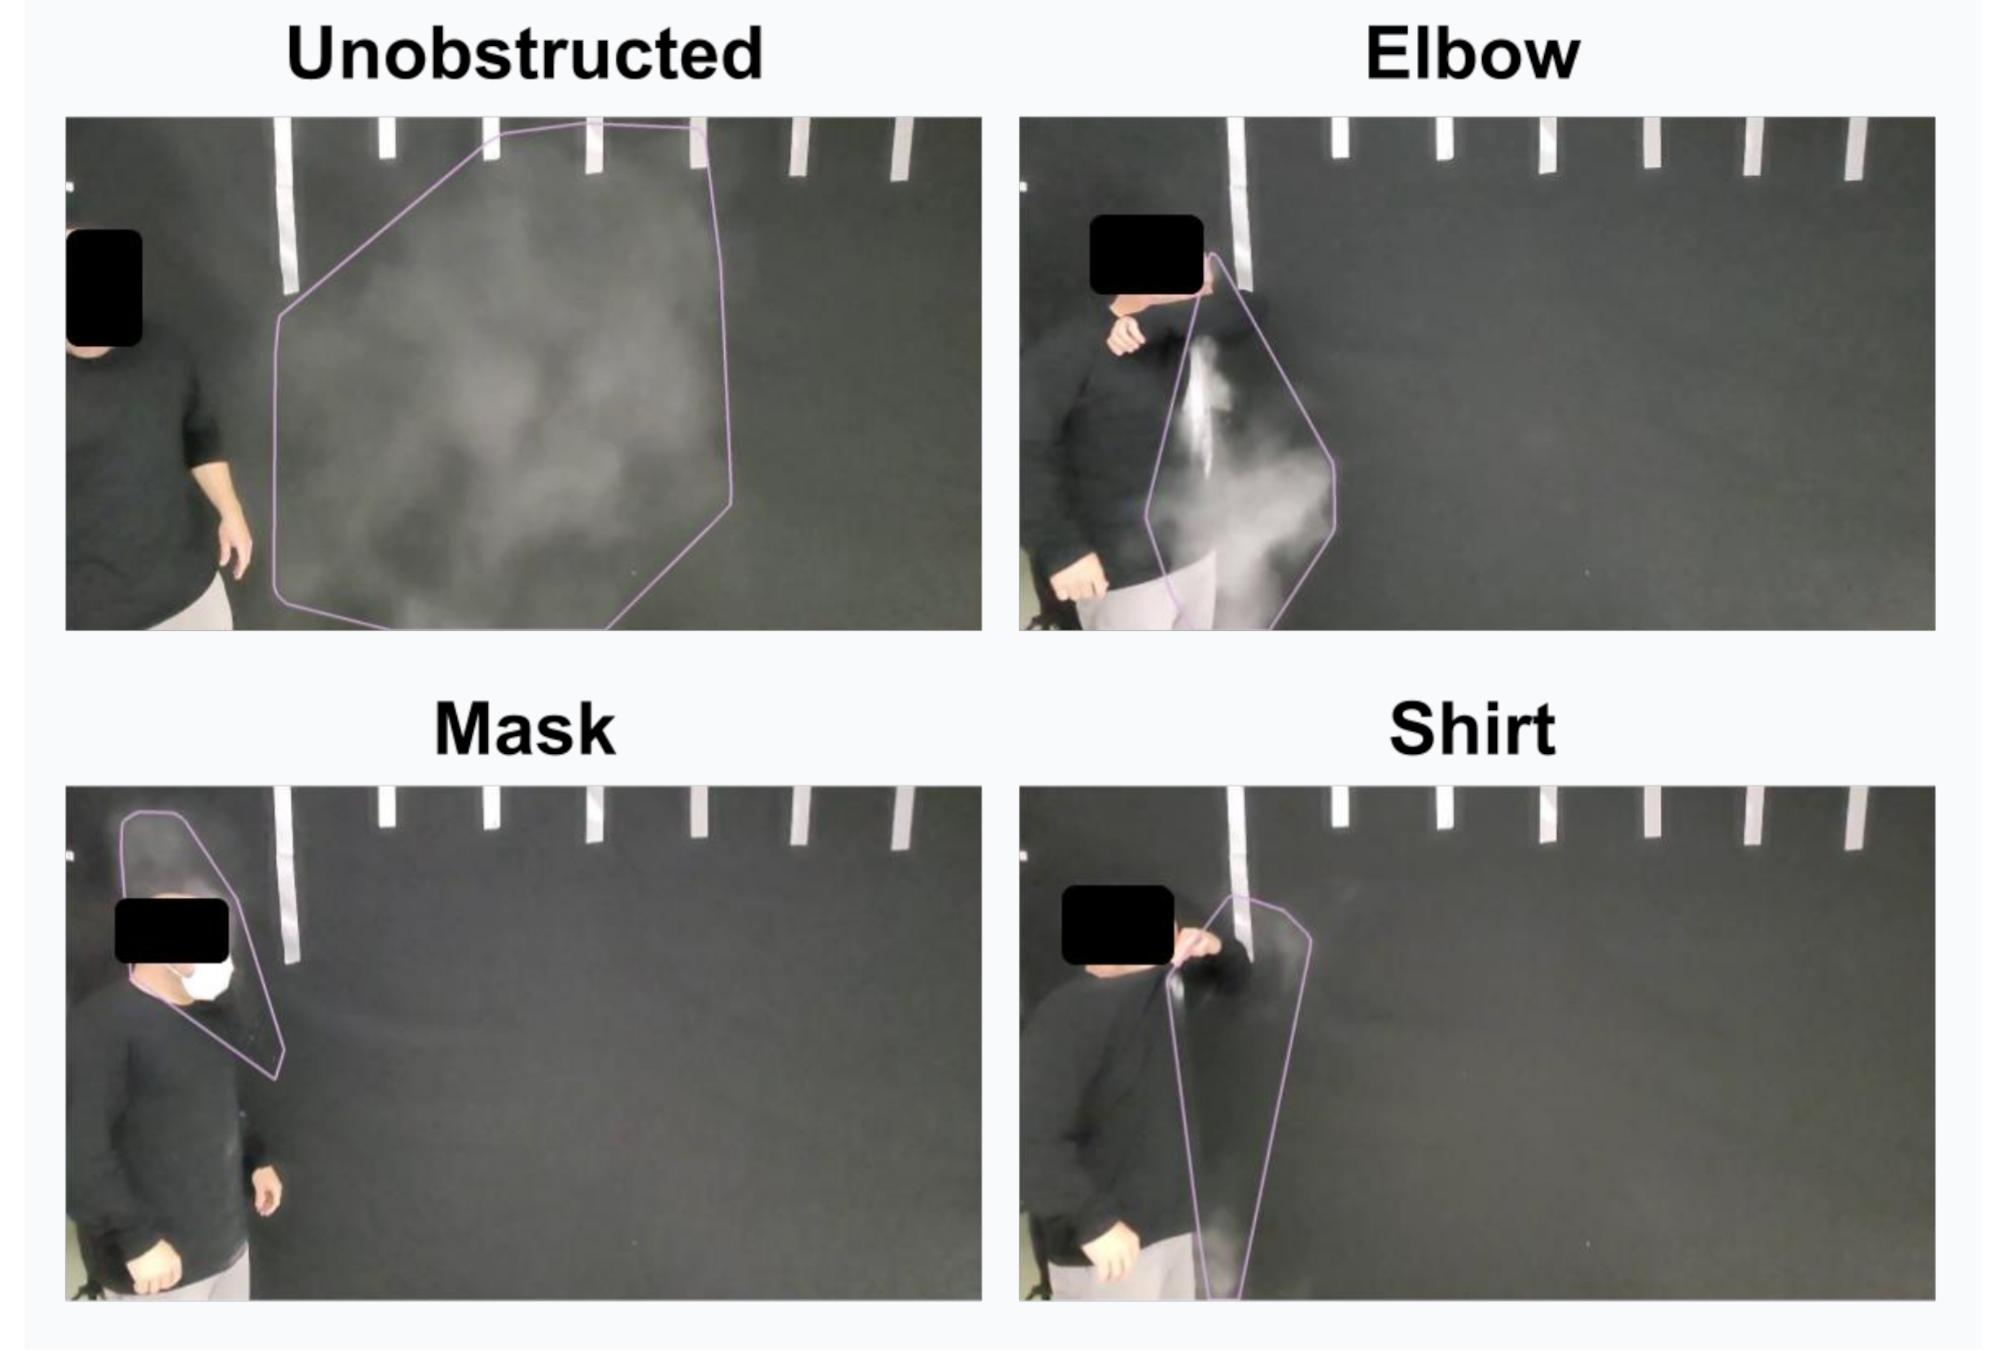
Once the frame with the largest number of white pixels was found, we cleaned up the thresholded image to get a more accurate count of the plume’s size. Next, the contour finding algorithm was used to group nearby white pixels accurately. We then used a distance threshold to combine the grouped pixels and calculate the maximal plume that enclosed the contours, calling this cough maximal plume area (MPA). The results for participant 4 are shown (Fig. 1). Results for all participants across all maneuvers are provided (Figs. 2 and 3, Table 1).
Fig. 1
Cough maximal plume areas of the four respiratory etiquette maneuvers. Summary of cough maximal plume area (MPA) for anonymized participant 4 across all four respiratory etiquette maneuvers from the slow-motion videos. Each still image is annotated with the software detected maximal plume pixel boundary (pink outline). The unobstructed cough maximal plume area (MPA) is much bigger in area than the other maneuvers. The elbow maneuver produces a dense cloud of dust, whereas the mask and shirt maneuvers reduce the number of released particulates
Fig. 2
Summary cough maximal plume areas (MPA) for all participants and respiratory etiquette maneuvers, Summary of cough maximal plume area across anonymized participants from the slow-motion videos. Each video still image is annotated with the software-detected cough maximal plume area (MPA) across all four maneuvers. Some participant’s maneuvers did not result in software-detectable plumes notably in the into the shirt and mask maneuvers.
Statistical analysisDescriptive statistics were used to compare the cough MPA between each RE maneuver. The cough MPA was normalized to the unobstructed maneuver across each subject rather than raw pixels to account for individual differences in the baseline force used to generate a cough. This also adjusted for the distance away from the camera that varied slightly between subjects. A repeated-measure ANOVA testing was used to assess for statistically significant differences between the normalized cough MPA across RE maneuvers. We use paired t-testing to compare the mean differences between two groups. Each RE maneuver was considered an independent variable. A p-value cut off of 0.05 was used to determine statistical significance. Analysis was done on STATA/IC 16.1 software.
Comments (0)