
Remember me
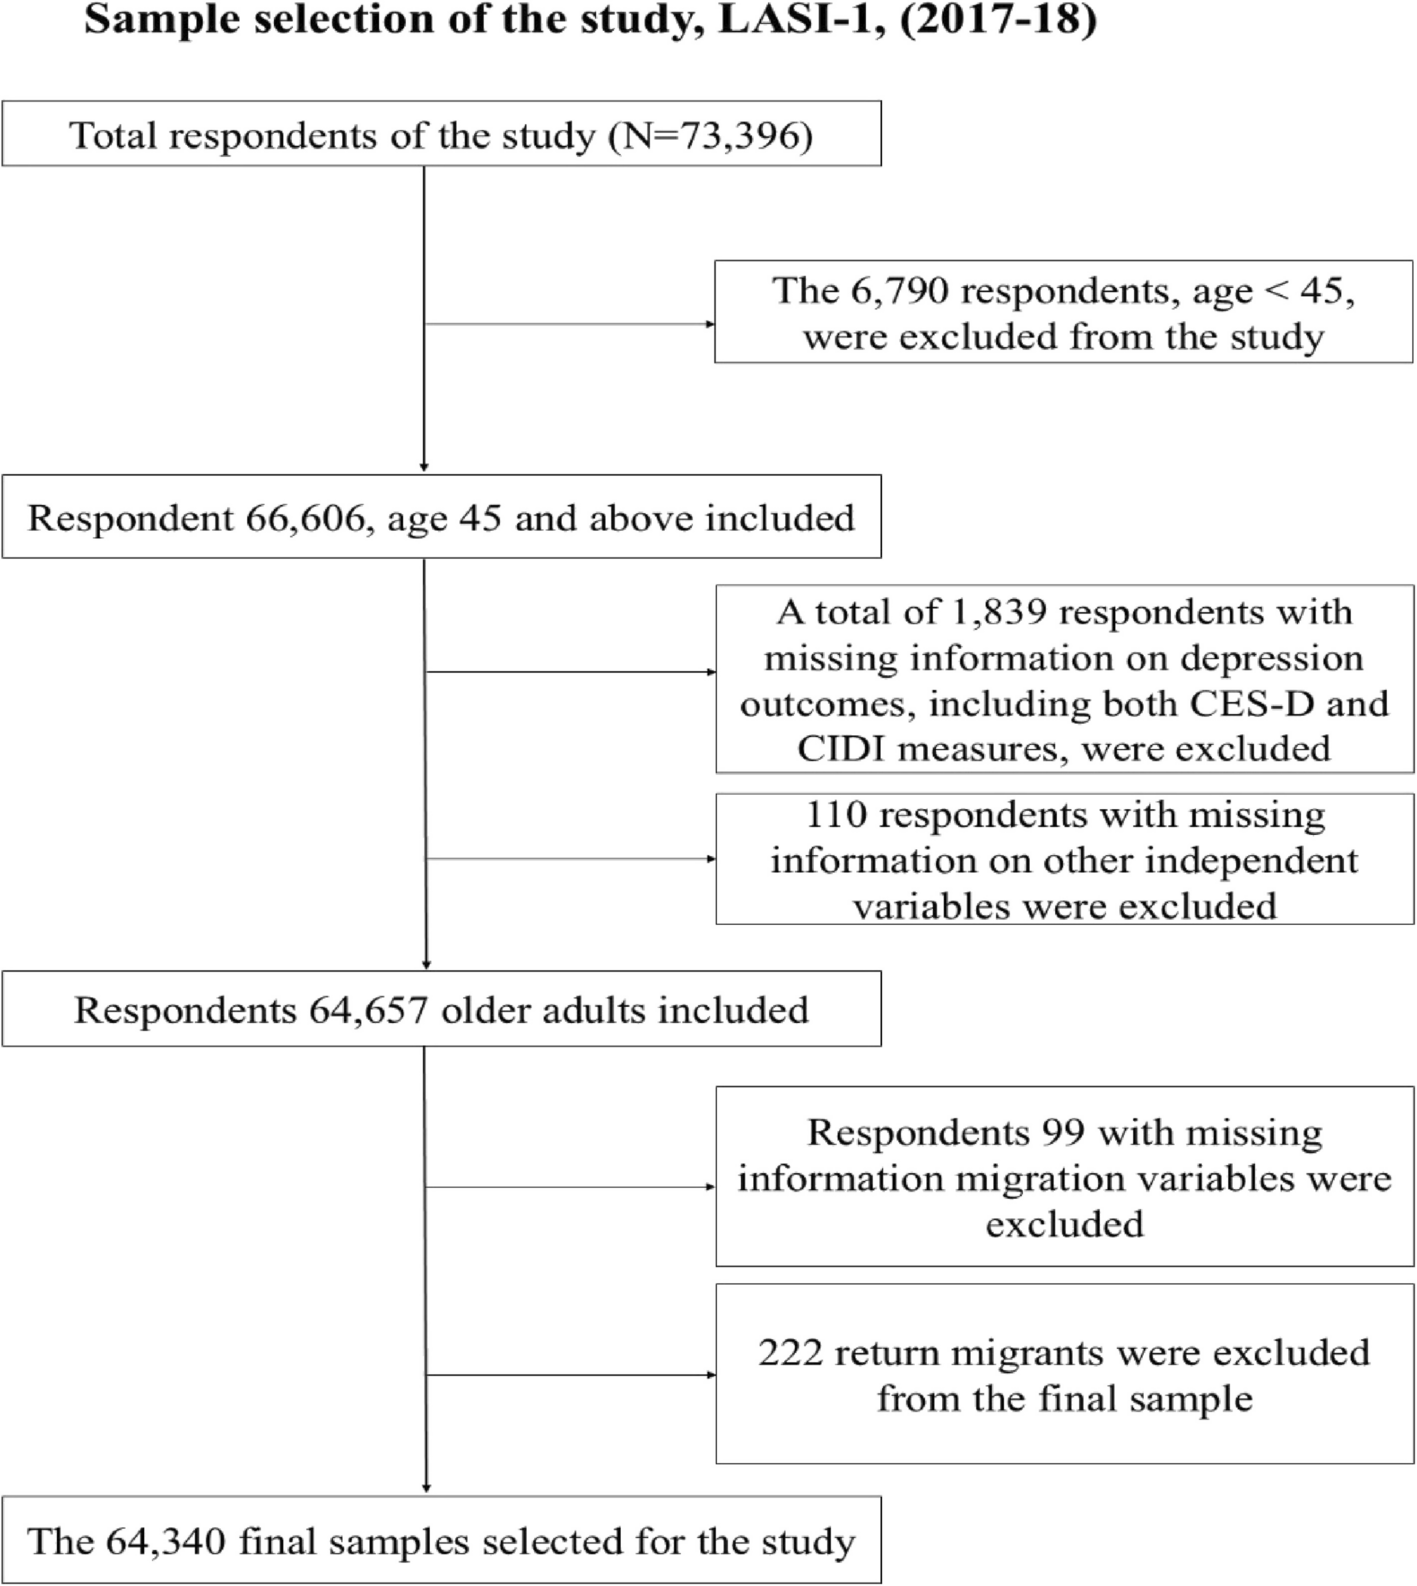
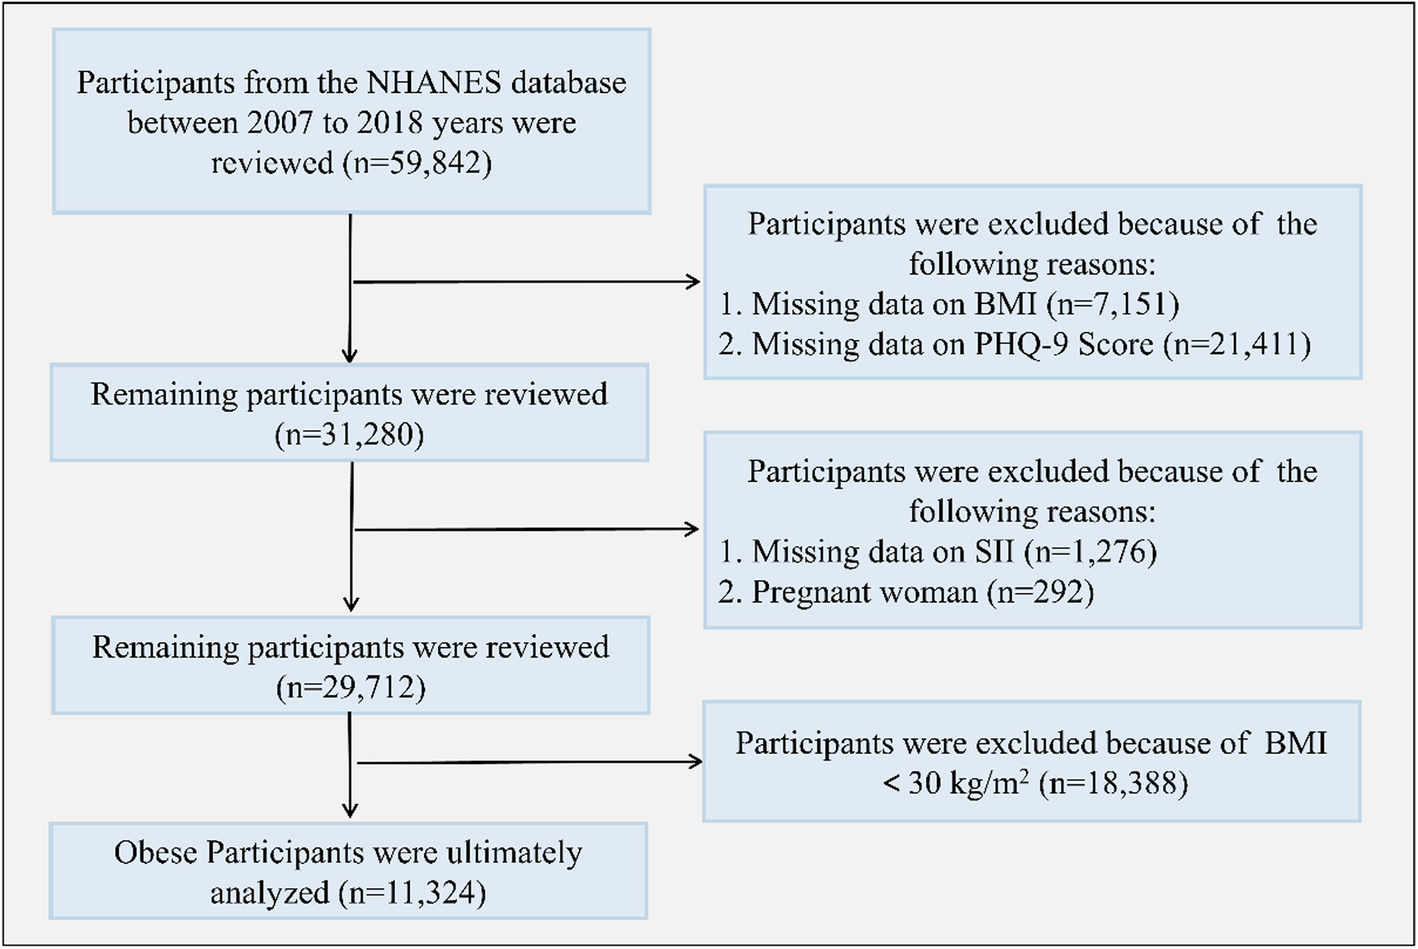


A cross-sectional study design was adopted for this study. Data for the analysis were drawn from the Longitudinal Ageing Study in India (LASI) wave one, collected during 2017–18. It is a nationally representative survey of 73,396 individuals, 31,135 male and female, 42,261 aged 45 and above years, and their spouses (regardless of age) across all states of India, according to the Census of India, 2011. The survey’s main objective was to study the health status and socioeconomic well-being of older adults in India. The LASI adopted the multistage stratified area probability cluster sampling design to arrive at the eventual observation units: older adults age 45 and above and their spouses, irrespective of age. The present study was conducted on respondents aged 45 years and above andfinal sample size was 64,340older adults selected. The sampling frame of the final sample and the exclusion and inclusion criteria of the sample are shown in Fig. 1.
Fig. 1
Sample size for the study
MethodologyOutcome variableIn the present study, depressive symptom was considered for mental health status. Radlof (1977) initially developed a screening tool, a short self-report score comprising 20 items to calculate the depressive symptoms. However, in this study, we adopted the shortened version of the Centre for Epidemiological Studies- Depression (CES-D) score developed by Anderson et al. (1994) [31], also used in the LASI to measure depressive symptoms. The CES-D by Anderson (1994) comprised seven negative symptoms, i.e., fear of something, low energy, trouble concentrating, feeling alone, feeling depressed, bothered by things, and everything is an effort, while three positive symptoms included feeling happy, hopeful, and satisfied. For all these ten symptoms, individuals had responded rarely or never, i.e., < 1 day; sometimes, i.e., 1 or 2 days; often, i.e., 3 or 4 days; and most or all of the time, i.e., 5–7 days in a week before the interview in the LASI. For the negative symptoms, rarely or never were sometimes scored zero, while often and most or all of the time categories were scored one. At the same time, the scoring was reversed for three positive symptoms. The overall score varies from 0 to 10, and a score of four or more was considered to calculate the prevalence of depressive symptoms.
In this study the depression was also measured using the CIDI-SF scale. Major depressive disorder was assessed using the Composite International Diagnostic Interview short-form (CIDI-SF) scale, widely used to diagnose psychiatric depression [32, 33].
The LASI CIDI-SF questionnaire included the following 10 questions: (1) During the last 12 months, was there ever a time when you felt sad, blue, or depressed for two weeks or more in a row? (2) Please think of the two weeks during the last 12 months when these feelings were worst. During that time, did the feelings of being sad, blue, or depressed usually last all day long, most of the day, about half the day, or less than half the day? (3) During those 2 weeks, did you feel this way every day, almost every day, or less often than that? (4) During those 2 weeks, did you lose interest in most things? (5) During those 2 weeks, did you ever feel more tired out or low in energy than is usual? (6) During those 2 weeks, did you lose your appetite? (7) During those 2 weeks, did you have a lot more trouble concentrating than usual? (8) During those two weeks, did you feel down on yourself and worthless? (9) During those 2 weeks, did you think about your death or someone else’s in general? (10) During those 2 weeks, did you have more trouble falling asleep than usual?
The response for all the items (except items “2” and “3”) was binary, i.e., in “No” (coded as 0) and “Yes” (coded as 1). Individuals who felt sad, blue or depressed “all day long” or “most of the day” were coded as “Yes”; else, they were coded as “No.” Similarly, individuals who felt sad, blue or depressed “every day” or “almost every day” were coded as “Yes”; else, they were coded as “No”. The ten items had scores ranging from 0 to 10. We classified older adults with a 5 + score—as “Depressed” and those with a score of 4 and below as “Not depressed [33, 34].
Explanatory variablesMigration Status: Persons are classified as migrants based on the question “Place of last residence (POLR).” According to this, if a person’s place of last residence is different from the current place, then the person is considered a migrant; otherwise, the person is a non-migrant [35]. In this study, the migration duration is classified with the question, “How many years have you continuously lived in this place?” If the person answers since birth, then the person is considered a non-migrant. Otherwise, migrants and calculate the migration duration.
Migration types are defined by migration duration, which is categorized as 0 to 9 years, 10 to 24 years, and 25 and above years; migration by the boundary (Intra-state, Inter-state, and Immigration), migration stream (Rural to Rural, Rural to Urban, Urban to Rural and Urban to Urban) and age at migration (0–14, 15–44, 45–59, and 60 and above) [36]. These dimensions of migration capture distinct aspects of the migration experience that may affect mental health through different mechanisms [37]. Age at migration is a key life-course variable—migrating at an earlier or later life stage may influence one’s ability to adapt socially, economically, and emotionally. Duration of stay reflects the level of integration and adjustment; shorter durations may be associated with instability or lack of social support. Migration boundary (e.g., intra-state vs. inter-state) captures the extent of geographic and cultural disruption, which may affect stress levels and access to familiar support networks. The migration stream (rural-rural, rural–urban, etc.) reflects socio-spatial transitions that may shape exposure to environmental, social, and health service contexts [36, 37].
Other covariatesThe other socio-economic and health variables are categorized as follows: Age (60–69, 70–79, and 80 +); sex (male and female); place of residence (rural and urban); marital status (currently married, widowhood, and others), religion (Hindu, Muslim, and others); Cast category (Scheduled caste, Scheduled tribes, Other Backward Class and Others); education (No education, primary, secondary and higher, and graduate and above); currently working (working, not working and never worked); MPCE quintile (Poorest, poorer, poor, richer, richest); Regions (north, east, northeast west, and south); and self-rated health (good, poor) based on previous studies [21, 28, 29, 33].
Statistical analysisThe study participants' general characteristics and distribution were determined using descriptive analysis. The preliminary study used descriptive statistics and bivariate analysis to examine migration levels, patterns, and other independent variables' characteristics with depression. Aside from that, the findings of the association of depression with migration status and other independent variables were carved out using logistic regression analysis. A logistic regression model can be written as follows:
$$\text\left(odds\right)=logit \left(p\right)=\text\left(\frac\right)= _+__+__+\dots +__$$
where p is the expected probability of the outcome variable, and \(_, _, _, \dots . , _\) is the set of explanatory variables, and β1, β2, β3, –––– βk are the regression coefficients to be estimated in the model (Ryan, 2008). The statistical package STATA for Windows version was used for all statistical analyses. The proper individual-level sampling weights were used to make the results representative.
Comments (0)