
Remember me


Twenty-two patients who had a cervical lymphadenectomy (also called selective neck dissection) were included for analysis. Twelve patients (54.4%) were female, and the mean age was 59.5 ± 13.5. Sixteen patients (72.7%) had at least 1 positive LN on final pathology. Subsite and staging information are provided in Table 1.
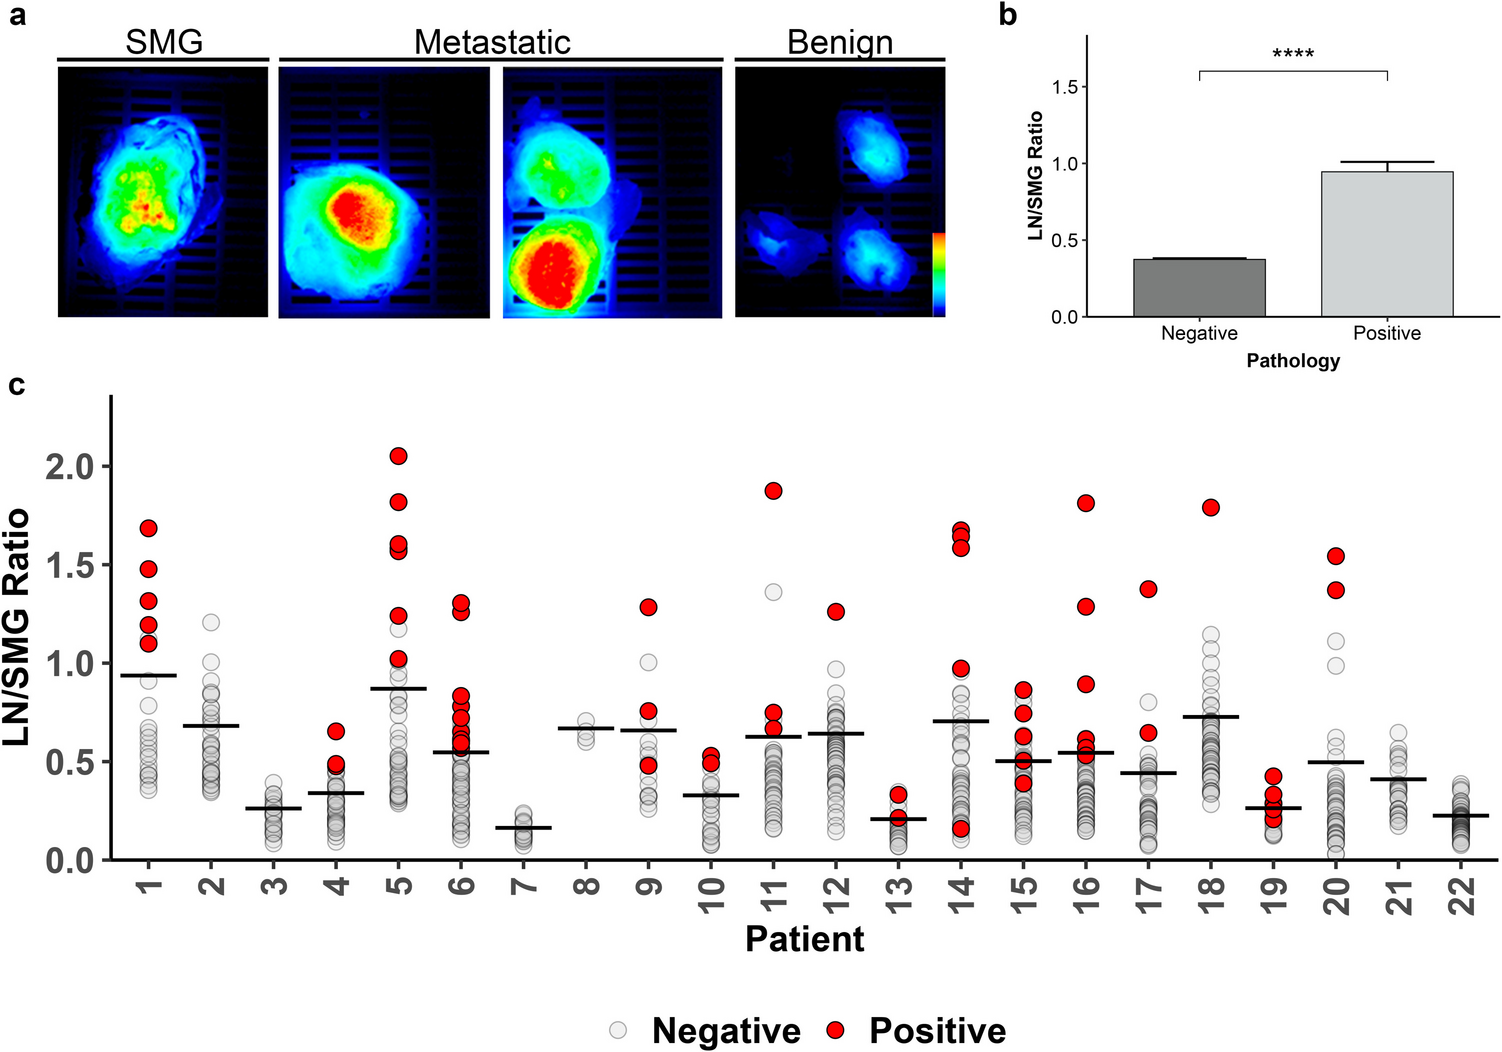
Table 1 Patient demographicsLN/SMG RatioFor patient-matched SMG analysis, there were a total of 843 LN included of which 63 (7.4%) had malignancy present on final pathology. Representative fluorescence images of resected SMG, metastatic LN, and benign LN are provided in Fig. 1a. The mean LN/SMG ratio of malignant LNs (0.95, standard error (SE) = 0.06) was more than twice that of benign LN (0.37, SE = 0.008, p < 0.0001; Fig. 1b) across the patient cohort. Figure 1c indicates the individual LN/SMG ratios and mean values for each patient.
Fig. 1
LN/SMG ratio using SMG as reference (a) Representative closed-field fluorescence imaging of specimens in cassettes from patient 20 with all images set to the same scale. (b) The overall mean of LN/SMG ratio for benign and malignant lymph nodes. Error bars represent the standard error of measurement. ****p < 0.0001. (c) The LN/SMG ratio (mean indicated by horizontal line) of all lymph nodes separated by patient. LN: lymph node; SMG: submandibular gland
LN/Skin RatioFifteen patients had skin available for patient-matched analysis of LN fluorescence. Fluorescence in skin was low relative to the fluorescence observed in metastatic LN from these patients (Fig. 2a). A total of 621 LNs were included, 42 (8.4%) of which were positive for malignancy. Malignant LNs had a mean LN/skin ratio (8.47, SE = 1.46) that was three-times greater than that of benign LN (2.46, SE = 1.46, p < 0.0001; Fig. 2b). Individual LN and mean patient LN/skin ratios are indicated in Fig. 2c.
Fig. 2
LN/tissue ratio using skin as a reference. (a) Representative closed-field fluorescence imaging of specimens from patient 11 with all images set to the same scale. (b) The combined mean LN/skin ratio for benign and metastatic lymph nodes. Error bars represent the standard error of measurement. ****p < 0.0001. (c) The LN/skin ratio (mean indicated by horizontal line) of all lymph nodes separated by patient. LN: lymph node
ROC AnalysisROC analysis using LN/SMG ratios to distinguish malignant from benign nodes (Fig. 3a) showed an area under the curve (AUC) of 0.857 (95% CI, 0.80–0.91). The AUC of the ROC using LN/skin ratios to distinguish malignant from benign LNs (Fig. 3b) was 0.826 (95% CI, 0.76–0.89). The optimal LN/SMG ratio cutoff value determined from Youden’s index was 0.476, yielding a sensitivity of 85.7% (95% CI, 0.78–0.94) and specificity of 72.8% (95% CI, 0.70–0.76; Fig. 3c). The best LN/skin ratio cutoff value determined from Youden’s index was 4.024, which provided a sensitivity of 69.0% (95% CI, 0.55–0.83) and a specificity of 86.5% (95% CI, 0.84–0.89; Fig. 3c). Both of the ratios had better AUC compared to raw MFI alone (Supplementary Fig. 1).
Fig. 3
Performance of both LN/tissue ratios. (a, b) Receiver operating curves for the LN/SMG ratio (left) and LN/skin ratio (right). (c) The threshold for each LN/tissue ratio determined by Youden’s index and the sensitivity, specificity, positive predictive value (PPV) and negative predictive value (NPV) for each. LN: lymph node; SMG: submandibular gland
Threshold Adjusted Ratio (TAR) MeasurementThe moderate accuracy of LN/tissue ratios to distinguish malignant from benign LN prompted exploration of alternative fluorescence metrics that could provide greater diagnostic accuracy. After considering the wide variation of LN/tissue ratios both within and across patients, we derived a patient-specific threshold from the LN/tissue ratio and subtracted this threshold value from the LN/tissue ratio determined for each patient-matched LN (Fig. 4a). Applying this threshold adjusted ratio (TAR) approach to each LN approximately normalized the resulting mean values for each patient when using the SMG (TARSMG) (Fig. 4b) or skin (TARskin) (Fig. 4c) as reference tissue. ROC analyses of the TARSMG (Fig. 5a) and TARskin (Fig. 5b) values provided an AUC of 0.922 (95% CI, 0.88–0.96) and 0.944 (95% CI, 0.91–0.97), respectively, to differentiate malignant from benign LN. Both AUCs were greater than the threshold adjusted MFI performance (Supplementary Fig. 1). The improved AUC of the TARSMG was significant when compared to the AUC for the LN/SMG ratio (p = 0.001). Additionally, the greater AUC for the TARskin was significant when compared to the AUC for the LN/skin ratio (p < 0.0001). Optimal TARSMG and TARskin cutoff values determined by Youden’s index (−0.0137 and 0.0437, respectively) provided sensitivities of 93.7% (95% CI, 0.87–0.98) and 95.2% (95% CI, 0.88–1.00), respectively, and specificities of 80.5% (95% CI, 0.78–0.83) and 83.9% (95% CI, 0.80–0.87), respectively (Fig. 5c). Overall, the TARSMG and TARskin results showed superior diagnostic value to distinguish malignant from benign LN relative to the LN/tissue ratios (Fig. 3c) when using SMG and skin as reference tissues for fluorescence assessment.
Fig. 4
Threshold Adjusted Ratios of all lymph nodes. (a) Patients had individual thresholds calculated by taking their mean LN/tissue ratio plus one-half the standard devidation. A threshold adjusted ratio (TAR) was calculated by the LN/tissue ratio subtracted by the threshold for each lymph node by patient. (b, c) Each lymph node TAR plotted by submandibular gland (left) and skin (right). The line on each plot represents the respective uniform cutoff TAR
Fig. 5
The performance of the TARSMG and TARskin. (a, b) Receiver operating curves for the TARSMG (left) and TARskin (right). (c) The threshold for each TAR determined by Youden’s index shows improved sensitivity and negative predictive value (NPV). TAR: threshold adjusted ratio; LN: lymph node; SMG: submandibular gland; PPV: positive predictive value
Comments (0)