
Remember me


The [18F]FDOPA PET imaging data used in this study were retrieved from the PET imaging data repository available at the Institute of Psychiatry Psychology and Neuroscience (IoPPN) at King’s College London [28].
A total of 273 [18F]FDOPA PET scans were used, which comprised 138 healthy controls (80 males, 58 females, age 28.5 ± 7.9 years) and 135 patients with a psychotic disorder according to ICD-10 and DSM criteria [29] (98 males and 37 females, age 32.0 ± 10.8 years). Data were retrieved from several different studies, collected with the following PET tomographs: Hi-Rez Biograph 6 (N = 118), Biograph 40 Truepoint (N = 50), Biograph Truepoint 6 (N = 35), ECAR HR + 962 (N = 36), ECAT EXACT 3D (N = 7), Biograph TruePoint TrueV (N = 27). Among the patient group, 71 were labelled as responders to standard antipsychotic treatment and 64 were classified as non-responders. This classification of patients response followed the clinical criteria as stated in the in the original studies [30,31,32,33]. A subgroup of these patients was further reorganised in three different clinical cohorts, representing different stages of the disorder. FDOPA_01 comprises first-episode psychosis (FEP) patients who were recruited if they had a diagnosis of psychotic disorder according to ICD 10 criteria in first episode of the illness [30]. At the time of [18F]FDOPA PET acquisition these patients were antipsychotic naïve (no current or previous treatment) or free (not taking medication at scanning time with at least 6 months washout for oral medication or 6 months for depot medication). For this patient cohort, treatment response was defined as a total PANSS reduction of ≥ 50% at the initial follow-up, confirmed by remission criteria at six months [30]. FDOPA_02 includes twelve patients who met DSM-IV criteria for SCZ, treated with clozapine who had not responded to first-line antipsychotics and twelve patients who had responded to first-line antipsychotics [31]. All patients had received first-line antipsychotic drugs (including risperidone, olanzapine, and paliperidone) or clozapine for at least 12 weeks at the time of [18F]FDOPA PET acquisition. Finally, FDOPA_03 includes 24 patients who met DSM-IV criteria for SCZ [32]. In this dataset, non-responders were identified as patients with treatment-resistant SCZ who exhibited persistent symptoms (total PANSS score ≥ 75) despite receiving at least two sequential antipsychotic trials, each lasting a minimum of four weeks [32]. On the contrary, responders met treatment remission criteria with a scored ≤ 3 on all items of the PANSS questionnaire and had not experienced a symptomatic relapse in the 6 months prior to the study. All patients were taking antipsychotic medication at time of scanning other than clozapine. A summary of experimental variable and demographic information (age and sex) for each dataset is reported in Table 1.
Table 1 Demographic characteristics of patients (non-responders and responders)All [18F]FDOPA PET imaging data were acquired with a continuous dynamic acquisition (no arterial blood sampling), with simultaneous scanning and tracer injection, scanning lasting for 90–95 min. All participants received carbidopa (150 mg) and entacapone (400 mg) orally ~ 1 h before imaging to reduce the peripheral tracer metabolism. The [18F]FDOPA tracer was administered by intravenous bolus injection after the acquisition of brain CT or MRI for attenuation correction, depending on the scanner used at each imaging site. PET data reconstruction varied across imaging sites and scanner types, though all included correction for random noise, scatter, and tissue attenuation. More details on the acquisition and reconstruction parameters can be found in the original publication [28].
For [18F]FDOPA PET data quantification, the automated analysis pipeline proposed by Nordio et al. was applied consistently to all scans [28]. The pipeline quantifies Kicer (unit 1/min), a kinetic parameter used as a proxy of dopamine synthesis capacity [34], and the Standardised Uptake Value ratio (SUVr), calculated as the ratio of the tracer activity in a target region to that in the reference region (i.e. mean cerebellum [18F]FDOPA PET activity). Specifically, SUVr was derived from a 15-min acquisition window starting 60 min after bolus administration. Further details on the analysis pipeline can be found in the original publication [28].
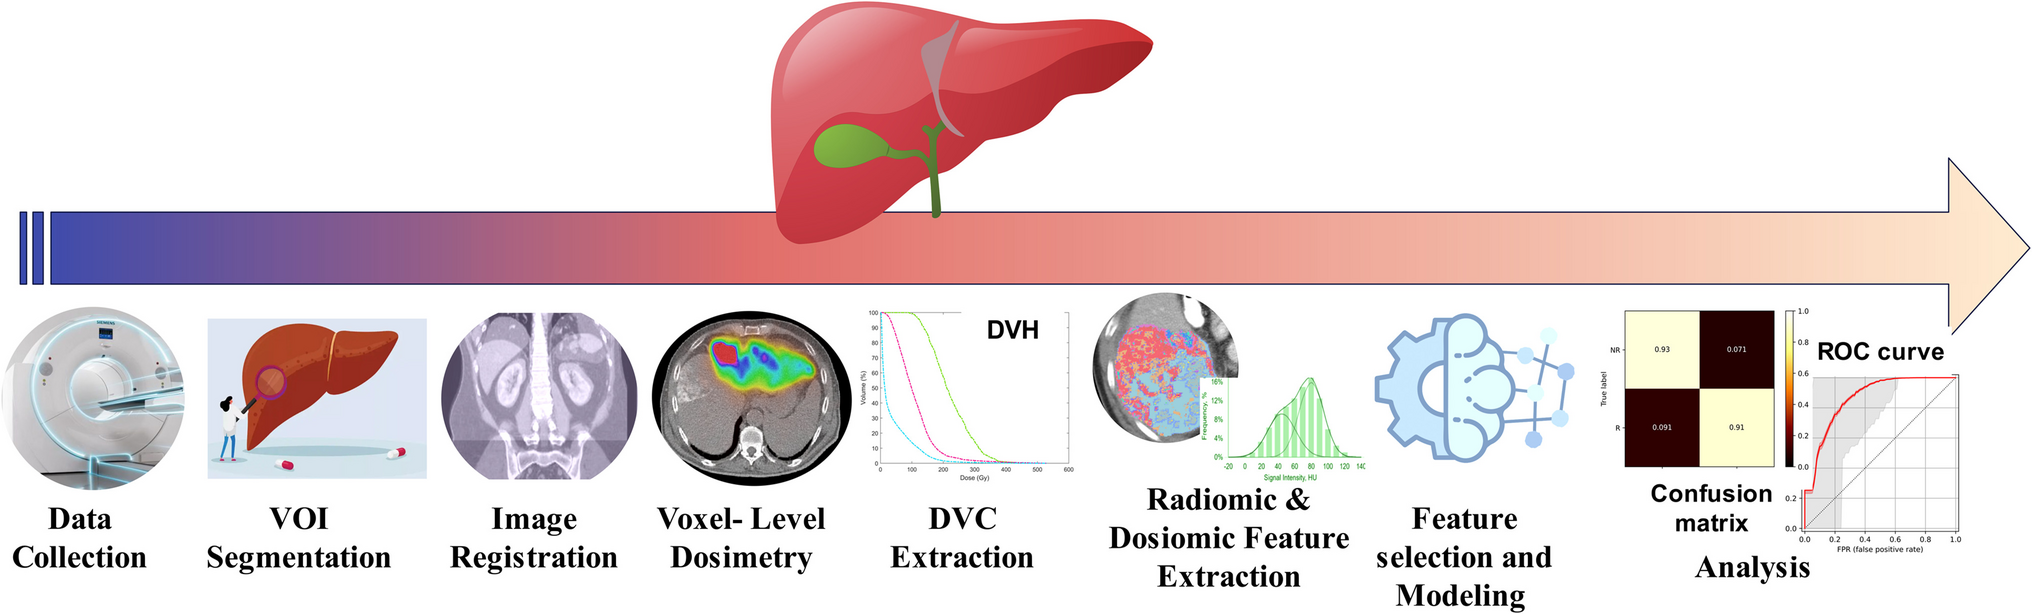
Radiomic analysisDelineation of volume of interestFigure 1 shows workflows of the radiomic analysis performed. The striatal region was considered as the volume of interest (VOI) for the radiomic analysis, since it is the main region involved in dopamine synthesis capacity. The striatal mask was derived from the Martinez atlas [35], previously co-registered to subject space, with two binary dilations on the striatal region [28]. Kicer parametric maps were used to obtain the VOI mask by keeping voxels with a signal higher than 0.007 min−1. This threshold was chosen based on the quality assessment of a larger [18F]FDOPA dataset (N = 792, including healthy controls and patients with psychosis at different stages of the disease), for which Kicer estimates smaller than this threshold were associated with poor image quality [28].
Fig. 1
Schematic illustration of the analytical workflow used in this study. From left to right: VOI segmentation, feature extraction, feature selection, radiomic analysis, and clinical application
Feature extractionRadiomic features were extracted using the Medical Image Radiomics Processor (MIRP) Python package [36]. MIRP comprises the following feature families: morphological, local intensity, intensity-based statistical, intensity histogram, intensity-volume histogram, grey level co-occurrence-based, grey level run length-based, grey level size zone-based, grey level distance zone-based, neighbourhood grey tone difference based, and neighbouring grey level dependence-based features.
MIRP package is Image Biomarker Standardization Initiative (IBSI) compliant [37], which is an independent international collaboration that aims to standardize the radiomic feature extraction in order to refine software agreement [37] and eventually improve the reproducibility of radiomic studies. The radiomic analysis was performed on the SUVr parametric maps since they have a higher signal-to-noise ratio than Kicer parametric maps, allowing for a more robust analysis [38]. Since the data quantification pipeline already generated SUVr images with an isotropic voxel size of 2 mm, no additional resampling was required to harmonize voxel dimensions. Before the feature computation, individual striatal masks were further filtered by removing the voxels with an SUVr value lower than 1.50, which was estimated as a lower bound for the SUVr signal in healthy controls [28]. The images were then discretized with the fixed bin size method (biz size = 0.0125) [39], and features were computed with the 3D average aggregation method.
Reproducibility analysis and feature selectionData from two independent datasets were used to conduct a reproducibility analysis. The first dataset comprised [18F]FDOPA PET test–retest imaging data from 7 healthy controls [40], while the second dataset comprised [18F]FDOPA PET test–retest imaging data from 7 patients with SCZ, scanned twice, before and after taking placebo medication for approximately one month.
The Intraclass Correlation Coefficient (ICC) [41] was computed separately for the healthy controls and patients datasets, and only repeatable radiomic features with an ICC > 0.80 for both cases were retained for further analyses. This threshold, which is consistent with a biomarker of good reliability [42], was selected based on the ICC performances obtained from [18F]FDOPA dynamic PET analysis, combining both healthy controls and patients with SCZ [28]. With this approach we made sure to select radiomic features for striatal [18F]FDOPA PET imaging as reliable Kicer estimates derived from dynamic PET imaging analysis.
Radiomic features are known to produce redundant information and to generally be highly correlated [43]. Dimensionality was reduced through hierarchical clustering based on the Spearman correlation coefficient (ρ) on the whole test–retest datasets.
The absolute correlation was computed for each pair of features and then used to create a dissimilarity matrix. Hierarchical clustering was then applied, to obtain clusters where each pair of features had a ρ of at least 0.90. Eventually, for each cluster, the feature with the highest ICC was selected, combining data for healthy controls and patients.
Feature harmonisationHarmonisation to correct for scanner effects and site inconsistencies was applied directly to the selected features using the NeuroCombat method [44, 45] (NeuroCombat python library version 0.2.10 +). We chose this approach for feature harmonization because of its broad applicability, straightforward statistical implementation, and proven effectiveness [46].
Harmonization was performed for both controls and patients using the same reference scanner. The effects of age and sex as covariates were preserved.
Statistical analysisStatistical analysis was performed using SPSS (version 29). The effect of sex and age was evaluated separately for healthy controls and patients, using a χ2 test for the categorical covariate (sex) and the Wilcoxon test for the continuous variable (age). An ANOVA was performed to evaluate the influence of age and sex on radiomic features, for healthy controls and patients.
Statistical differences between features in patients who were responders and non-responders were evaluated with a two-way ANOVA, with sex and age effects in the model and corrected with a False Discovery Rate (FDR) correction. Due to the high heterogeneity of the patient data at different illness stages, a separate ANOVA was performed for each patient subgroup. The mean striatal SUVr was included in the analysis, as the reference standard quantification metric. Statistical differences between the radiomic features in healthy controls vs. responders and healthy controls vs. non-responders were also evaluated with a two-way ANOVA, with sex and age effects included in the model. For the response classification, the Receiver Operating Characteristics (ROC) area under the curve (AUC) was computed using the pROC [47] package in R (version 4.2.1). The AUC was calculated for all the features and used as the performance index of the feature to identify non-responders within the whole cohort of patients and for each patient dataset. The AUCs were then compared between groups using the default options of the pROC [47] package in R (version 4.2.1). To validate the classification a random forest with k-fold cross validation (k = 10) was performed in R (version 4.3.1) using the packages randomForest (version 4.7.1.1) and caret (version 6.0.94) [48].
Comments (0)