This was a nonprofit, observational, monocentric study promoted by the Department of Clinical Internal, Anesthesiologic and Cardiovascular Sciences of Sapienza University of Rome. Consecutive patients with nonvalvular AF and obesity treated with DOACs to prevent thromboembolic stroke were enrolled in the Atherothrombosis Center of Policlinico Umberto I in Rome between April 2022 and April 2024.
Inclusion criteria were age > 18 years, documented nonvalvular AF [6], starting DOACs between 7 and 15 days before the enrollment (median 11 days; interquartile days 9–13) and obesity, defined as a BMI ≥ 30.0 kg/m2 [6, 16]. DOACs were prescribed according to European guidelines [6] and DOAC intake was verified on site.
During the first clinical examination, a complete personal medical history was collected, which included: comorbidities, cardiovascular risk factors (arterial hypertension, diabetes mellitus, heart failure, and metabolic syndrome), measurement of anthropometric factors (body weight, height, waist, and hip circumferences) with staging of obesity according to BMI, and collection of routine blood tests with complete blood count, creatinine, transaminases, and lipid profile). Information onwere smoking habits, type of oral anticoagulation, dose of DOAC, and other concomitant therapies was also collected. Previous cardiovascular disease was defined as history of coronary artery disease (either ischemic heart disease or coronary revascularization with stent or coronary artery bypass graft), while cerebrovascular disease was defined as previous ischemic stroke or transient ischemic attack (TIA).
All patients signed informed written consent at study entry. The study was approved by the local ethics committee of Sapienza University (no. 0234/2022) and was conducted according to the 1975 Declaration of Helsinki.
2.1 Definition of Obesity
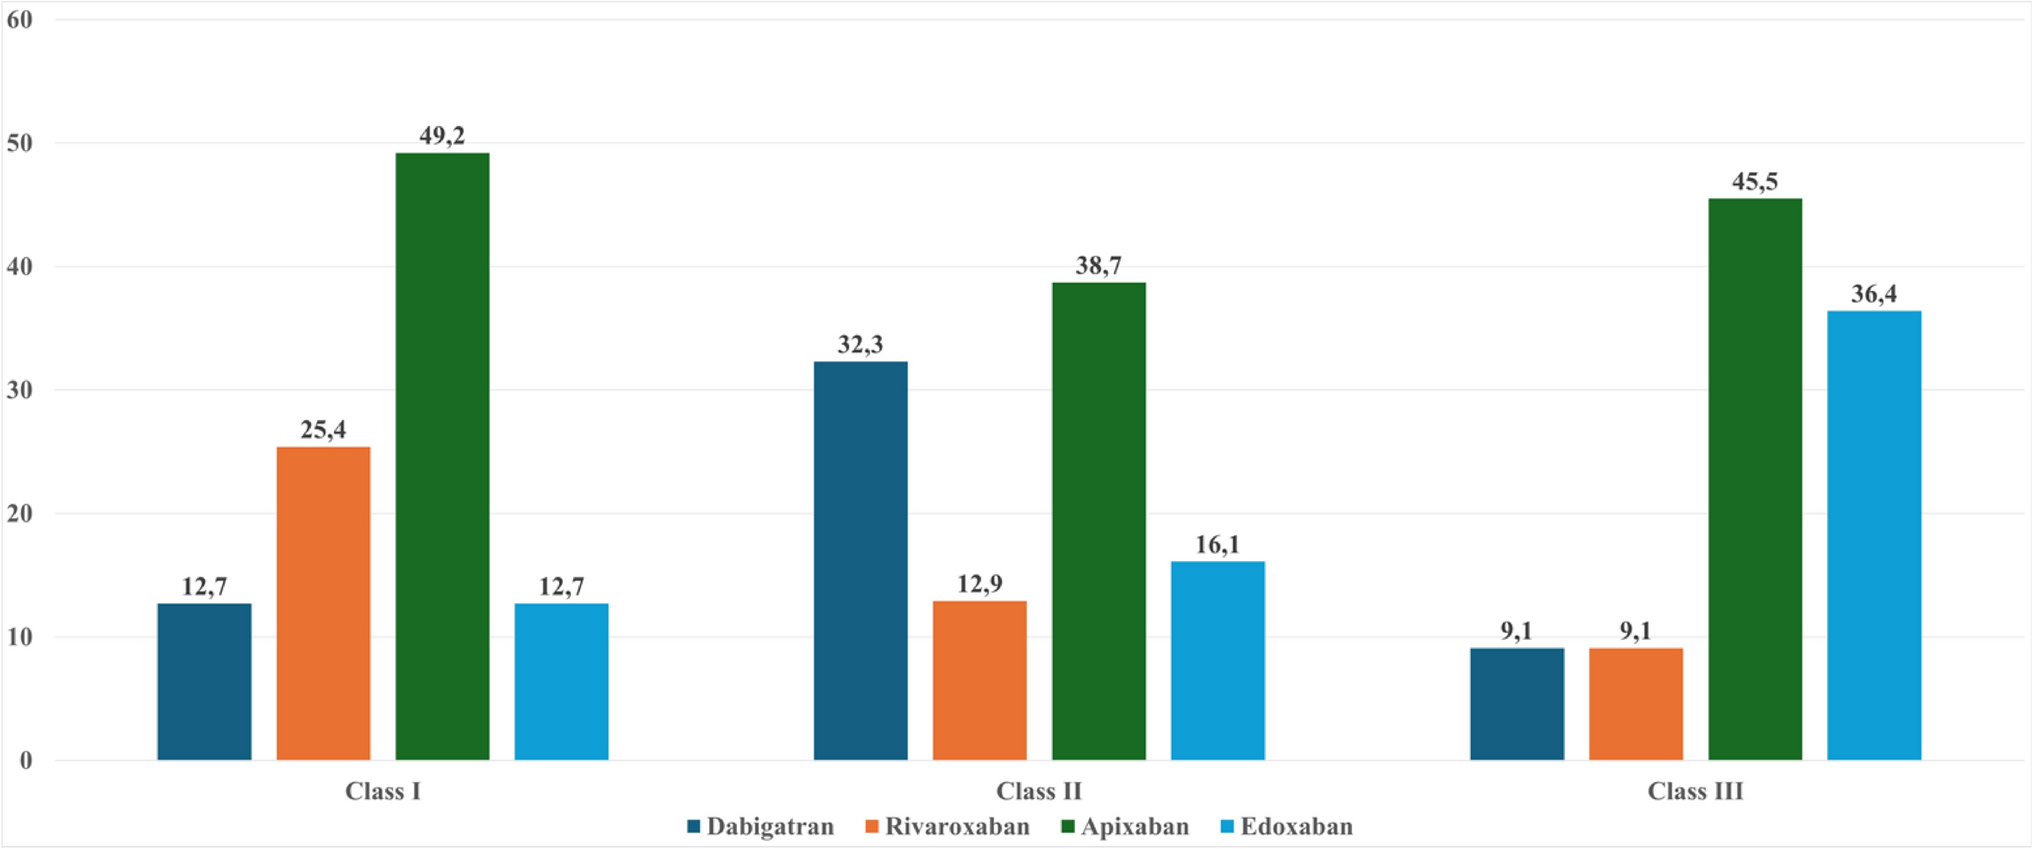
The World Health Organization (WHO) defines obesity as an “accumulation of abnormal or excessive fat that may compromise health with the fundamental cause being an energy imbalance between calories consumed and calories burned”[1]. The WHO [17] classifies adult obesity using the BMI with specific cut-offs. BMI is measured by calculating [(weight in kg)/(height in m2)] and is a simple index intended to classify adults into one of these categories: underweight if BMI is < 18.5 kg/m2, normal weight if BMI is between 18.5–24.9 kg/m2, overweight if BMI is 25.0–29.9 kg/m2, or obese if BMI ≥ 30.0 kg/m2. Patients with obesity were stratified into class I if they had a BMI of 30.0–34.9 kg/m2, class II for a BMI of 35.0–39.9 kg/m2, and class III for a BMI of ≥ 40.0 kg/m2.
2.2 Blood Sample Collection
Blood samples from patients with AF were collected in tubes with anticoagulant (3.8% sodium citrate) immediately before the administration of the last dose of DOAC to assess the trough plasma concentration and 2 h after DOAC intake to assess the peak plasma concentration. The tubes were centrifuged at 300 g for 10 min at room temperature to obtain plasma samples, which were then immediately stored at −80 °C.
2.3 Dabigatran Plasma Concentration
The plasma concentration of dabigatran was measured using the diluted thrombin time (dTT) assay, which is the test of choice for measuring the plasma concentration of dabigatran. To reduce the over-sensitivity of the test to thrombin inhibitors, patient plasma was diluted with a pool of normal plasma. The values were expressed as ng/mL and the results were obtained by interpolating the patient’s chromogenic activity on a dose-response curve obtained using calibrator plasmas at known drug concentration. The assay was performed using Siemens reagents, certified calibrators, and specific controls for dabigatran on the BCS Xp automated coagulometer (Siemens).
2.4 Rivaroxaban, Apixaban, and Edoxaban Plasma Concentration
Plasma concentrations of anti-FXa drugs (apixaban, edoxaban, and rivaroxaban) were measured by anti-FXa chromogenic assay. The test reflects the ability of plasma to inhibit FXa. It is performed by mixing the patient’s plasma with an excess amount of FXa. A specific chromogenic substrate is used to measure residual FXa. The lower the residual FXa, the higher the drug concentration. The values were expressed as ng/mL and the results are obtained by interpolating the patient’s chromogenic activity on a dose-response curve obtained using calibrator plasmas at known drug concentration. The assay was performed using Siemens reagents, certified calibrators, and specific controls for dabigatran on the BCS Xp automated coagulometer (Siemens).
See Supplementary Table 1 for the reference value of trough and peak plasma concentrations.
2.5 Endpoints of the Study
Our study aims to (1) investigate the plasma trough and peak concentration of DOAC and to evaluate the prevalence of patients with below-on therapy range concentrations, and (2) to evaluate the clinical factors associated with below-on therapy range of DOAC plasma concentrations with a focus on obesity class and type of DOAC administered.
2.6 Statistical Analysis
Categorical variables were reported as numbers and percentages and were compared with Pearson’s χ2 test. Mean and standard deviation (SD) or median and interquartile range (IQR) were used for continuous variables, which were compared using Student’s t-test or Mann–Whitney U test, respectively. Normal distribution of variables was checked by the Kolmogorov–Smirnov test. We divided the cohort into three groups according to the trough plasma concentration: (1) in range, (2) below-range, or (3) above-range, according to each DOAC specific on-therapy range. We also performed a descriptive analysis according to the type of DOAC prescribed and according to obesity class. Then, we performed a descriptive analysis according to peak plasma concentrations, below and in range.
Univariable and multivariable logistic regression analysis was used to calculate the relative odds ratio (OR) and 95% confidence interval (95% CI) for each factor associated with below-range trough and peak concentration, respectively. Given the relatively low number of patients, the multivariable models were adjusted for CHA₂DS₂-VASc score and BMI class.
All tests were two-tailed and only p-values < 0.05 were considered statistically significant. The analyses were performed using SPSS 25.0 software (IBM, Armonk, NY, USA).


Comments (0)