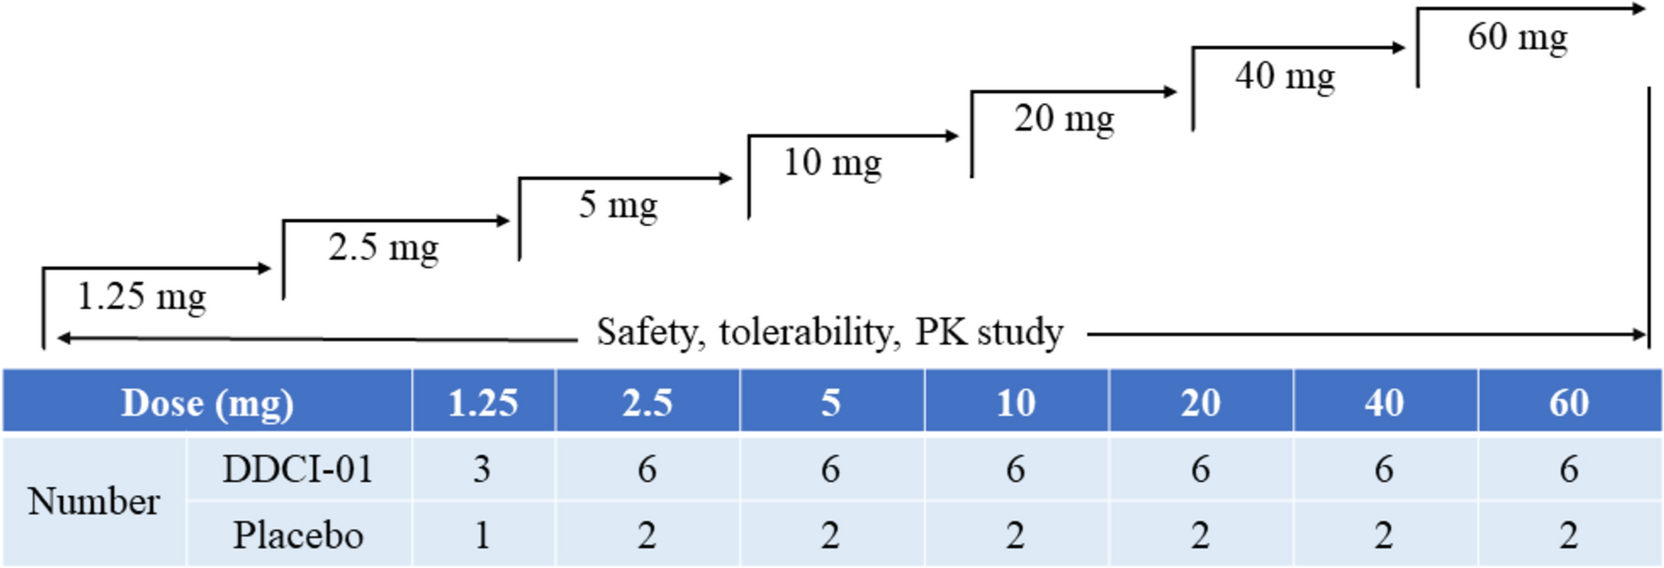
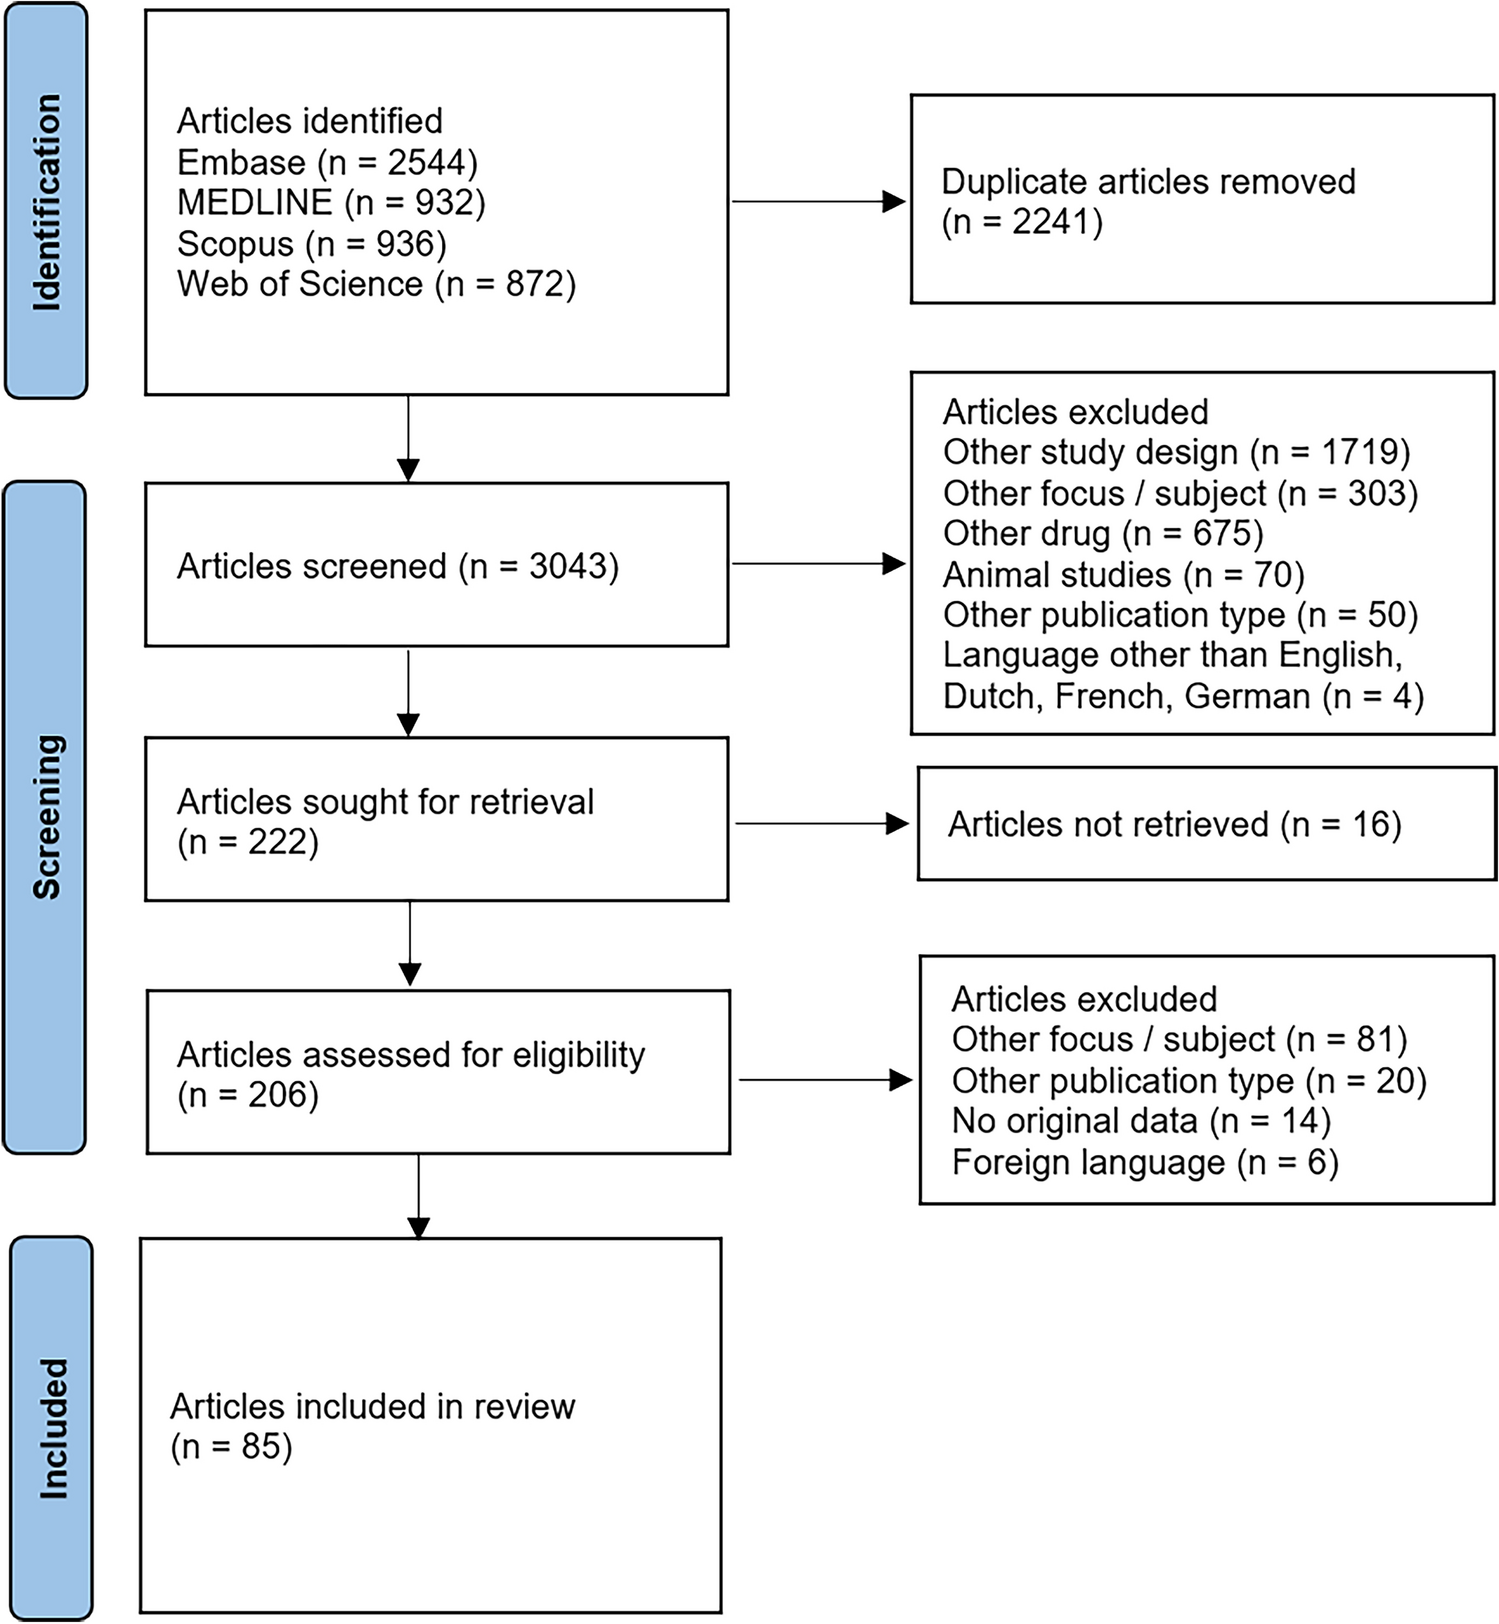
2.1 Study Design
This study was part of a broader prospective and observational research study conducted in the Cincinnati Children’s Hospital Medical Center (CCHMC) PICU between October 2018 and November 2021 to investigate the pharmacokinetics and therapeutic target attainment of ceftriaxone, cefepime, meropenem, and piperacillin/tazobactam. Study day 1 was defined as the first day the patient received a β-lactam antibiotic dose in the PICU as part of the parent β-lactam study. The study was approved by the CCHMC institutional review board with waiver of consent (#2018–3245, Pharmacokinetics of β-lactams in Critically Ill Pediatric Patients during Different Stages of Sepsis).
2.2 Study Population
This analysis included patients in the PICU aged 1 month to 30 years who received at least one dose of cefepime and had at least one total cefepime concentration measurement. Patients who received renal replacement therapy, including intermittent dialysis, continuous renal replacement therapy, peritoneal dialysis, or extracorporeal membrane oxygenation therapy were excluded.
2.3 Drug Dosing and Administration
Cefepime initiation and dosing regimens were determined by the clinical team for each patient. In our institution, cefepime is typically prescribed as a 50 mg/kg/dose (maximum 2000 mg/dose) every 8 h as a 30-min infusion in patients with preserved kidney function.
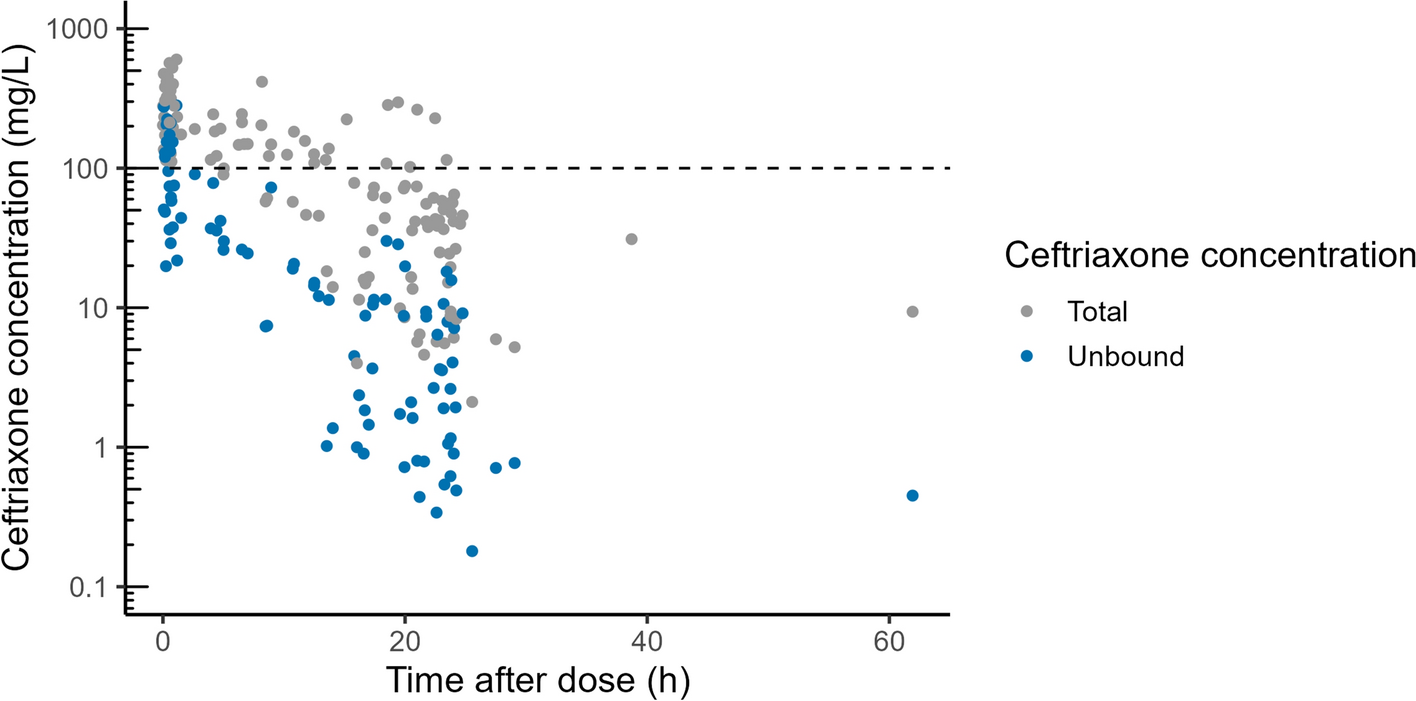
2.4 Blood Sampling and Cefepime Quantification
Blood samples were collected using a scavenged opportunistic sampling approach [9]. Residual blood from samples drawn as part of standard clinical practice during the first 7 days of β-lactam therapy was requested from the clinical laboratory and stored at 4 °C. Samples collected during cefepime infusion were excluded. Residual blood or plasma samples were centrifuged (2060×g, 4 °C, 10 min) within 5 days of collection from patients, and the supernatant was stored at – 80 °C for up to 120 days until total cefepime concentrations were measured via high-performance liquid chromatography.
Our group has previously described and used high-performance liquid chromatography to quantify cefepime concentrations in a feasibility study of the opportunistic sampling approach [9]. The assay range exhibited linearity from 0.5 to 200 μg/mL. The assay's precision and accuracy were assessed for quality control, with coefficients of variation maintained below 15% for both within-day and between-day measurements.
2.5 Clinical Data Collection
We reviewed electronic medical records to collect demographic and clinical data for up to 7 study days after initiation of cefepime therapy; data were stored in a secure REDCap database (see the electronic supplementary material [ESM] 1) [10].
Since fluid status is dynamic in patients in the PICU and can affect β-lactam pharmacokinetics [11], we carefully characterized fluid status by noting daily net fluid intake and output data to calculate daily net fluid balance (daily difference in all recorded intakes and all outputs). We then defined the cumulative percentage of fluid balance as the sum of all the previous days’ and present day’s percentage of fluid balance (sum of each day’s net fluid balance/PICU admission body weight × 100) [12]. We calculated the estimated glomerular filtration rate (eGFR) using the bedside Schwartz equation for patients aged <18 years and the Chronic Kidney Disease Epidemiology Collaboration equation for patients aged ≥18 years [13, 14].
When a clinical laboratory measurement was absent on a specific study day, we used the ‘last observation carried backward’ method. The most recent observed data point was extended to fill the missing data. If certain laboratory measurements were missing during a patient's hospital stay, it was imputed by substituting the missing data with the population median value [15].
2.6 Pharmacokinetic Analysis
We conducted the population pharmacokinetic analysis using nonlinear mixed-effects modeling in NONMEM, version 7.5 (Icon Development Solutions, Ellicott City, MD, USA), interfaced with Pirana, version 23.1.2 (Certara, Princeton, NJ, USA), with the first-order conditional estimation with the interaction method.
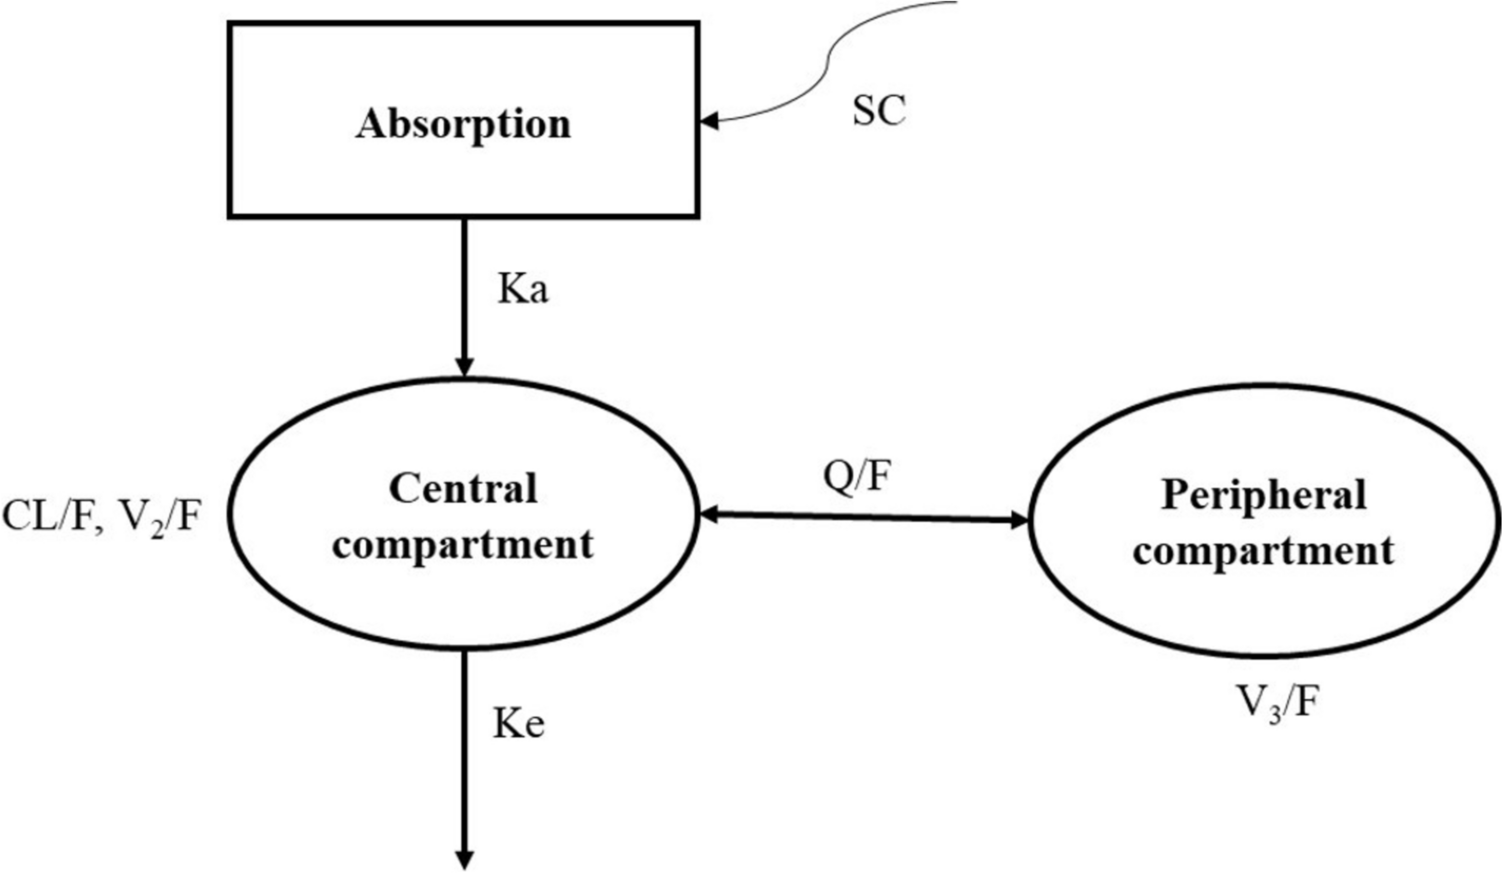
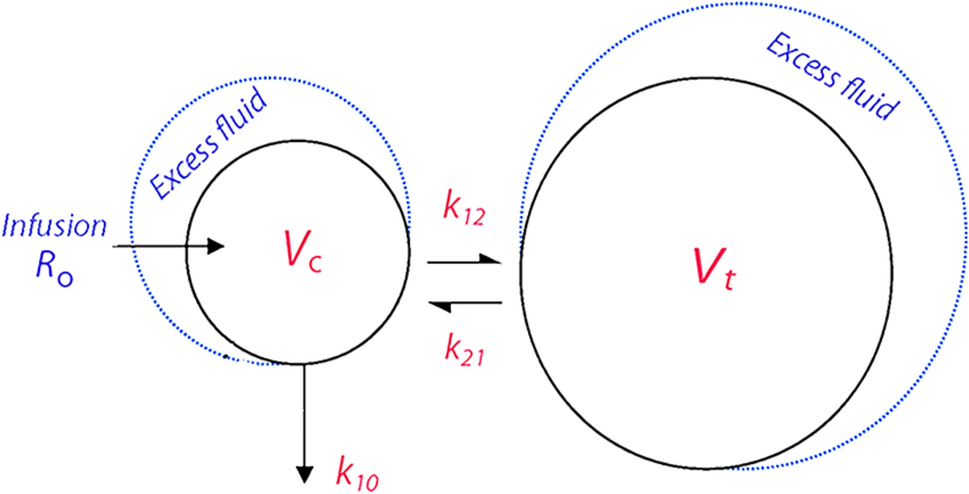
Both one- and two-compartment models with first-order elimination were tested as the structural model. Interindividual variability (IIV) was assessed as a random-effect ETA (ƞ) for each parameter THETA (θ) using an exponential model. IIV values were assumed to follow a normal distribution with a mean of 0 and variance ω2. To characterize the residual variability, we tested additive, proportional, and combined error models. Cefepime concentrations below the limit of quantification were treated with the Beal M6 method, replacing the observation with half of the limit of quantification [15].
We used allometric scaling to include body weight as a covariate in the base model, employing a power function with a fixed exponent of 0.75 for clearance parameters and 1 for volume parameters, and scaled to a typical adult weighing 70 kg [16]. We tested a maturation factor accounting for developmental changes in renal clearance using a Hill function [17] and assessed the effect of categorical and continuous covariates with biological plausibility with stepwise covariate modeling. During the forward inclusion phase, each covariate was added individually to the base model and included if its addition resulted in a reduction of the objective function value (OFV) by more than 3.84 (p < 0.05). In the subsequent backward elimination phase, each covariate was systematically removed from the full model, retaining those whose exclusion increased the OFV by at least 6.63 (p < 0.01). The final model included covariate effects that could be estimated with a relative standard error lower than 40%, ensuring the reliability and robustness of the parameter estimates.
The final model was internally validated through visual inspections of the goodness-of-fit diagnostic plots, including individual fit plots, observed versus population- and individual-predicted concentrations, scatter plots of the residuals, and a prediction-corrected visual predictive check. We performed a non-parametric bootstrap analysis, where a total of 1000 replicate datasets were generated through random sampling with replacement from the original dataset, and the median and 95% confidence intervals of the parameter estimates were compared with the final model estimates.
2.7 External Validation
We obtained an external dataset, distinct from the one used for model development, containing cefepime concentrations and clinical data from patients in the PICU, from a different prospective study conducted in the CCHMC PICU from November 2022 to August 2024. This distinct study investigated urine biomarkers as predictors of cefepime clearance. For this study, patients in the PICU at high risk of (but not necessary subsequently diagnosed with) acute kidney injury were followed for up to 7 days, and residual blood samples were collected for cefepime concentration measurement using the same scavenged opportunistic sampling approach already described. The risk for acute kidney injury was assessed as part of the standard care at our institution through an automated continuous Renal Angina Index assessment [18]. Cefepime initiation and dosing regimens were determined by the clinical team for each patient.
The final model was applied to the external dataset, and the predicted drug concentrations were compared with the corresponding observed concentrations. Goodness-of-fit plots were created to visualize the relationship between observed and predicted concentrations. We calculated the median prediction error (MDPE) to quantify the model’s bias and calculated the median absolute prediction error (MDAPE) to assess the precision of the model's predictions. We also compared the a posteriori predictions, known as Bayesian or individualized predictions, with the corresponding observed concentrations to assess the model's individual-level performance.
We compared the demographics and clinical characteristics of patients in the model-building cohort and the external validation cohort using the Mann–Whitney U test for continuous variables and the chi-squared test for categorical variables. A p value < 0.05 was considered statistically significant for all comparisons.
2.8 Monte Carlo Simulations
The final model was implemented in Simulx software (2023R1 version, Lixoft, Antony, France) for Monte Carlo simulations.
We created a simulation dataset comprising 6000 patients, equally divided among infants (1 month to 2 years), children (2–12 years), adolescents (12–18 years), and young adults (18–30 years), using a random selection from the CDC-NHANES demographic database, with paired age–weight data [19]. Within each age bracket, eGFRs were classified into three categories: kidney impairment, normal eGFR, and augmented renal clearance (ARC). Normal eGFR was defined as values within two standard deviations of the age-specific median for healthy population, kidney impairment was identified as less than two standard deviations below the median, and ARC as values exceeding two standard deviations above the median, up to six standard deviations [13, 20, 21]. For simulations, the cumulative percentage of fluid balance was set to 0% for all patients.
We then assessed the probability of target attainment (PTA) after steady state (24 h after starting antibiotic treatment) for different cefepime dose regimens: 50 mg/kg (maximum 2000 mg/dose) every 6, 8, 12, or 24 h, administered with a 30-min or 3-h infusion duration and continuous infusions of 30 to 180 mg/kg per day (maximum 6000 mg/day). We sought to discern dosing regimens that ensured at least 90% of simulated patients had free concentrations above three distinct pharmacodynamic targets: 50% fT>MIC, 100% fT>MIC, and 100% fT>4×MIC, using the 2023 Clinical & Laboratory Standards Institute cefepime breakpoints of MIC 2 mg/L for Enterobacteriaceae and MIC 8 mg/L for Pseudomonas aeruginosa [22]. We assumed a fixed 20% protein binding to calculate free cefepime concentrations.


Comments (0)