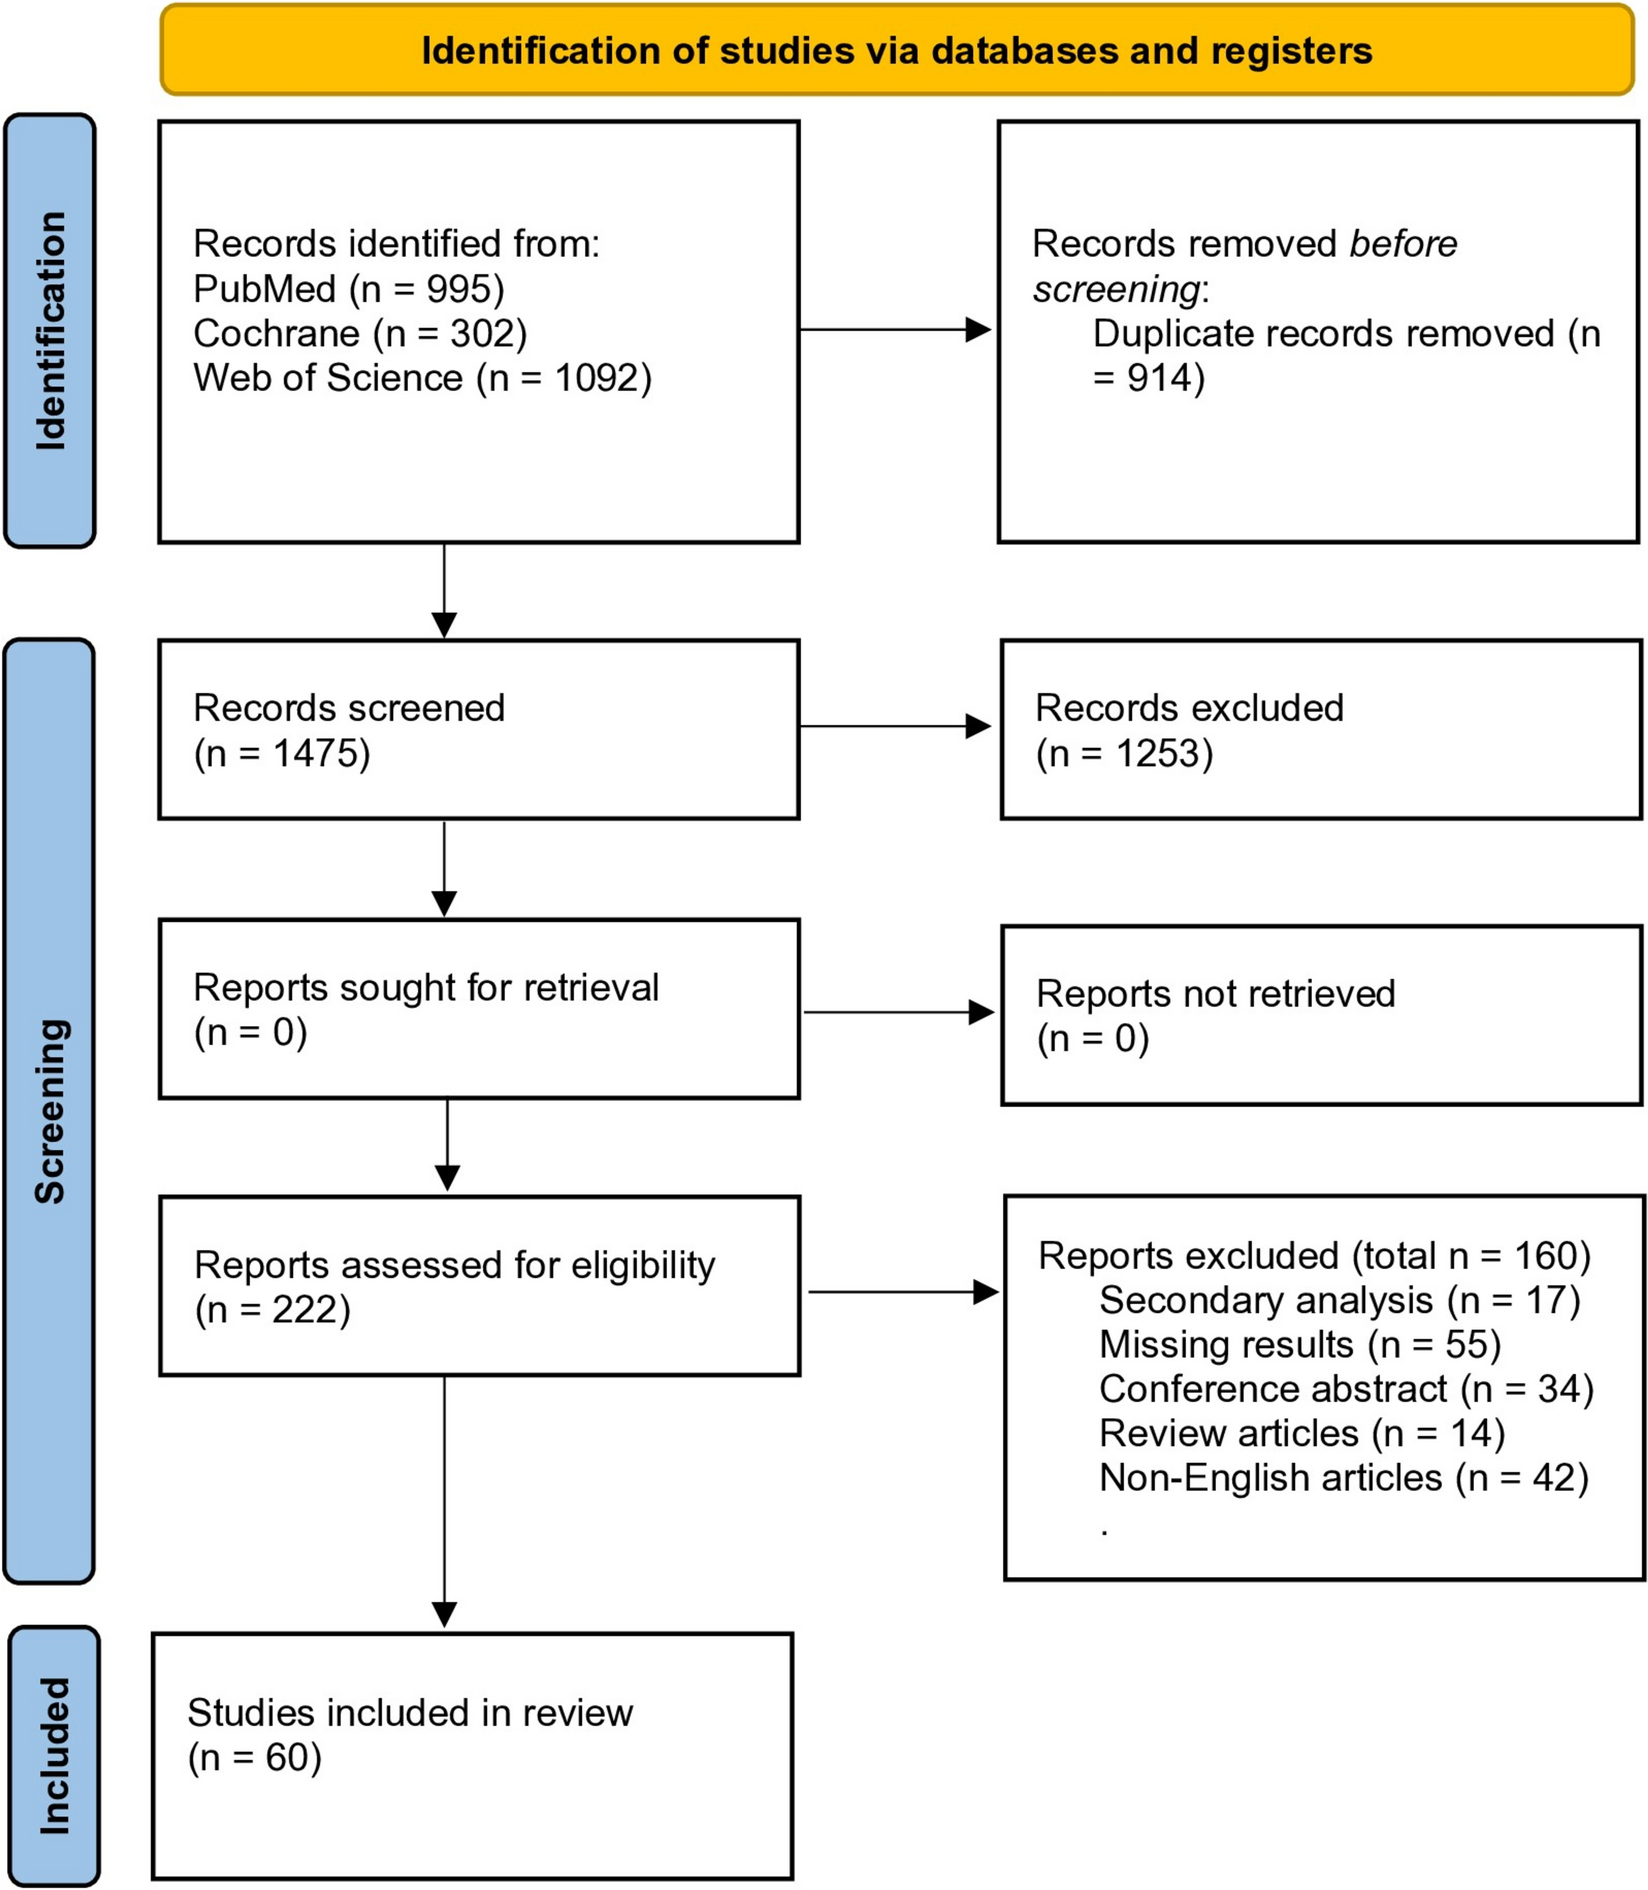
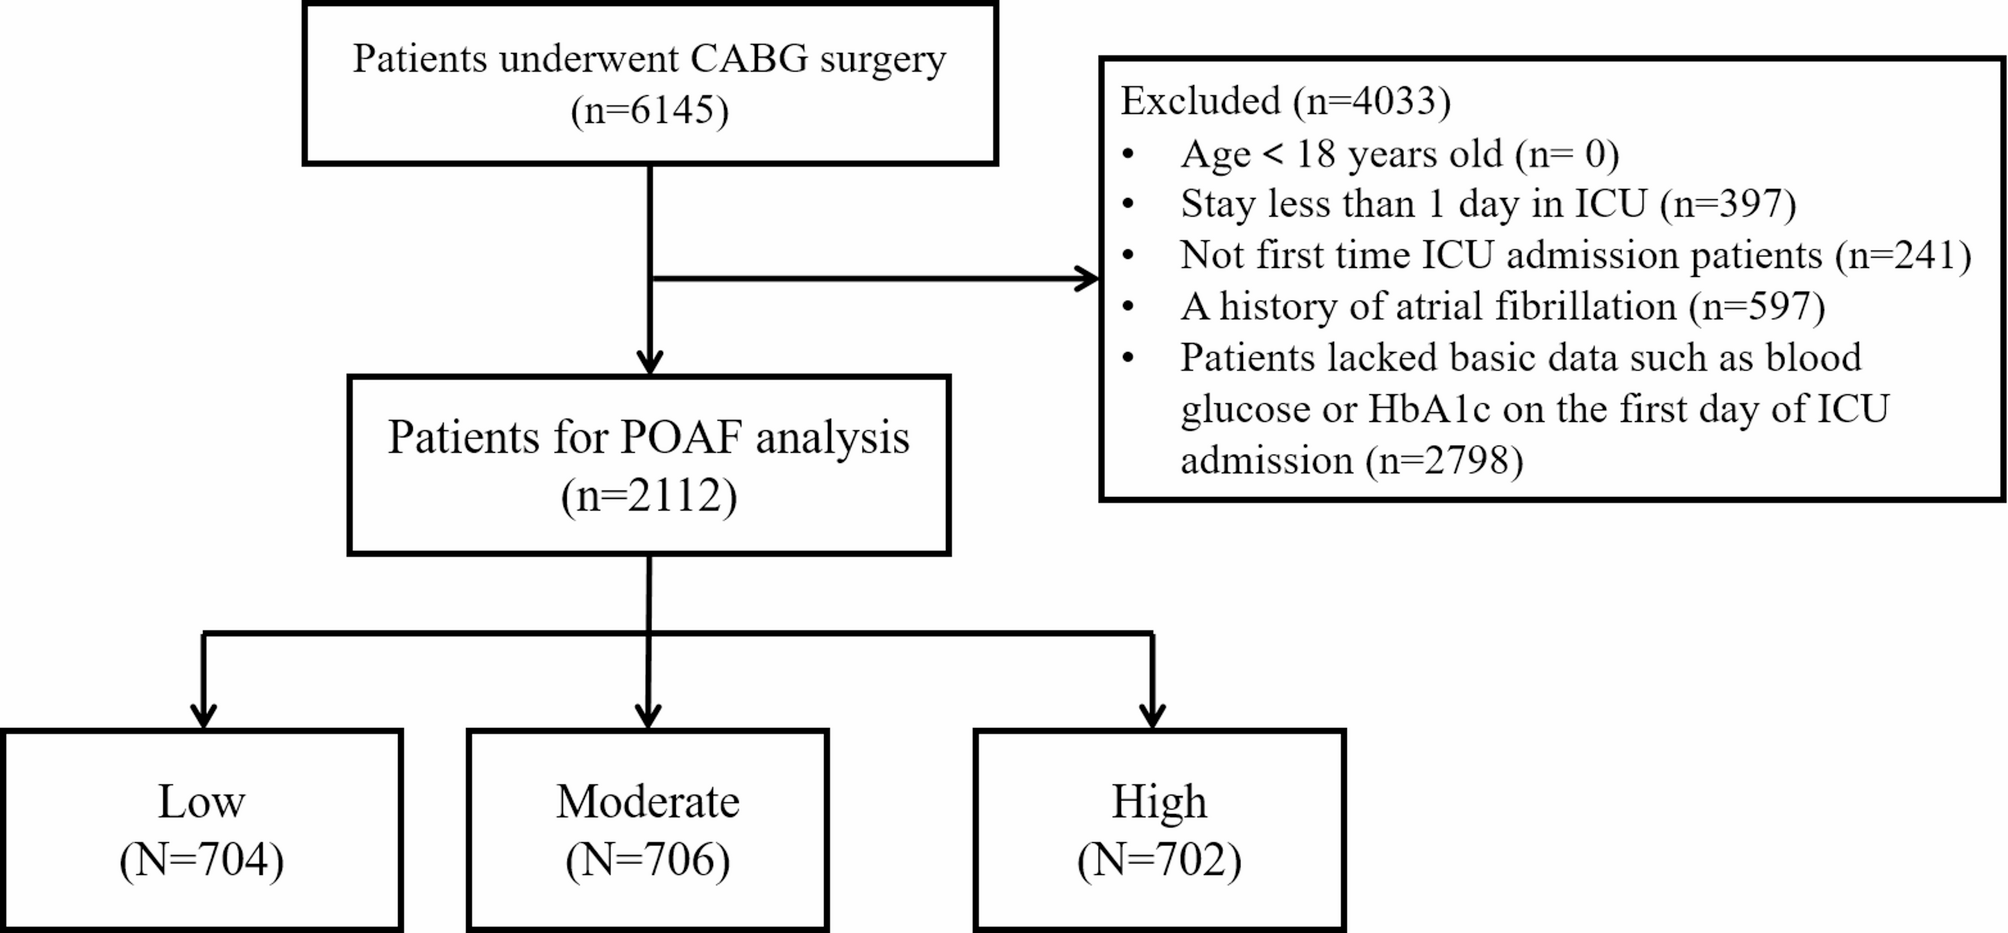
Study population
The National Center for Health Statistics (NCHS) Ethics Review Board approved the research protocols of the National Health and Nutrition Examination Survey (NHANES), and all participants provided written informed consent. Details of the NHANES have been described in previous research [12]. Our study included six cycles of NHANES data from 2007–2008 to 2017–2018, focusing on individuals aged 18 years or older living with type 2 diabetes. Type 2 diabetes was diagnosed based on self-reporting, fasting plasma glucose levels ≥ 7.0 mmol/L, or plasma HbA1c levels ≥ 6.5% (or 48 mmol/mol) [13]. Out of 59,842 adults, 6089 were diagnosed with type 2 diabetes. We excluded pregnant women (n = 7), individuals without PA records (n = 4), and probable subjects living with type 1 diabetes (defined as those under 20 years old who were only using insulin) (n = 11) [14]. Ultimately, the analysis included 6,067 participants living with type 2 diabetes (Additional file 1: Fig S2).
Evaluation of PA
PA was assessed using the Global Physical Activity Questionnaire [12]. Frequency and duration of sessions were collected according to 8 questions (Additional file 1: Table S1). Leisure-time PA was defined as sports, fitness, or recreational activities. Occupational PA included work and chore-related activities. MPA and VPA were characterized by relatively small and large increases in breathing or heart rate, respectively. According to PA guidelines, 1 min of VPA was considered equivalent to 2 min of MPA [15]. Leisure-time and occupational MVPA was calculated by multiplying frequency and duration of sessions. Therefore, the quantification of MVPA (min/week) was calculated with the formula: 2 × VPA + MPA. The amount of total MVPA were calculated by summing leisure-time and occupational MVPA minutes. A detailed example was shown in Additional file 1: Methods-S1.
Of leisure-time, occupational and total PA, participants were categorized into 3 groups: inactive, accumulating less than 150 min/week of MVPA; weekend warrior, accumulating at least 150 min/week of MVPA in 1 or 2 sessions; physically active, accumulating at least 150 min/week of MVPA in 3 or more sessions. Lastly, for leisure-time, occupational and total PA, the weekend warrior and regularly active groups were further categorized according to duration in each session (calculated as MVPA minutes divided by weekly sessions) and intensity (calculated as the VPA divided by MVPA). The MVPA duration in each session and intensity levels were defined as: ≤ 30 or > 30 min/session, ≤ 30% or > 30%, respectively. A detailed example was shown in Additional file 1: Methods-S2.
Mortality ascertainment
To ascertain mortality data in the study population, the NHANES public-use linked mortality file through December 31, 2019, incorporating a distinct study identifier, was employed [16]. The data linkage between this file and the National Death Index was conducted by the NCHS using a probability matching algorithm. Additional information regarding the specific matching methodology can be obtained directly from the NCHS [17].
Covariates
Information on various covariates, including age, gender, race and ethnicity, levels of education and income, marital status, cigarette smoking, alcohol intake, and diet quality were obtained through standardized questionnaires. Educational and income levels, marital status, cigarette smoking, and alcohol intake were each categorized into 3 groups. According to federal poverty income ratio (PIR), income levels were classified into 3 levels. Healthy eating index-2015 (HEI-2015) was used to evaluate diet quality [18], then divided into tertile. Body mass index (BMI) was calculated as weight (kg) divided by the square of height (m), then categorized into 4 levels. To consider participants’ heath condition, self-reported diagnoses of hypertension and high cholesterol, were also considered. Familial diabetes was assessed using the question, “Including living and deceased, were any of your close biological that is, blood relatives including father, mother, sisters or brothers, ever told by a health professional that they had diabetes?”.
Handling of missing variables
Additional file 1: Table S2 showed the distribution of missing variables among adults living with type 2 diabetes in this study. Multiple imputation method was employed to maintain the largest possible sample size.
Statistical analysis
Although subsample weights are provided for each group, the NCHS advises against using them because combining subsamples can reduce the sample size, leading to unstable and unreliable statistical estimates [19, 20]. Therefore, the associations of PA patterns with all-cause and cause-specific mortality rates were assessed using unweighted Cox proportional hazards regression models, with calendar time (months) as the time variable. Hazard ratios (HRs) and 95% CIs were calculated, and covariates adjusted in models were selected according to previous studies [21, 22]. Model 1 was adjusted for age, gender, race and ethnicity. Model 2 was further adjusted for educational attainment, income, marital status, smoking, alcohol intake, HEI-2015, high blood cholesterol, family diabetes, and hypertension, then Model 3 was further adjusted for BMI based on Model 2. The possibility of type I error may have been elevated because of multiple comparisons, and as a result, caution is warranted when interpreting the findings. To evaluate interaction incorporating the cross-terms of PA patterns and gender, the adjusted Wald test was used. Given the absence of evidence for interaction by gender, the results were presented for the whole participant sample.
Two sensitivity analyses were performed to assess the robustness of our findings in adults living with type 2 diabetes. In the first sensitivity analysis, of leisure-time and occupational PA, individuals engaging in ≥ 600 min/week of PA were excluded in order to address variability of different exposure and improve comparability between weekend warriors and regularly active participants. In the second sensitivity analysis, individuals who passed away within the first 24 months of follow-up were excluded to mitigate potential confounding from preexisting diseases. The statistical analysis was completed in January 2024 using SPSS software (version 26; IBM Corp), with all tests being two-tailed and statistical significance defined as P < 0.05.

Comments (0)