
Remember me
Pain is a perceptual discomfort and emotional experience associated with actual or latent organ damage,[1] which originates from a variety of complex neural mechanisms exogenous to the entire spinal cord and brain tissue,[2] among which CPSP, defined as pain in and around the surgical area for more than 2 months, excluding causes such as disease recurrence or inflammation,[3] as a bprevalent complication, posing a persistent challenge for effective treatment.[4] A previous study showed that 75% of patients who had undergone major surgery developed CPSP,[5] while 70% reported persistent pain despite taking painkillers. Therefore, improving post-operative analgesia is essential to reduce post-operative morbidity and mortality rates. Methods for controlling CPSP include drug therapy, anesthesia, cognitive therapy, and behavioral methods.[6,7] However, effective prevention and treatment measures for CPSP remain elusive, and its pathogenesis is complex.
CPSP is neuropathic pain caused by peripheral neurosurgical trauma.[8] Studies have shown that a chemotactic factor related to peripheral nervous system diseases, microsecretory chemotactic protein, can promote the progression of neuroinflammation and cause CPSP.[9] Furthermore, chemotactic factors stimulate the migration and activation of microglial cells, thereby regulating neuropathic pain.[10] Among them, CXCR2, as a novel chemokine, not only promotes the local immune response, especially the recruitment and activation of neutrophils,[11] but also plays a crucial role in mediating inflammation and neuropathic pain.[12] Other studies have shown that CXCR2 is highly expressed in a chronic compressive injury-induced neuropathic pain model,[13,14] and SB225002, a specific CXCR2 antagonist, significantly inhibited the microglial activity and production of proinflammatory cytokines in cultured microglia exposed to lipopolysaccharide (LPS), effectively alleviated mechanical and cold hypersensitivity in the aftermath of peripheral nerve injury.[14]
The inhibition of JAK1/STAT3 signaling pathway has shown potential in alleviating neuropathic pain caused by both inflammatory and non-inflammatory mechanisms[15,16] and has been identified as a drug target for chronic pain through transcriptomics.[17] Moreover, the increased guanine nucleotide exchange protein conversion factor(GEFs) directly regulated by cAMP (cAMP-GEF, EPAC, Epac)1 signaling is a factor in CPSP. This study indicated that the high expression of CXCR2 activates the JAK1/STAT3 signaling pathway, enhances EPAC1 activation in microglial cells, and exacerbates CPSP.[18-22]
Thus, we hypothesized that CXCR2 activates the JAK1/STAT3 signaling pathway, improves EPAC1 expression, and activates microglia to aggravate CPSP. This study utilized in vivo and in vitro models of CPSP to investigate the effects of CXCR2 on the development of CPSP and its underlying mechanisms.
MATERIAL AND METHODS Animal experimentsAdult Sprague-Dawley (SD) rats (male, 200–240 g, 40 in total) were housed in plastic cages (5 rats in a cage) with sawdust as bedding and supplied with food and drinking water. The animals were kept under controlled conditions of 50% humidity, a temperature of 25°C, and a 12-h light-dark cycle. We established a CPSP rat model similar to clinical operations through femoral incision traction. Under general anesthesia, two small traction devices were cut from the inside of the thigh to the surface muscles. Stretch the tissue for an hour, which may stretch the sciatic nerve. The pain performance of skin/muscle incision and retraction (SMIR) rats were evaluated by measuring the stimulation of the hindfoot and the contraction process. The first experiment was divided into two groups randomly: Control and Model, and the second experiment was divided into three groups randomly: Control, Model, and Model+SB225002. Eight animals from each group were tested in parallel, and the test was repeated three times. The CPSP rats were randomly assigned to Model and model+SB225002, and rats without SMIR served as controls. For SB225002 (S7651, Selleck, Houston, TX, USA) treatment, the rats were anesthetized using 2% isoflurane (26675-46-7, Solvay Solutions UK Ltd., UK). The skin around the waist was shaved and sterilized. The L5-L6 vertebral space was located by palpation. A 29-gauge needle (B-D Inc., Toledo, OH, USA) was used to inject 10 μg of SB225002 into this space. A tail-flick reaction confirmed a successful injection.[23] After treatment, the rats were anesthetized with 1.5% sevoflurane (Shanghai Hengrui Pharmaceutical Co., Ltd., Shanghai, China) inhalation and euthanized with 50% carbon dioxide volume/min. Serum was taken at the end of the in vivo experimental treatment and before carbon dioxide asphyxia after anesthesia for subsequent assays. This ensured that the rats were painless. The dorsal horn of the spinal cord was extracted for further analysis.
The ethical standard of experiments was in accordance with the guidelines provided by the Committee for the Purpose of Control and Supervision of Experiments on Animals (CPCSEA), and all the procedures were approved by the Animal Ethics Committee of the Laboratory Animal Center of Nantong University (IACUC20230215-1004).
Paw withdrawal threshold (PWT) testThe PWT test using von Frey filaments (37450-275, Ugo Basile, Italy) was conducted at 9:00 am on days 0, 1, 4, 7, 14, and 21. The rats were placed in transparent boxes with grid bottoms and acclimated for 40 min. Different weights of von Frey filaments (2 and 15 g) were applied to the right hind paw for a maximum of 3 s. Positive responses such as sudden withdrawal, shaking, and licking were recorded. The PWT was determined as the minimum force required to elicit a positive response in at least three out of five trials.
ImmunofluorescenceSpinal dorsal horn tissue was fixed with 4% paraformaldehyde (P0099-500 mL, Beyotime, China) for 24 h at room temperature, and sections were permeabilized with 0.2% Triton X-100 (ST797-500 ML, Beyotime, China) solution for 20 min at room temperature. Sections were washed with phosphate-buffered saline (PBS) (C0221A, Beyotime, China) (3 × 10 min, China) and blocked with bovine serum albumin (BSA) (ST2249-100 g, Beyotime, China) for 2 h at room temperature. Primary antibodies against Iba1 (17198S, CST, USA. Diluted 1:100) were then incubated overnight at 4°C. After washing with PBS, it was ligated to goat secondary antibody (4412S, Alexa Fluor® 488 Conjugate, CST, USA. Diluted 1:500). Nuclei were stained with 4’, 6-diamidino-2-phenylindole (DAPI) (C1002, Beyotime, China). Finally, the image was taken under a Zeiss fluorescence microscope (Zeiss, Oberkochen, Germany). The results of all immunofluorescence experiments were quantitatively counted by ImageJ (V.1.8.0, LOCI, University of Wisconsin, Madison, WI, USA) and statistical graphs drawn by GraphPad Prism 9 (Dotmatics, Boston, MA, USA).
Cell culture and treatmentPrimary microglial cells were isolated from the sham-operated rats. Spinal cord tissue was dissected and immersed in Hanks’ Balanced Salt Solution (14025076, ThermoFisher, Waltham, MA, USA). After mincing the tissue into 1 mm pieces and filtering it through a 100 μm nylon mesh, the cells were centrifuged at 3000 g for 5 min. The supernatant was discarded and resuspended in complete medium to obtain mixed glial cells. After being cultured in culture dishes for a period of time, microglia cells were purified by the Differential Adherence Method. The purified microglia cells (with no mycoplasma detected) were resuspended in complete Dulbecco’s Modified Eagle Medium (DMEM) (C0891-500 mL, Beyotime, China) and plated in 6-well plates at a density of 3 × 10⁵ cells/ well. The cells were then cultured for two weeks. Once the cells reached 95% confluence, a proinflammatory response was induced by adding LPS (ST1470-50 mg, Beyotime, China) at a 100 ng/mL concentration. Using Lipofectamine 2000 (11668500, Thermofisher, Waltham, MA, USA), LPS-induced primary microglia cells (1 × 10⁵ cells/well) were transfected with si-CXCR2 or si-EPAC1 (Ruibo Bio Co., Ltd., Guangzhou, China) for 24 h at 37°C. The cells were divided into seven groups: control, LPS, LPS+si-NC, LPS+si-CXCR2, LPS+si-CXCR2+Interleukin (IL)-6 (30 ng/mL), LPS+si-CXCR2+IL-6 (30 ng/mL)+siNC, and LPS+si-CXCR2+IL-6 (30 ng/mL)+si-EPAC1. Cells were then collected to analyze cell function, and RNA and proteins were extracted from the cells for gene expression analysis. The sequence of siRNA is as follows: si-NC 5'-AAAUUACUUGAGGCACAGUAU-3', siCXCR2-001 5'-GGAUUAAGUUUACCUCAAAGA-3', si-CXCR2-002 5'-CAGCGAACCUAGAUAUCAACA-3', si-CXCR2-003 5'-GUGGAGAUAUUGACAGUUACA-3'; si-EPAC1-001 5'-GGGUCAGCGUACAGAUGAAGA-3', siEPAC1-002 5'-CCACAGAGCAUGUGCACAAGG-3', and si-EPAC1-003 5'-CGGAGGGCACGCUGCUCAAUA-3'.
Primary microglia purity identificationPurified microglia were seeded in 24-well plates at a density of 105 cells/mL. The microglia were fixed with 4% paraformaldehyde for 15 min at room temperature. After washing, the microglia were permeabilized in 0.3% Triton X-100 for 10 min and blocked with BSA for 1 h. Subsequently, the cells were incubated overnight at 4°C with a primary antibody against CD11b (ab52478, Abcam, Cambridge, UK. Diluted 1:250). Following PBS washing, the microglia were incubated with a Goat Anti-Rabbit IgG H&L (Alexa Fluor® 488) (ab150077, Abcam, Cambridge, UK. Diluted 1:250) for 1 h. Nuclear staining was performed by incubating the cells with DAPI for 90 s. Finally, the preparation was mounted on a slide and imaged using fluorescence microscopy.
Measurement of IL-1α and tumor necrosis factor-α (TNF-α) using enzyme-linked immunosorbent assay (ELISA)The concentration of IL-1α (PI563, Beyotime, China) and TNF-α (PT516, Beyotime, China) in spinal dorsal horn tissue or cell supernatant was measured using commercialized ELISA kits based on the operating manual. Absorbance was determined using a microplate reader (BMG LABTECH, Offenburg, Germany).
5-ethynyl-2’-deoxyuridine (EdU) assayCell proliferation was determined using an EdU assay (C0071L, Beyotime, China). The cells were seeded on a laser scanning plate at a density of 1 × 10⁶. After pretreatment, the cells were incubated with 50 μM EdU buffer 37°C for 120 min. Fixation was carried out using 4% paraformaldehyde, permeabilization with 0.1% Triton X-100, and nuclear staining with DAPI. Tissue sections were prepared using a fluorescence microscope, and the growth rate was analyzed using ImageJ.
Gene ontology (GO) analysis and Kyoto Encyclopedia of Genes and Genomes database (KEGG) signaling pathway enrichment analysisGO enrichment analysis and KEGG pathway enrichment analysis were performed using String v12.0 (Available at: http://stringdb. org. Accessed: 8 August 2024) to analyze the biological processes and signaling pathways involved in CXCR2 and related genes. Enrichment bubble plot was plotted by https://www.bioinformatics.com.cn (Accessed: 7 August 2024), an online platform for data analysis and visualization.
Integration of the protein-protein interaction (PPI) networkInteractions between CXCR2, JAK1, STAT3, and EPAC1 (RAPGEF3) were analyzed using the STRING database.
Interactions with a combined score of >0.700 were considered statistically significant.
Quantitative reverse transcription-polymerase chain reaction (PCR)The RNA was extracted using the TRIzol (15596026, Thermofisher, Waltham, MA, USA) method and converted to cDNA using a cDNA synthesis kit from Boyotime (D7170L, Boyotime, China). PCR was performed on an ABI 7900 fluorescence quantitative PCR instrument (ABI, USA). Primers were as follows: CXCR2 (rat): 5'-TCTGTTCTTTGCCCTGACCT-3' and 5'-GTACTTGTGGCGTGGACGAT-3',EPAC1 (Rapgef3) (rat): 5'-TCCTCCTGTCATCCCTTTCA-3' and 5'-GCCATCATTCGCATCTTCTCA-3' (shown in Rapgef3 Rap guanine nucleotide exchange factor 3 [Rattus norvegicus (Norway rat)] - Gene - NCBI (nih.gov)), β-actin (rat): 5'-GGGAAATCGTGCGTGACATT-3' and 5'-GCGGCAGTGGCCATCTC-3'. The expression of β-actin was used to standardize mRNA expression, employing the 2-ΔΔCT method for calculation.
Western blotting techniqueProteins were extracted from tissues and cells using radioimmunoprecipitation assay (RIPA) lysis buffer (sc- 24948, Santa Cruz Biotechnology, Dallas, TX, USA). The obtained proteins were transferred to a polyvinylidene fluoride film and sealed with 5% skim milk. Subsequently, an antimicrobial agent was added to the polyvinylidene difluoride (PVDF) (FFP28, Beyotime, China.) film at 4°C to make it overnight. The PVDF membranes were then incubated with human or rat polyclonal antibodies for p-JAK1 (74129S, CST, USA. Diluted 1:1000), JAK1 (3344S, CST, USA. Diluted 1:3000), p-STAT3 (9145S, CST, USA. Diluted 1:2000), STAT3 (30835S, CST, USA. Diluted 1:2000), EPAC1 (4155S, CST, USA. Diluted 1:1000), and CXCR2 (ab65968, Abcam, UK. Diluted 1:2000) and β-actin (ab8227, Abcam, UK. Diluted 1:2000), followed by secondary antibody (ab6721, ab97245, Abcam, UK. Diluted 1:5000). Blots were visualized using enhanced chemiluminescence, with β-actin serving as an internal reference protein. Protein expression levels were quantified using the ImageJ software.
Statistical analysisData were analyzed using the SPSS (version 23.0, IBM Corp., Armonk, NY, USA.). Continuous variables were calculated as means and standard deviations. Statistical tests, such as t-tests, one-way analysis of variance, and Least Significant Difference (LSD) tests, were used to compare differences between groups. A significance level of P< 0.05 was considered statistically significant.
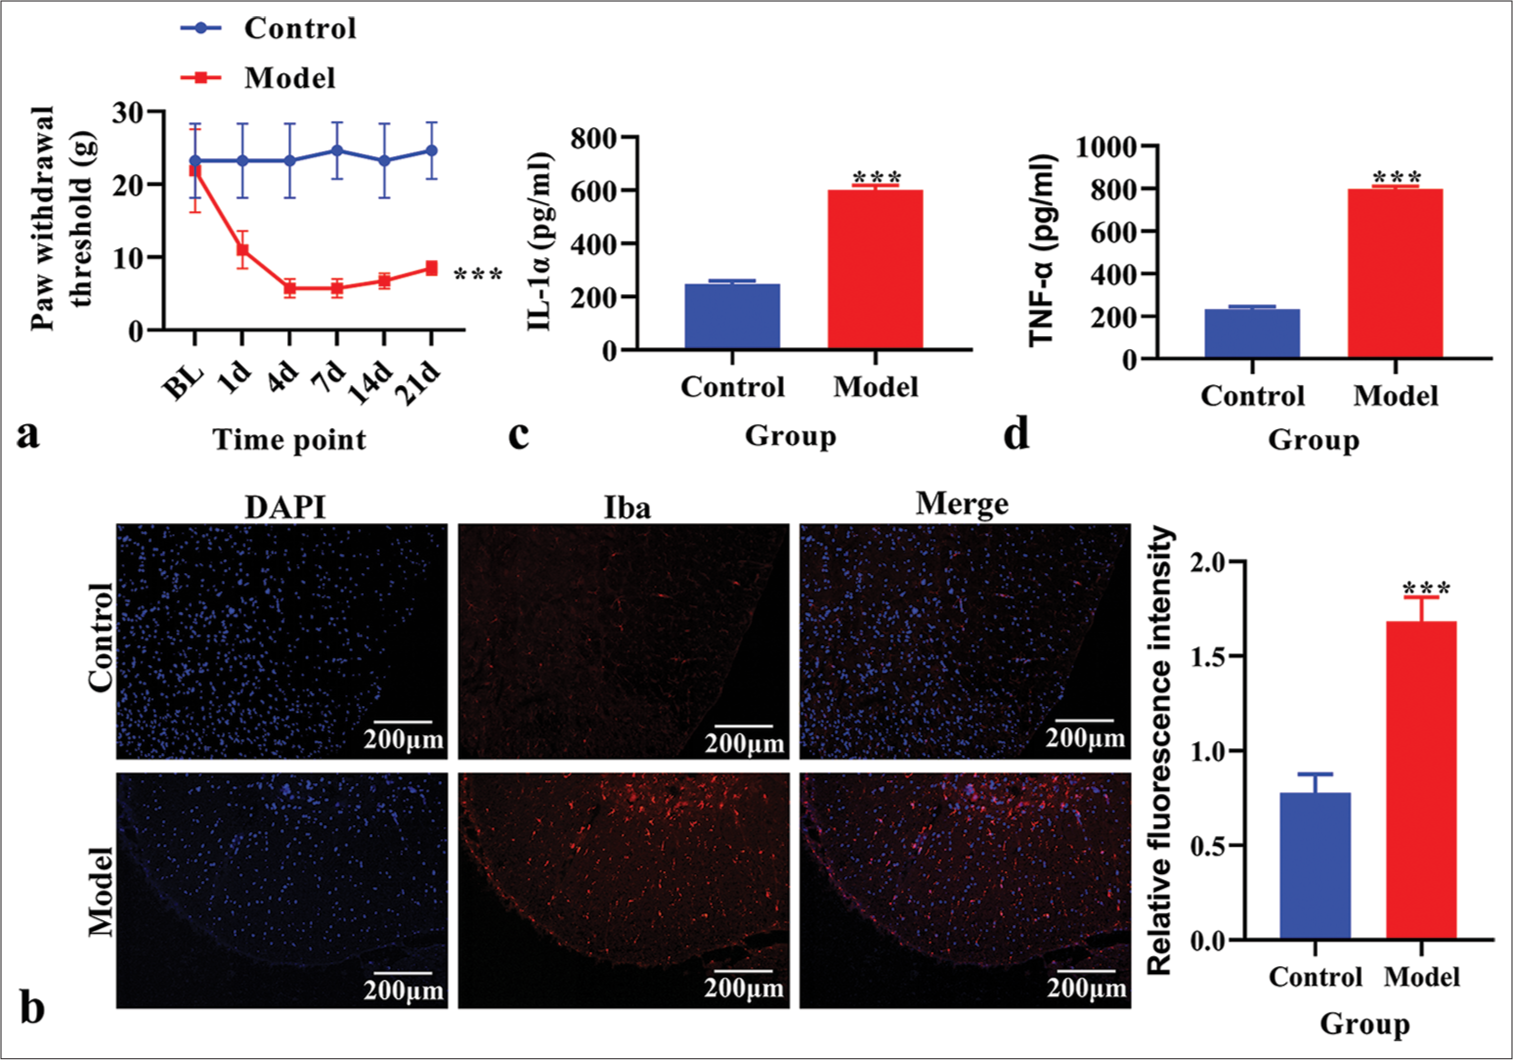
RESULTS Establishment and identification of the CPSP modelFirst, we determined the PWT in the CPSP model group and control group rats. The PWT was significantly reduced in the CPSP model group [P < 0.05, Figure 1a]. Immunofluorescence analysis revealed an increased microglial cell marker Iba1 level in the CPSP model group [Figure 1b]. The content of IL-1α and TNF-α in spinal dorsal horn tissue was measured using ELISA. The levels of IL-1α and TNF-α were significantly increased in the CPSP model group compared to the control group [P < 0.001, Figure 1c and d].
Export to PPT
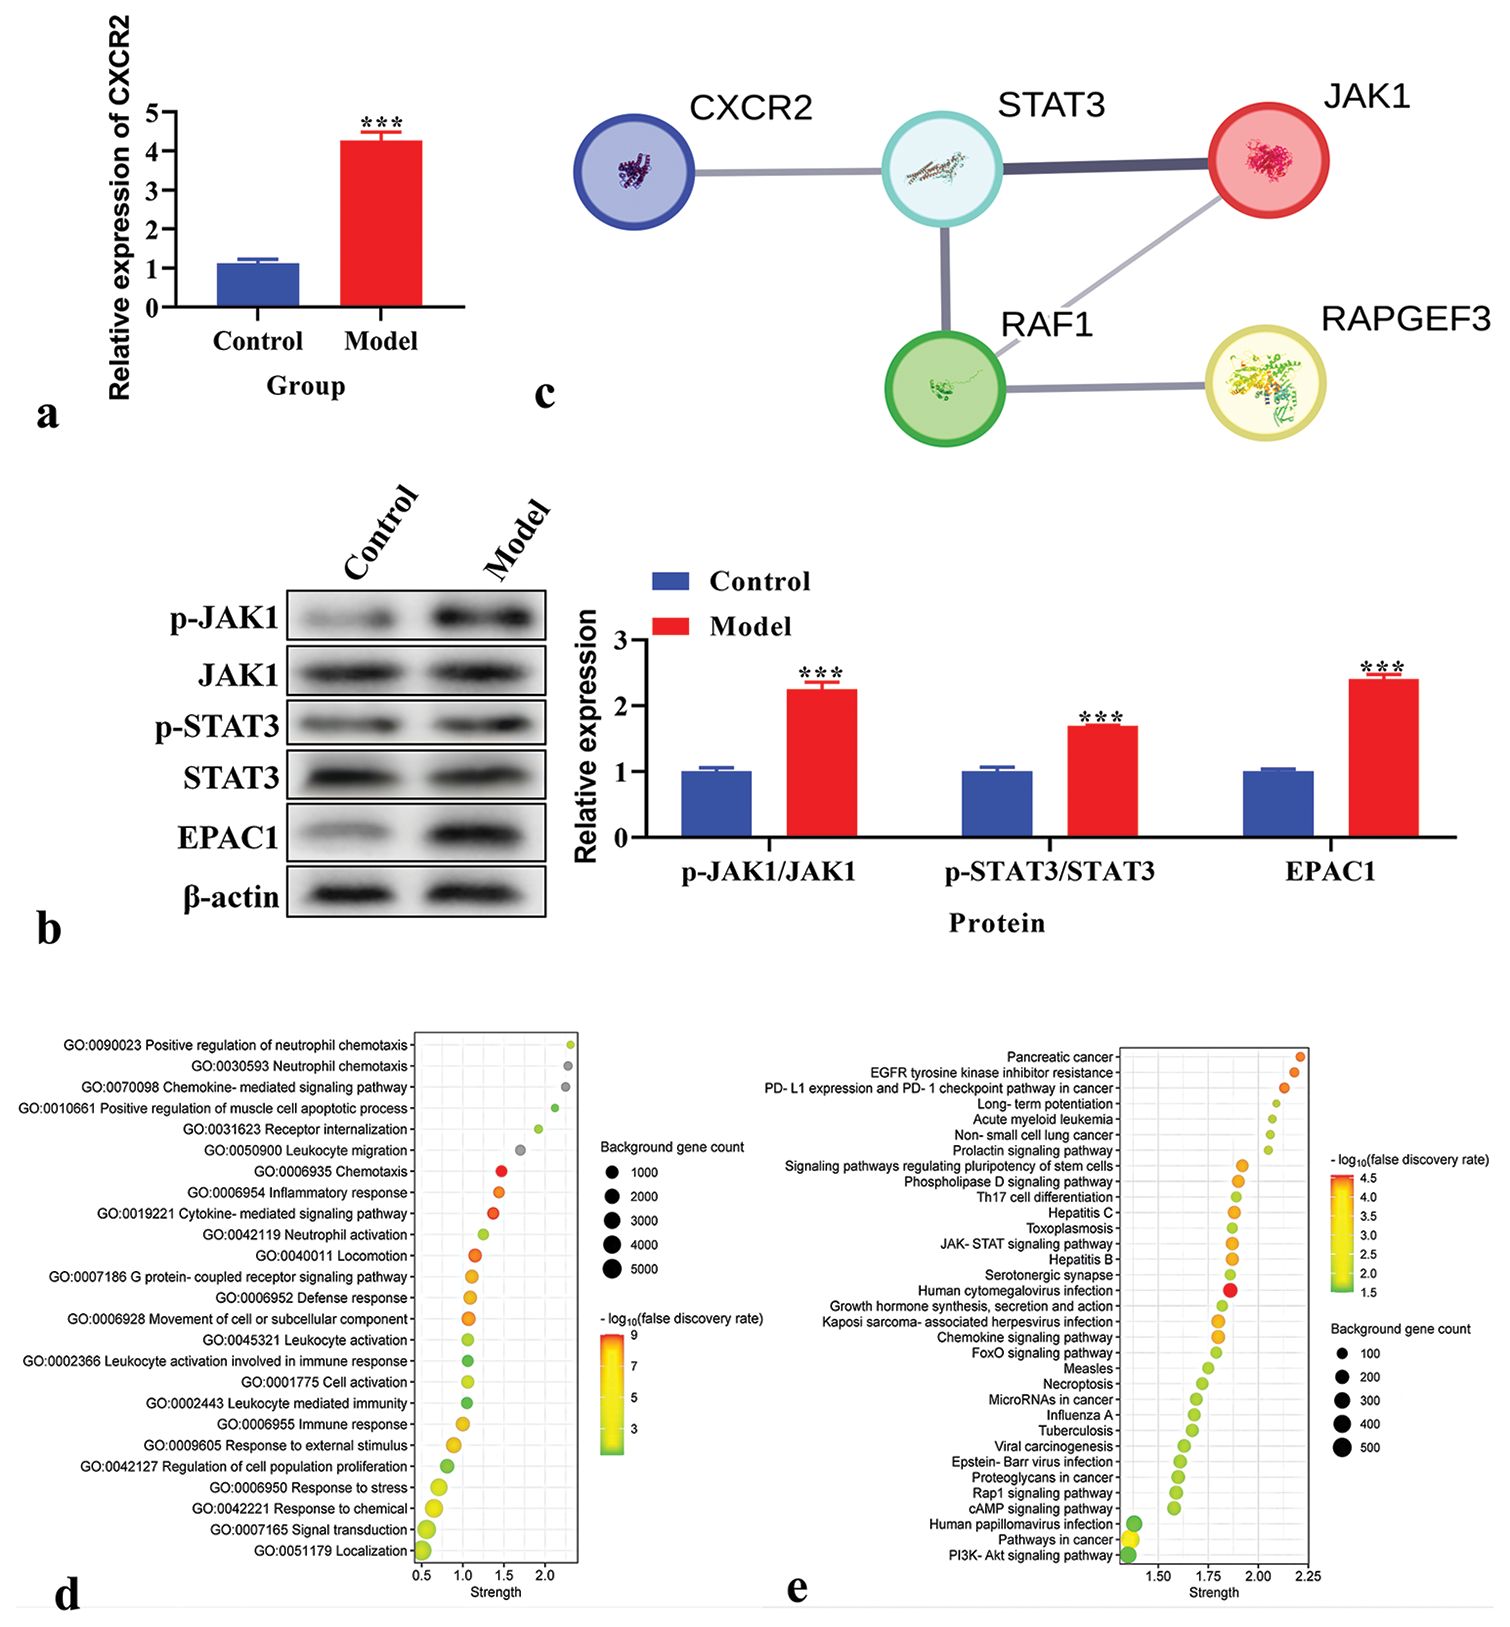
Expression and biological function of CXCR2 in the CPSP modelThe CXCR2 levels in the CPSP model were analyzed using real-time PCR and demonstrated that CXCR2 levels were increased in the CPSP model [P < 0.001, Figure 2a]. The protein levels of p-JAK1, JAK1, p-STAT3, STAT3, and EPAC1 were analyzed using western blot analysis. P-JAK1, p-STAT3, and EPAC1 were increased in the CPSP model [P < 0.001, Figure 2b]. TheSTRING database (https:// cn.string-db.org/) was used to analyze the PPI network of CXCR2. STAT3, JAK1, and RAPGEF3 were associated with CXCR2 expression [Figure 2c]. The biological function of CXCR2 was analyzed using GO analysis. We found that the GO functions of CXCR2 were mainly enriched in an inflammatory response and cytokine-mediated signaling pathways [Figure 2d]. KEGG pathway enrichment analysis was performed to explore CXCR2-related pathways. The JAK-STAT signaling pathway was the key enriched pathway related to CXCR2 [Figure 2e].
Export to PPT
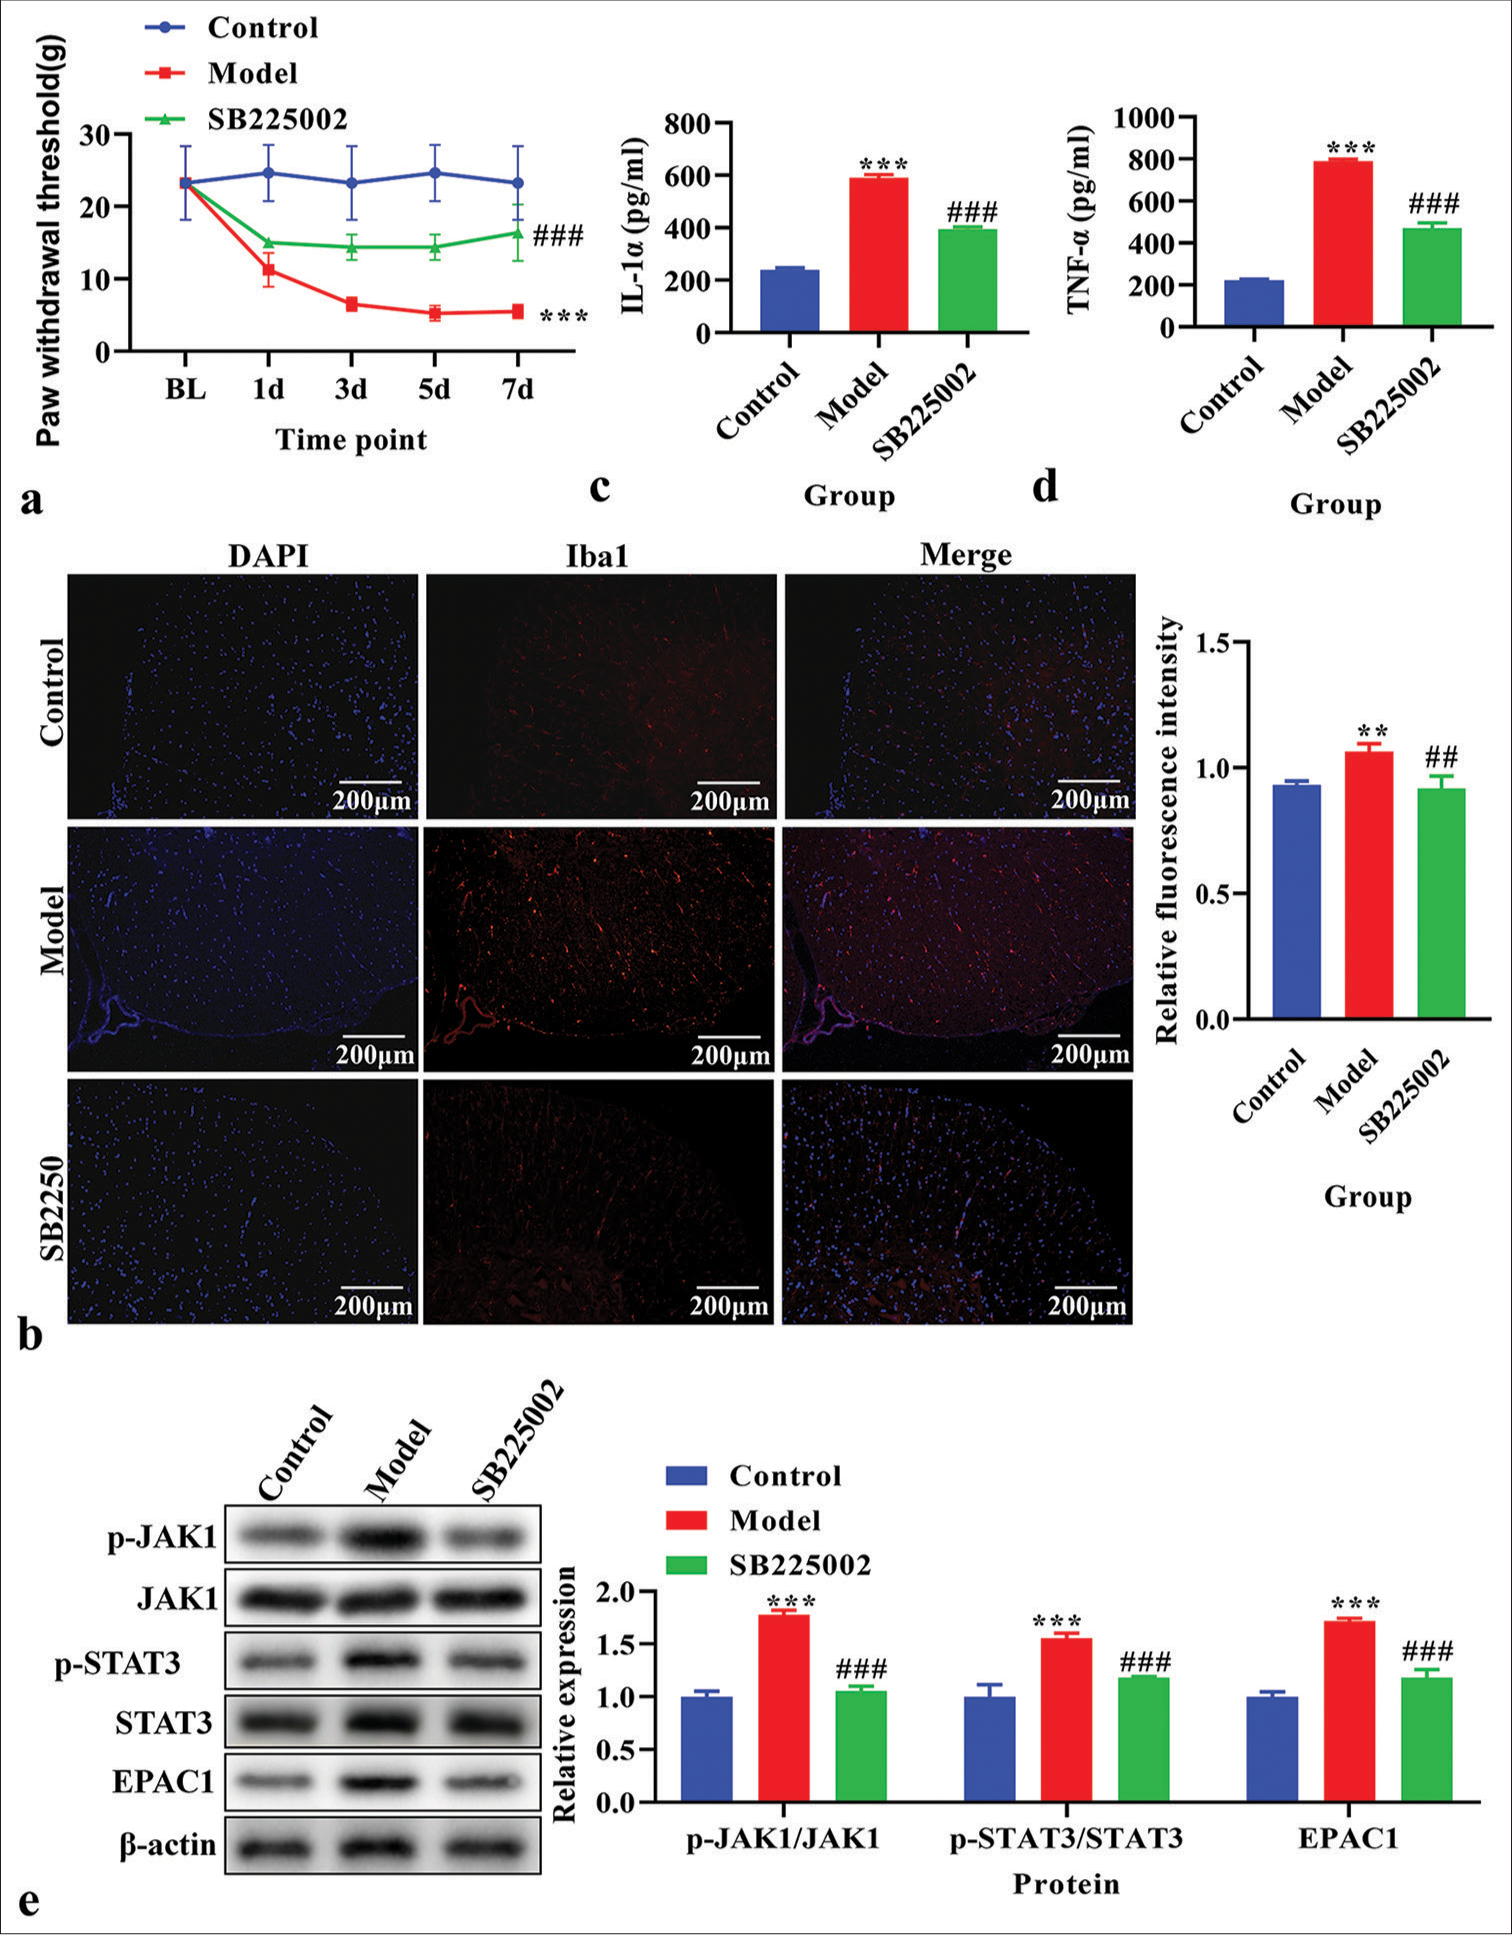
Effects of CXCR2 inhibition on PWT; Iba1, IL-1α, and TNF-α levels; and the JAK1/STAT3 signaling pathway in CPSP modelCPSP rats were treated with SB225002. PWTs in the treated and control groups were measured. The PWT was significantly decreased in CPSP rats (P < 0.05); however, this was reversed by SB225002 [P < 0.05, Figure 3a]. The expression of Iba1 was analyzed using immunofluorescence and was found to be increased in CPSP rats but decreased after treatment with SB225002 [Figure 3b]. IL-1α and TNF-α levels were measured using ELISA in spinal dorsal horn tissue. CPSP rats showed higher levels of IL-1α and TNF-α than these elevated levels [P < 0.001, Figure 3c and d]. The p-JAK1, JAK1, p-STAT3, STAT3, and EPAC1 levels were analyzed using western blot analysis. CPSP rats exhibited increased levels of p-JAK1, p-STAT3, and EPAC1 (P < 0.001), which were reversed by SB225002 treatment [P < 0.001; Figure 3e].
Export to PPT
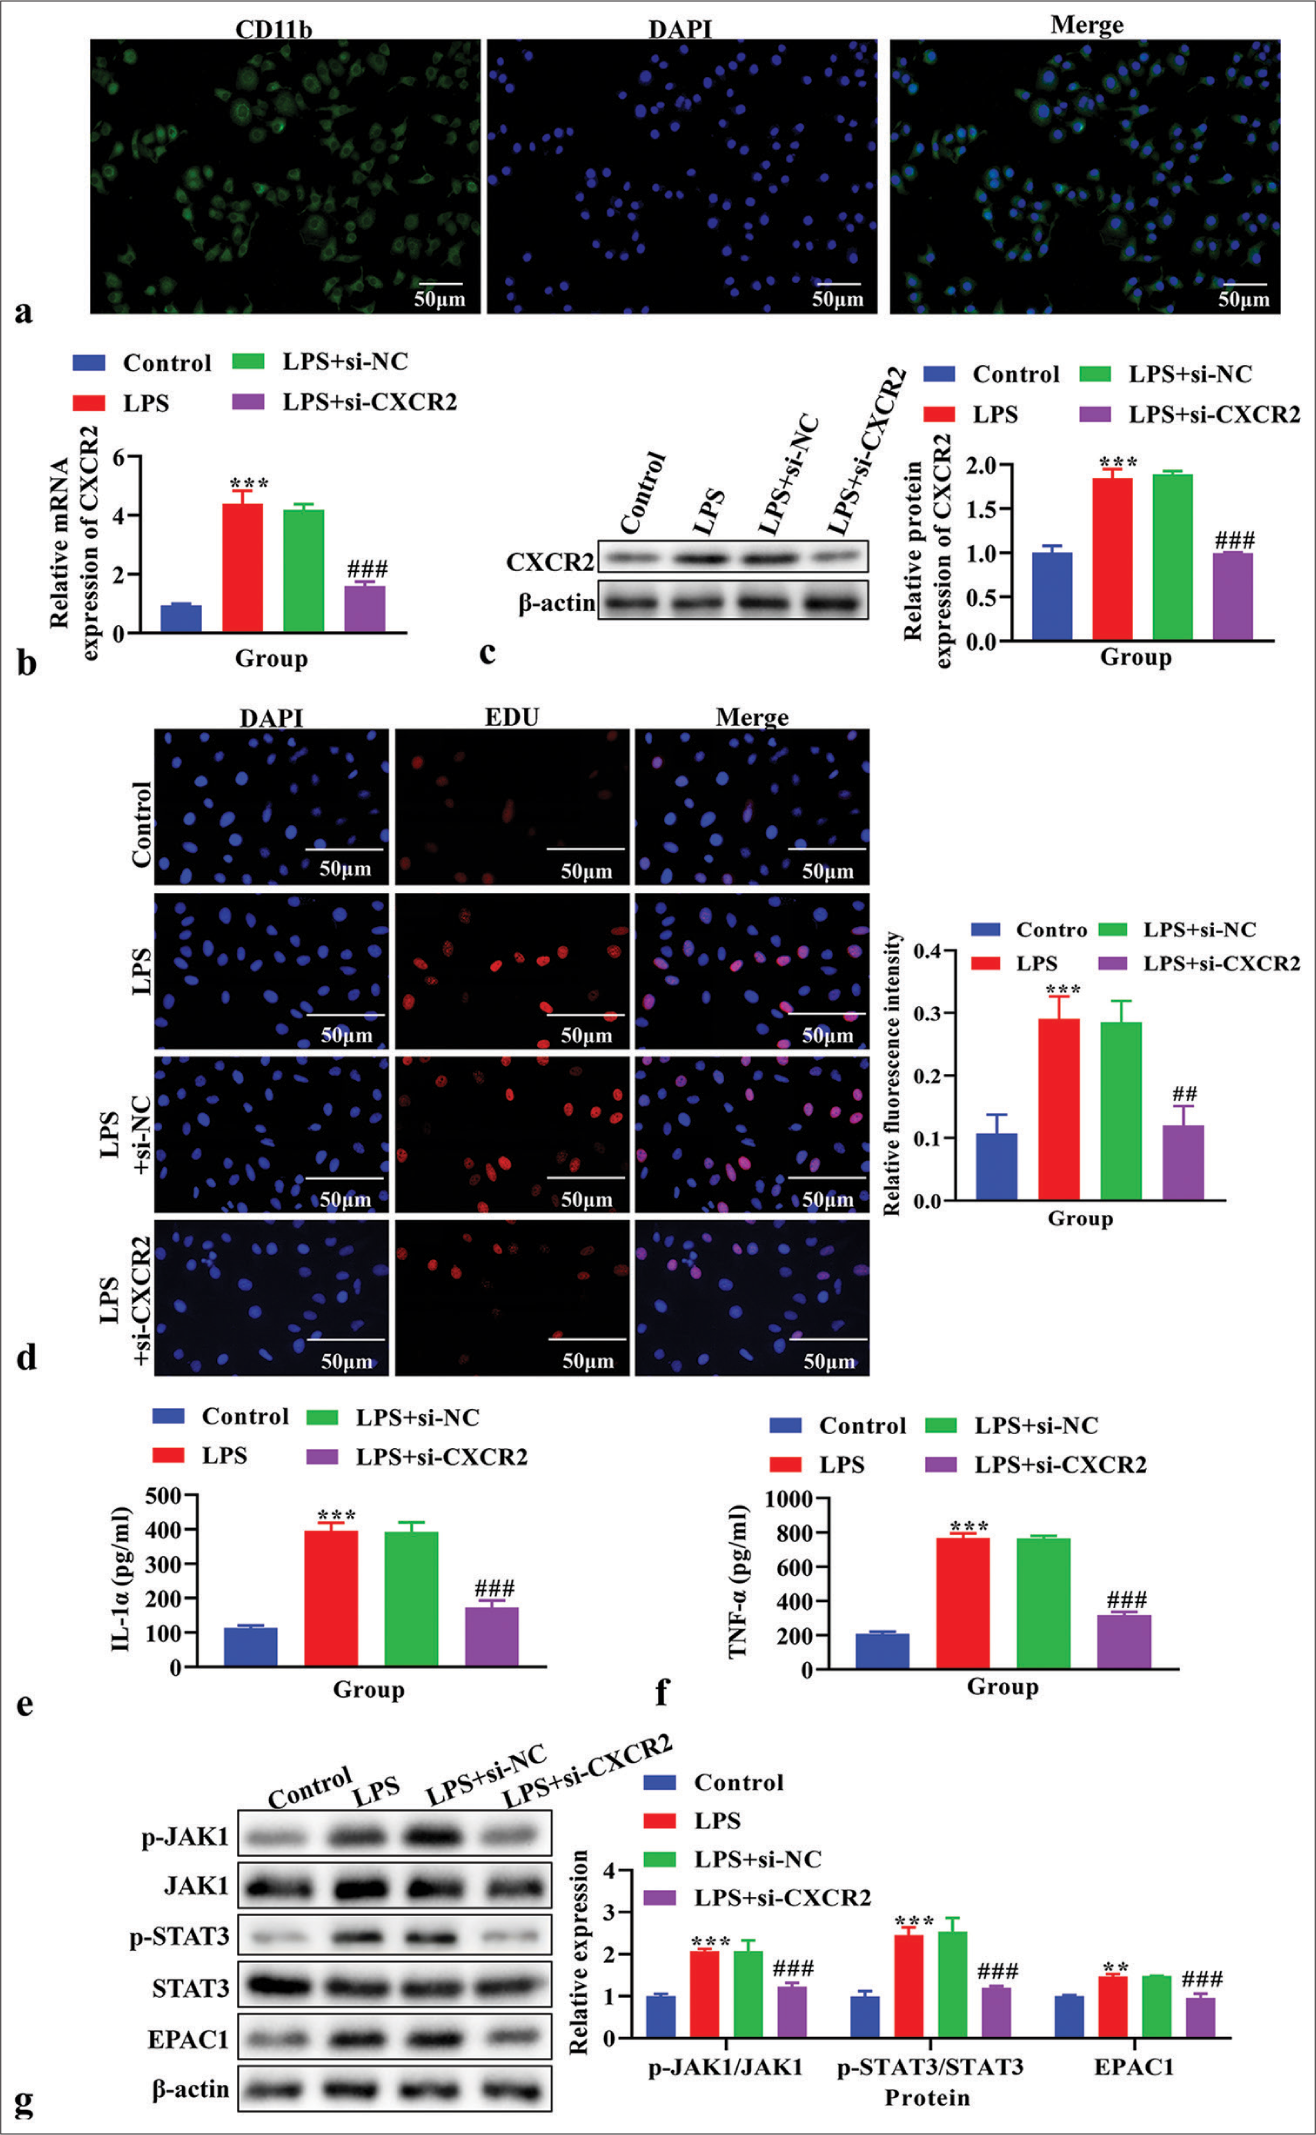
Effects of CXCR2 knockdown on cell proliferation, IL-1α and TNF-α levels, and the JAK1/STAT3 signaling pathway in LPS-induced primary microglia cellsBefore in vitro experiments, the purity of primary microglia was identified by immunofluorescence using the specific marker CD11b, and the purity of primary cultured microglia was found to be higher than 90% [Figure 4a]. CXCR2 levels were analyzed using real-time PCR to verify the CXCR2 knockout efficiency. The knockdown efficiency of si-CXCR2-002 was the highest [P < 0.001, Figure S1a]. The mRNA level of CXCR2 was increased in LPS-induced primary microglial cells (P < 0.001), but decreased after transfection with si-CXCR2 [P < 0.001, Figure 4b]. The protein level of CXCR2, as analyzed using western blot analysis, was also increased (P < 0.001), which was reversed by si-CXCR2 [P < 0.001, Figure 4c]. Cell proliferation, assessed using the EdU assay, increased in the LPS and LPS+si-NC groups but was reversed by si-CXCR2 [Figure 4d]. The level of IL-1α and TNF-α in the cell supernatant, measured using ELISA, was higher in the LPS group compared to the control group (P < 0.001) but reversed by si-CXCR2 [P < 0.001, Figure 4e and f]. The levels of p-JAK1, JAK1, p-STAT3, STAT3, and EPAC1, as analyzed using western blot analysis, were increased in LPS- induced primary microglial cells (P < 0.05) but were reversed by si-CXCR2 [P < 0.001, Figure 4g].
Export to PPT
Effects of IL-6 on cell proliferation, IL-1α and TNF-α levels, and the JAK1/STAT3 signaling pathway in LPS-induced primary microglia cells transfected with si-CXCR2The p-JAK1, JAK1, p-STAT3, STAT3, and EPAC1 levels were analyzed using western blot analysis. The levels of p-JAK1, p-STAT3, and EPAC1 were lower in the LPS+si-CXCR2 group compared to the LPS+si-NC group (P < 0.001), and these levels were reversed by IL-6 treatment [P < 0.001, Figure 5a]. Cell proliferation, as assessed using EdU assay, was decreased in the LPS+si-NC group (P < 0.001), and these levels were reversed by IL-6 treatment [P < 0.001, Figure 5b]. The concentrations of IL-1α and TNF-α in cell supernatant were detected by ELISA assay. The results showed that IL-1α and TNF-α were significantly reduced in the LPS+si-CXCR2 group compared to the LPS+si-NC group, and these effects were reversed by IL-6 [P < 0.001, Figure 5c and d].
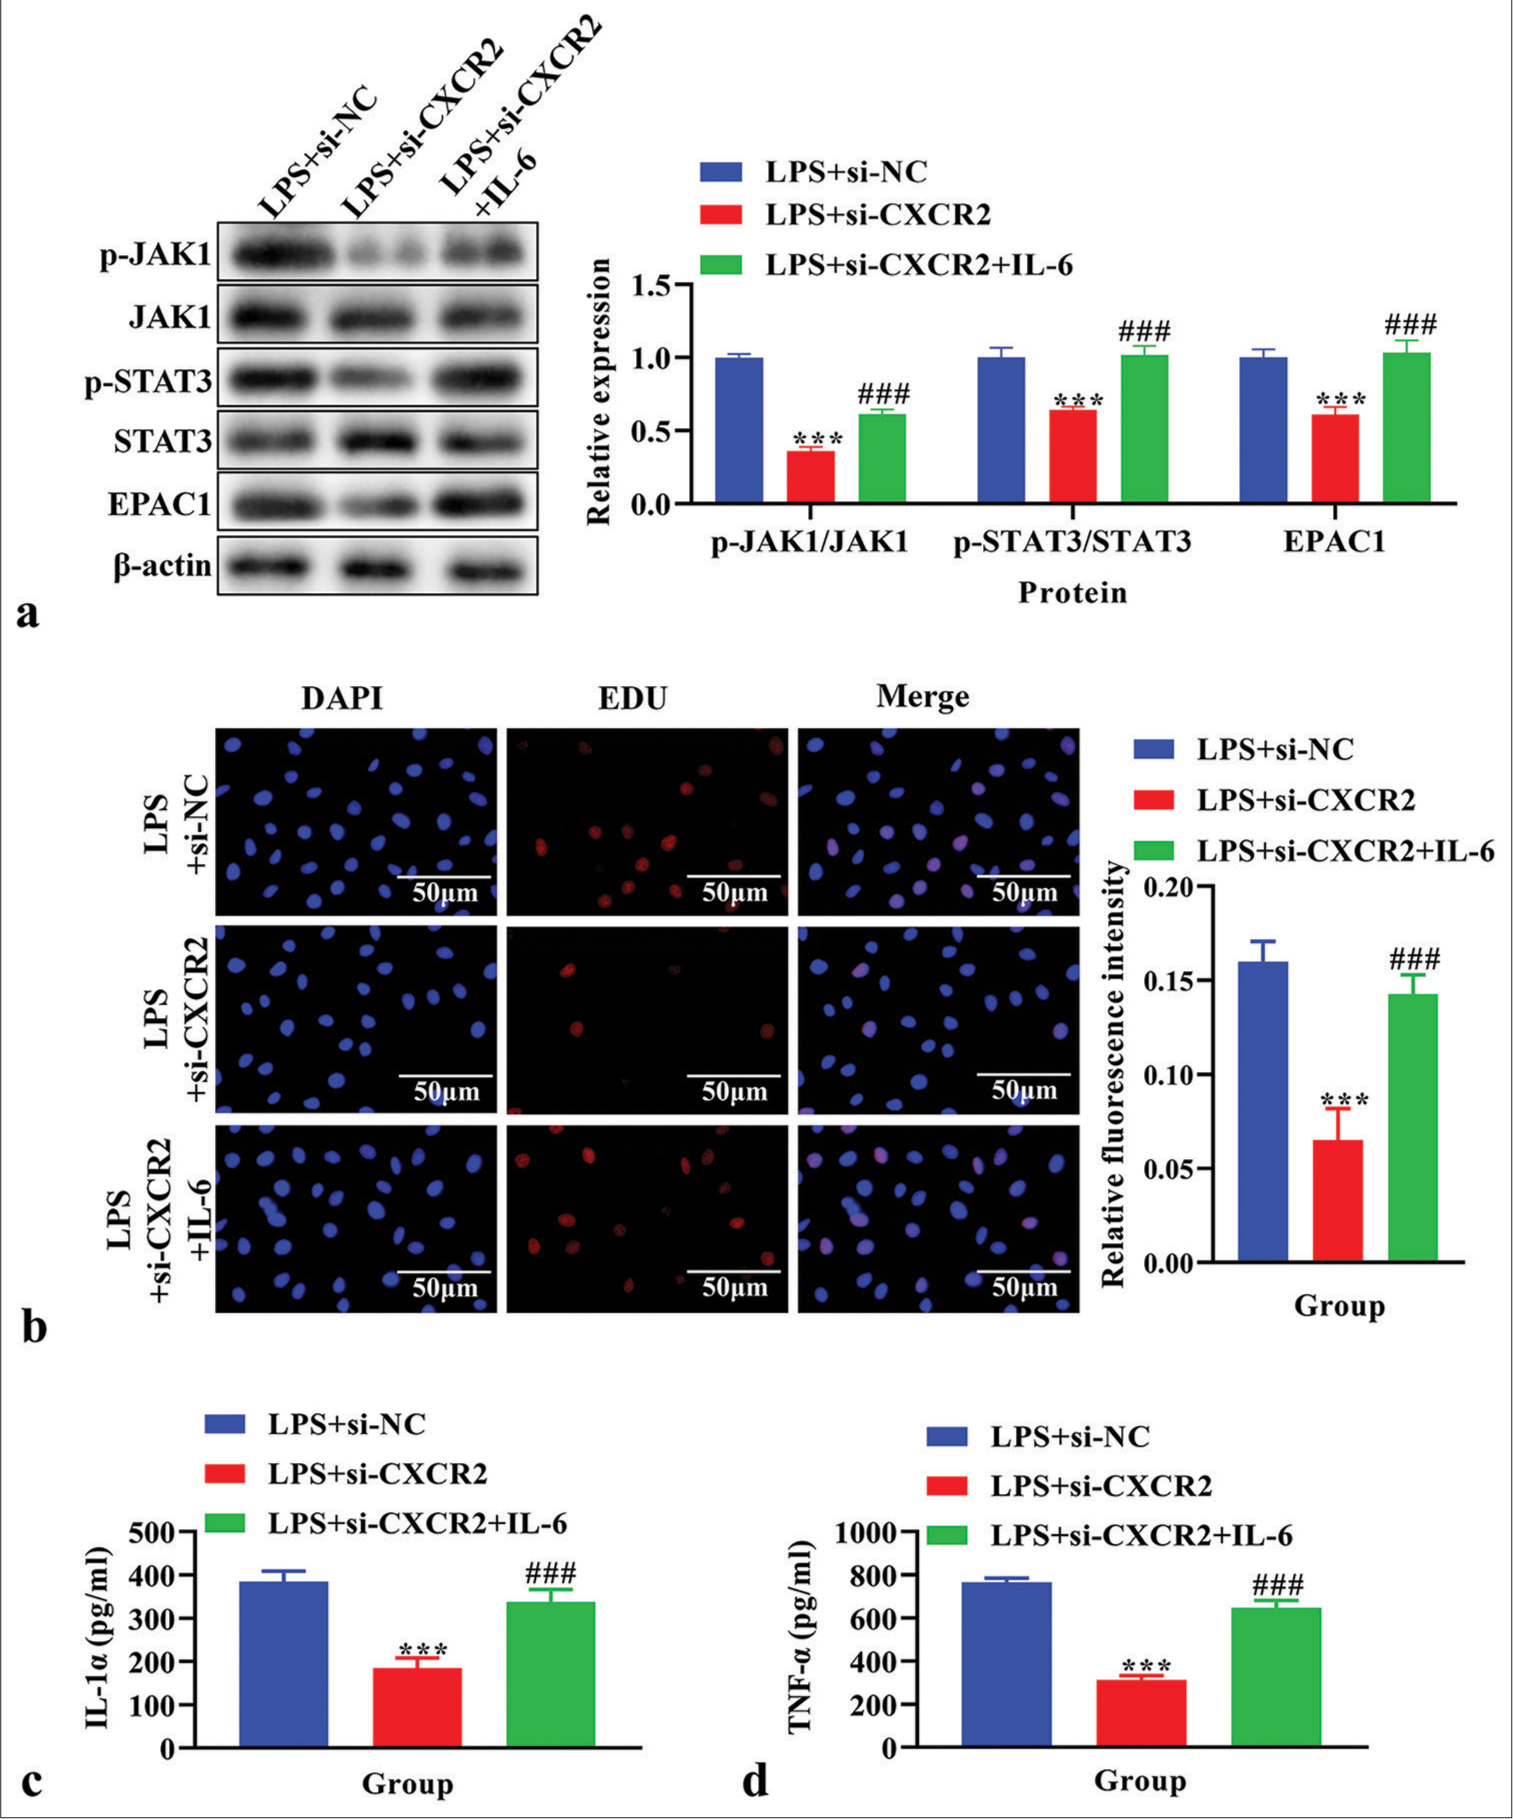
Export to PPT
Effects of EPAC1 knockdown on cell proliferation and levels of IL-1α and TNF-α in LPS-induced primary microglia cells treated with si-CXCR2 and IL-6EPAC1 expression was analyzed using real-time PCR to confirm the EPAC1 knockout efficiency. The knockdown efficiency of si-EPAC1-001 was the highest [P < 0.001, Figure S1b]. The results showed that the expression of EPAC1 was significantly reduced in the si-EPAC1 group compared with the si-NC group [P < 0.001, Figure 6a]. Western blot analysis confirmed a decrease in EPAC1 levels following treatment with si-EPAC1 compared to those in the LPS+si- CXCR2+IL-6 group [Figure 6b]. As assessed using EdU assay, cell proliferation showed that si-EPAC1 reversed the increased cell proliferation observed in the LPS+si- CXCR2+IL-6 group [Figure 6c]. The concentration of IL-1α and TNF-α in the cell supernatant, measured using ELISA, was lower in the LPS+si-CXCR2+IL-6+si-EPAC1 group compared to the LPS+si-CXCR2+IL-6 group [P < 0.001, Figure 6d and e].
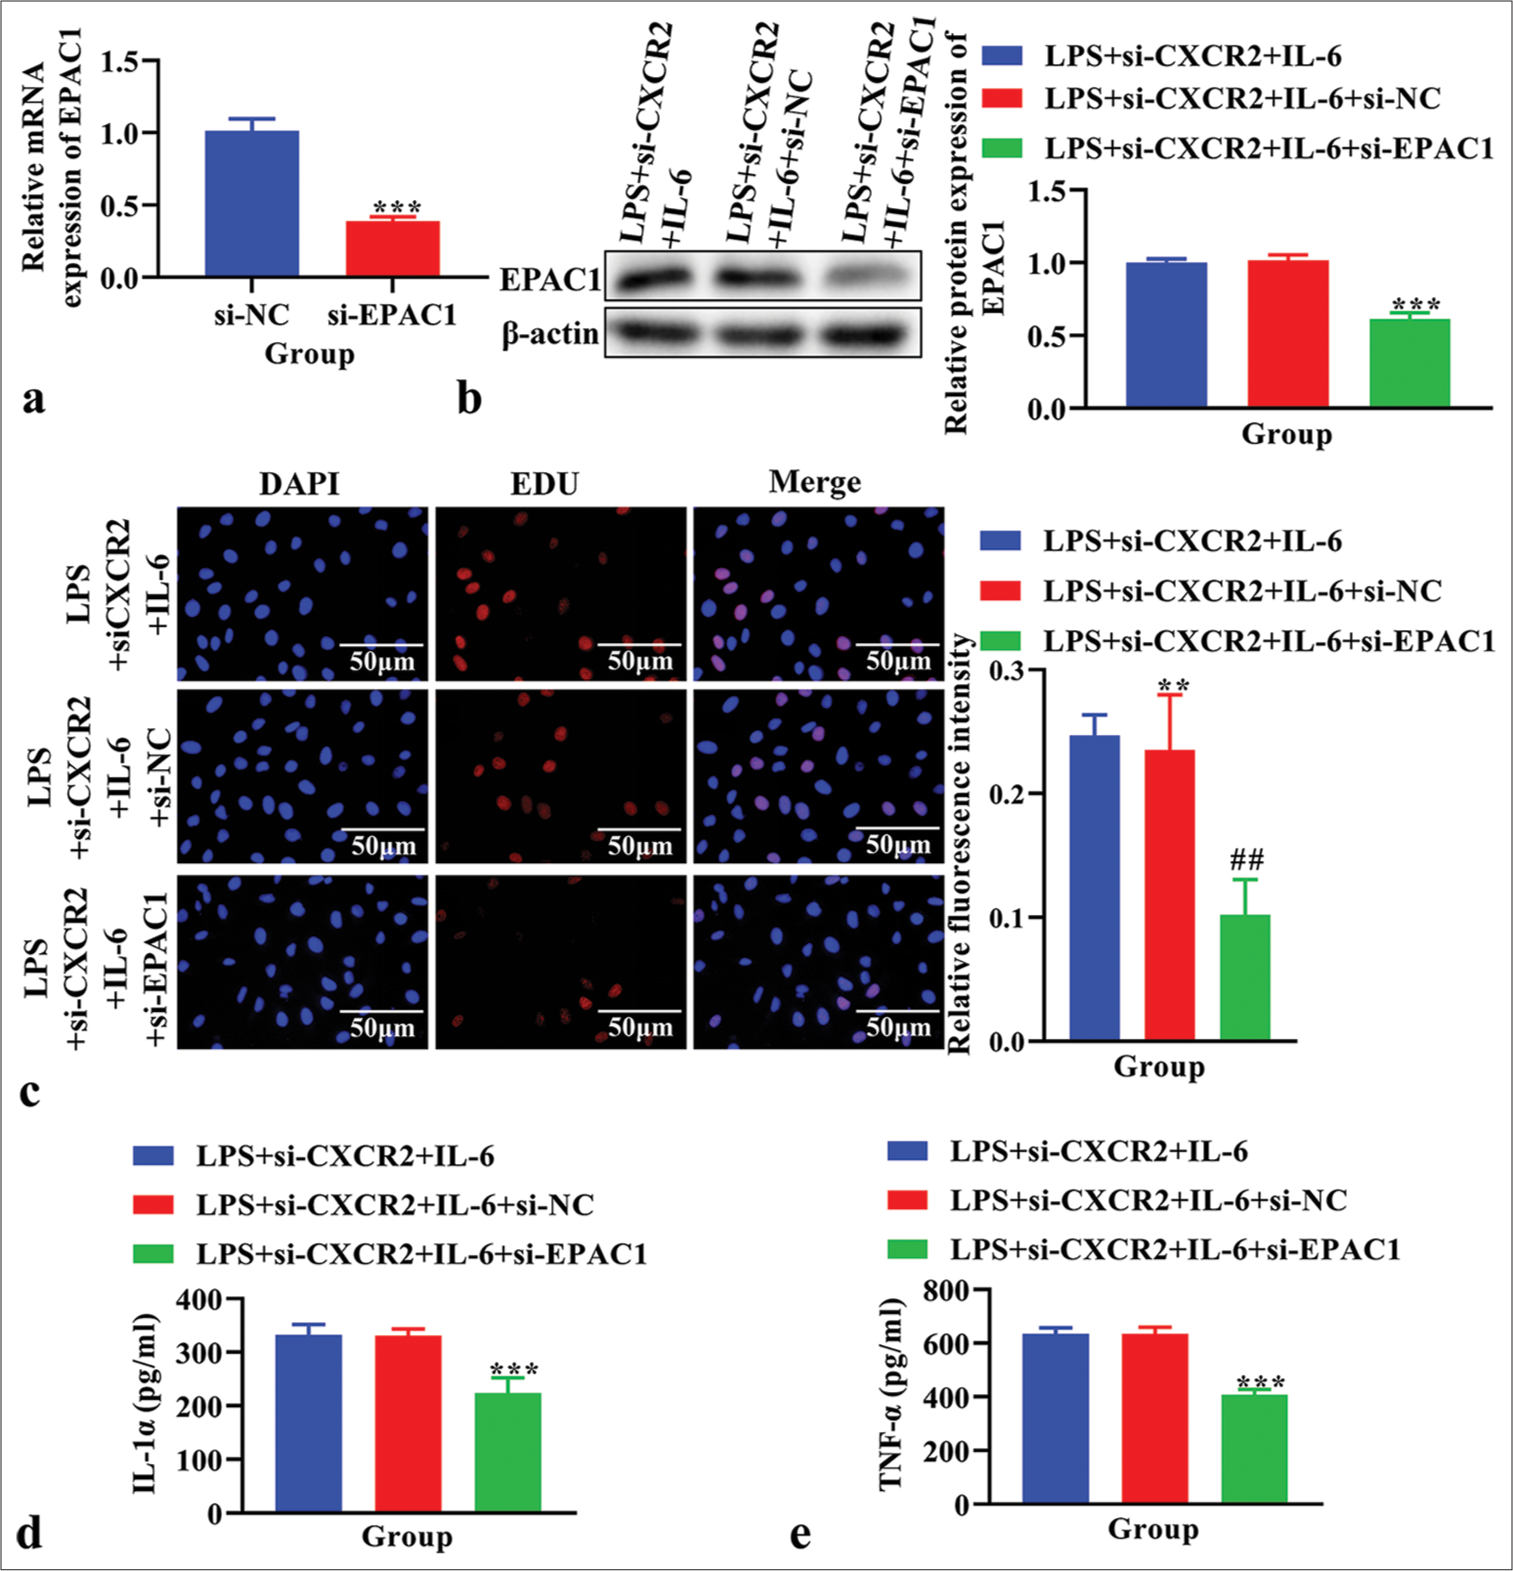
Export to PPT
DISCUSSIONCPSP refers to persistent pain lasting for more than 2 months that occurs after a surgical procedure[24] which is a global concern that affects patients worldwide.
In this study, we used a rat CPSP model to conduct in vivo experiments, as it was reported that an SMIR model was usually the CPSP model.[25] SMIR surgery resulted in a significant reduction in the ipsilateral PWT by 50% in the CPSP model,[26] and we found that the PWT was decreased in CPSP rats, consistent with the previous literature findings.[26] In addition, our study revealed increased levels of Iba1 and content of IL-1α and TNF-α in the CPSP model, consistent with previous studies’ findings.[8,27] These results confirmed the successful establishment of the CPSP rat model, while a more comprehensive model representation is needed to make the conclusions of this paper more convincing.
CXCR2 expression is increased in CPSP rats, and CXCR2 inhibitor SB225002 can reverse the decrease of PWT and the increase of IL-1α and TNF- α levels in CPSP model rats, suggesting that CXCR2 is involved in the occurrence and development of CPSP. In addition, we performed GO and KEGG pathway enrichment analyses, which are typically used to analyze the key metabolic pathways or functions of differentially expressed genes,[28] to explore the key functions and pathways associated with CXCR2 and the STRING database to identify the PPI network of CXCR2, finding that the inflammatory response and the JAKSTAT signaling pathway were key functions and pathways related to CXCR2 and the key genes (STAT3, JAK1, and rap guanine exchange factor (RAPGEF)3 [EPAC1]) were closely related to CXCR2 expression. We also found that p-JAK1, p-STAT3, and EPAC1 levels were increased in the CPSP model but were reversed by SB225002, confirming that CXCR2 may activate the JAK-STAT signaling pathway in the CPSP model.
To determine the role of CXCR2 in CPSP pathogenesis, an in vitro study was conducted using LPS-induced primary microglial cells, which are common in vitro models for studying CPSP[29] and found the level of CXCR2, IL-1α, TNF-α, and the expression of JAK-STAT signaling pathway- related genes (STAT3, JAK1, and EPAC1) were all increased, while reversed by CXCR2 knockdown, which was consistent with the findings in vivo. Moreover, after adding IL-6, an activator of the JAK-STAT signaling pathway,[30] the down- regulation of the JAK-STAT signaling pathway induced by si-CXCR2 was reversed, and the changes in IL-1α and TNF-α levels were also reversed. However, si-EPAC1 reversed the above changes induced by IL-6, indicating that the downregulation of EPAC1 may promote the recovery of CPSP. Further, in vivo experiments are needed to verify that inhibition of CXCR2 may alleviate CPSP by reducing primary microglia proliferation, immune response, and regulating the JAK-STAT signaling pathway.
In addition, si-CXCR2 increases STAT3 while decreasing p-STAT3 may adjust the activity of STAT3 and its phosphorylation state in response to the negative feedback mechanism of anti-inflammatory signaling to avoid excessive or inappropriate inflammatory response and, thus, maintain or restore normal physiological function of cells. These results suggest that si-CXCR2 may play an anti-inflammatory role by increasing the expression of STAT3 in the non-phosphorylated state and inhibiting the phosphorylation of STAT3. In contrast, some studies have shown that siCXCR2 eliminated the inhibition of STAT3 phosphorylation and inflammation by Jiawei Xiaochengqi decoction,[31] indicating that CXCR2 may have variable regulation modes. Further, quantitative statistics on the specific behavior of animal models after administration of CXCR2 inhibitors are needed to complement the features of CXCR2 in the CPSP model.
Recent studies have shown that CXCR2 regulates multiple signaling pathways, including Ras/ERK, PI3K/Akt, JAK2/ STAT3, PLC/PKC, and mitogen-activated protein kinase (MAPK)/p38, each leading to distinct biological effects.[32] Among these, inhibiting the rat sarcoma viral oncogene homolog (RAS)/extracellular signal-regulated kinase (ERK) pathway triggers NFκB-dependent upregulation of CXCR2 ligands, which, in turn, suppresses T-cells.[33] The activation of CXCL1 stimulates CXCR2 in microglia to regulate the MAPK/p38 pathway involved in neuropathic pain.[34] In addition, CXCR2 activation promotes the expression of COX-2 through p-ERK, which regulates the peripheral nerve injury nociceptors.[35] In our study, we showed that CXCR2 aggravated CPSP by activating microglia through the JAK1/STAT3 signaling pathway, further confirming the key role of CXCR2 in neuropathic pain. Our findings supplement existing knowledge on related pathways and mechanisms, providing a new theoretical basis for whether CPSP is associated with neuropathic pain. However, we need to further explore the specific role and mechanism of the CXCL1/CXCR2 axis in CPSP[36] and investigate the etiology and treatment of CPSP.
SUMMARYThis study showed that the downregulation of CXCR2 expression can decrease the levels of EPAC1 to suppress cell proliferation and immune response, thereby alleviating CPSP by inhibiting the JAK1/STAT3 signaling pathway. In the future, we will further validate the efficacy and safety of CXCR2 in alleviating CPSP using other experimental methods.
Our findings provide new targets for alleviating CPSP, specifically CXCR2, offering insights for developing new synergistic treatments based on their mechanisms of action. In addition, significant differences observed in the relevant indicators highlighted in the research findings could aid in diagnosing CPSP.
AVAILABILITY OF DATA AND MATERIALSThe datasets used and/or analyzed during the current study are available from the corresponding author on reasonable request.
ABBREVIATIONSCPSP - Chronic post-surgical pain
CXCR2-C-X-C - Motif chemokine receptor 2
NC - Negative Control
IL - Interleukin JAK - Janus Kinase
STAT - Signal Transducers and Activators of Transcription
EPAC1 - Exchange Protein 1 directly Activated by cAMP
LPS - Lipopolysaccharide
GEFs - Guanine nucleotide exchange protein conversion factor
SD - Sprague-Dawley
SMIR - Skin/muscle incision and retraction
CPCSEA - Committee for the Purpose of Control and Supervision of Experiments on Animals
PBS - Phosphate buffered saline BSA - Bovine serum albumin
DAPI-4’, 6 - Diamidino-2-phenylindole
DMEM - Dulbecco’s Modified Eagle Medium
TNF-α - Tumor necrosis factor-α
ELISA - Enzyme-linked immunosorbent assay
EdU - Ethynyl-2 ‘-deoxyuridine
GO - Gene ontology
KEGG - Kyoto encyclopedia of genes and genomes database
PPI - Protein-protein interaction
RAPGEF3 - Rap Guanine Nucleotide Exchange Factor 3
PCR - Polymerase chain reaction
RIPA - Radio immunoprecipitation assay
PVDF - Polyvinylidene difluoride
SPSS - Statistical Package for the Social Sciences
LSD - Least Significant Difference tests
MAPK - Mitogen-activated protein kinase
RAS - Rat sarcoma viral oncogene homolog
ERK - Extracellular signal-regulated kinase
Comments (0)