
Remember me
Primary liver cancer (PLC) is a common human cancer, ranks sixth in cancer morbidity, and is the third leading cause of cancer-related deaths worldwide.[1] Hepatocellular carcinoma (HCC) is the primary type of PLC, accounting for approximately 90% of all PLC cases.[2] In the past decade, the diagnosis and treatment of HCC have remarkably improved, but due to clinically atypical symptoms, most patients are already in the middle or advanced stages of HCC when they are diagnosed.[3] In addition, the 5-year overall survival rate of patients with HCC is <30% due to the rapid progression and high incidence of tumor recurrence.[4] Therefore, constant efforts are required to elucidate the molecular mechanisms underlying the pathogenesis of HCC and identify novel diagnostic and therapeutic targets to improve its prognosis.
Non-coding RNAs (ncRNAs) comprise 98% of the transcripts of the human genome, receiving considerable interest due to their complex physiological and pathological functions.[5-7] Long ncRNAs (lncRNAs) are >200 nucleotide-long ncRNA transcripts that have no or limited protein-coding capabilities.[8] lncRNAs regulate cancer by mediating RNA–RNA, RNA–protein, or protein–protein interactions; chromatin modification; and protein modification and by sponging microRNAs (miRNAs).[5,9] To date, hundreds of lncRNAs have been found to act as tumor drivers or suppressors in various types of cancer, influencing diverse cellular malignant processes, such as cell proliferation, apoptosis, cell mitosis, migration, invasion, and drug resistance.[5,7,10-12] Hox Transcript Antisense Intergenic RNA, a well-characterized lncRNA that acts as a scaffold for histone modification complexes, is overexpressed in a broad spectrum of tumors and associated with poor prognosis and metastasis.[13] Testis Associated Oncogenic LncRNA (THOR) is a novel oncogenic lncRNA that contributes to mRNA stabilization by interacting with IGF2BP1.[14] The ectopic expression of THOR accelerates the onset of melanoma, whereas knockout of THOR in zebrafish confers resistance to melanoma onset.[15] However, current knowledge of lncRNAs involved in cancer remains limited. Here, we identified an oncogene lncRNA in HCC and named it ST8SIA6 antisense RNA 1 (ST8SIA6-AS1). Indeed, ST8SIA6-AS1 acts as a tumor driver gene that promotes the progression and metastasis of HCC.[16-21] Then, we revealed the oncogenic downstream molecular mechanism and demonstrated the crucial role of lncRNA ST8SIA6-AS1 in the occurrence and progression of HCC. Feng et al. showed that ST8SIA6-AS1 inhibits HMGA1 expression by sponging miR-142-3p, wihich accelerated LIHC cell growth while preventing cell apoptosis.[22] Another study suggested that ST8SIA6-AS1 promotes the proliferation of HCC by sponging miR-4656 and elevation of HDAC11 expression.[16] Several other studies have elaborated the other downstream regulatory and effector molecules contributing to ST8SIA6-AS1’s cancer-promoting effects, such as miR-129e5p, miR-5195-3p, and miR-338, which regulate the expression of effector molecules MAGEA3 and DCAF4L2, HOXB6, and MEPCE, respectively.[17-19] The role of ST8SIA6-AS1 in the oncological context has been extensively explored, but the precise mechanisms governing its upregulation in HCC have not been thoroughly examined. In this study, different from previous studies, we used a CRISPR-Cas9-based technology to efficiently knock down and overexpress ST8SIA6-AS1 and confirmed the promoting effect of ST8SIA6-AS1 on HCC. Importantly, we discovered that c-Myc upregulates ST8SIA6-AS1 expression by directly acting on the region near the transcription start site (TSS). This finding sheds light on the upregulation mechanism of ST8SIA6-AS1 in HCC and provides a theoretical basis for further research into its diagnostic and therapeutic potential.
MATERIAL AND METHODS Cell lines and cell cultureHepG2 (TCHu 72), Hep3B (SCSP-5045), MHCC-97H (SCSP-5092), HCCLM3 (SCSP-5093), and HEK-293T (SCSP-502) cell lines were purchased from the Cell Bank Type Culture Collection of the Chinese Academy of Sciences (Shanghai, China). L02 and SMMC-7721 were provided by Zhongshan Hospital, China. All cell lines were verified by Short Tandem Repeats and tested negative for mycoplasma. The cell lines were cultured in dulbecco’s modified eagle medium (DMEM) (L110KJ, Yuan Pei, Shanghai China) supplemented with 10% fetal bovine serum (A2890419CP, Gibco, New York, USA) in a humidified atmosphere containing 5% CO2 at 37°C.
Clinical tissue specimensHCC tissue specimens were obtained from patients undergoing surgical resection with a pathological diagnosis of HCC. Adjacent non-cancerous tissue specimens were collected from the same patients at least 1 cm away from the tumor margin. Patients with other malignancies or other systemic diseases were excluded from the study. The tumor tissues and their corresponding adjacent tissues were collected at the First Affiliated Hospital of Anhui Medical University. This study was approved by the Committee on Medical Ethics of the First Affiliated Hospital of Anhui Medical University and conforms to the Declaration of Helsinki.
Activation and repression of target genes using CRISPRThe genomic and promoter region sequences of human ST8SIA6-AS1 were obtained from the NCBI database (https://www.ncbi.nlm.nih.gov/gene/). Single-guide RNAs (sgRNAs) were designed in accordance with the recommendation of the Zhang Laboratory website (http://crispr.mit.edu). The sgRNAs were cloned into Lenti_gRNA-Puro (Addgene, MA, USA) in accordance with the manufacturer’s instructions.[23]
Production and infection of lentivirusFor Crispr-based ST8SIA6-AS1 overexpression, plasmids lenti dCAS9-VP64_Blast (#61425, Addgene, MA, USA), lenti MS2-P65-HSF1_Hygro (#61426, Addgene, MA, USA), and lenti sgRNA (MS2)_puro backbone (#7379, Addgene, MA, USA) with sgRNAs against the human ST8SIA6-AS1 promoter region were used. Lenti-dCas9-KRAB-blast (#89567, Addgene, MA, USA) and Lenti_gRNA-Puro (#84752, Addgene, MA, USA) with sgRNAs against the human ST8SIA6-AS1 promoter region were used to repress the expression of ST8SIA6-AS1.[24] All plasmids or plasmid backbones were obtained from Addgene.
For lentivirus production, lentiviral vectors expressing target fragments with the lentiviral packaging plasmid psPAX2 (#12260, Addgene, MA, USA) and envelope-expressing plasmid pMD2.G (#12259, Addgene, MA, USA) were simultaneously transfected into 293T cells with Lipofectamine 2000 (11668019, Thermo Fisher, MA, USA). The supernatant containing a lentivirus was harvested after 48 h of transfection. The target cell lines were infected with lentiviruses at a final polybrene concentration of 8 mg/mL for 24 h.
RNA extraction and quantitative real-time polymerase chain reaction (qRT-PCR) assayTotal RNA was extracted using Trizol reagent (15596018CN, Invitrogen, CA, USA), and complementary (cDNA) was synthesized using the HiScript III 1st Strand cDNA synthesis kit (R312, Vazyme, Nanjing, China). qRT-PCR was performed using ChamQ SYBR quantitative polymerase chain reaction (qPCR) Master Mix (Q331, Vazyme, Nanjing, China). The relative expression levels of lncRNAs were calculated using the comparative Ct (2−ΔΔCt), and glyceraldehyde-3-phosphate dehydrogenase was the endogenous control. All reactions were performed in accordance with the manufacturer’s instructions. All primer sequences are listed in Supplementary Table 1.
Cell cycle and apoptosis analysisFor cell cycle analysis, target cells were harvested, washed twice with phosphate buffered saline (PBS), and then treated with 70% alcohol at −20°C overnight. The cells were washed twice with PBS, and then, 200 mL of 100 mg/mL RNase I was added to the cells. The cells were incubated for 30 min at 37°C, stained with propidium iodide (PI; ST1569, Beyotime, Shanghai, China), and subjected to flow cytometry (BD LSRFortessa X-20). For apoptosis analysis, the cells were stained with annexin V and PI according to the manufacturer’s instructions (Thermo Fisher, MA, USA) and analyzed using flow cytometry for apoptosis monitoring, the analysis software is FlowJo 10 (BD, NJ, USA).
In vivo tumorigenicity assaysAll animal experiments were approved by the committee on medical ethics of The First Affiliated Hospital of Anhui Medical University and conducted in accordance with the China Animal Welfare Legislation. All mice were kept in an Specific pathogen Free environment and euthanized by cervical dislocation at the end of the study. Six-week-old male athymic BALB/c nude mice were obtained from the Shanghai Slac Laboratory Animal Co. HCCLM3 cells were harvested in serum-free DMEM and subcutaneously injected into the right flank of each mouse. Then, each mouse was injected with 1 × 10⁷ cells. The mice were euthanized at the time when tumors were 10 mm in diameter. For orthostatic liver tumor transplantation, tumors from first transplantation were dissected into approximately 2 × 2 × 2 mm in size and re-transplanted to the liver of nude mice. The tumor volumes were measured by Vernier caliper and calculated with a formula of long diameter × short diameter × short diameter × 0.5.
Statistical analysisGraphPad Prism 8.0 software (GraphPad-Prism Software Inc., San Diego, CA) was used for conducting statistical analyses and creating graphs. Experiments were performed in triplicate and repeated at least 2 times. The data were presented as mean ± standard deviation. Analysis of variance tests, t-tests, and Tukey tests were applied to different situations. P < 0.05 indicated statistical significance (*P < 0.05, **P < 0.01, and ***P < 0.001).
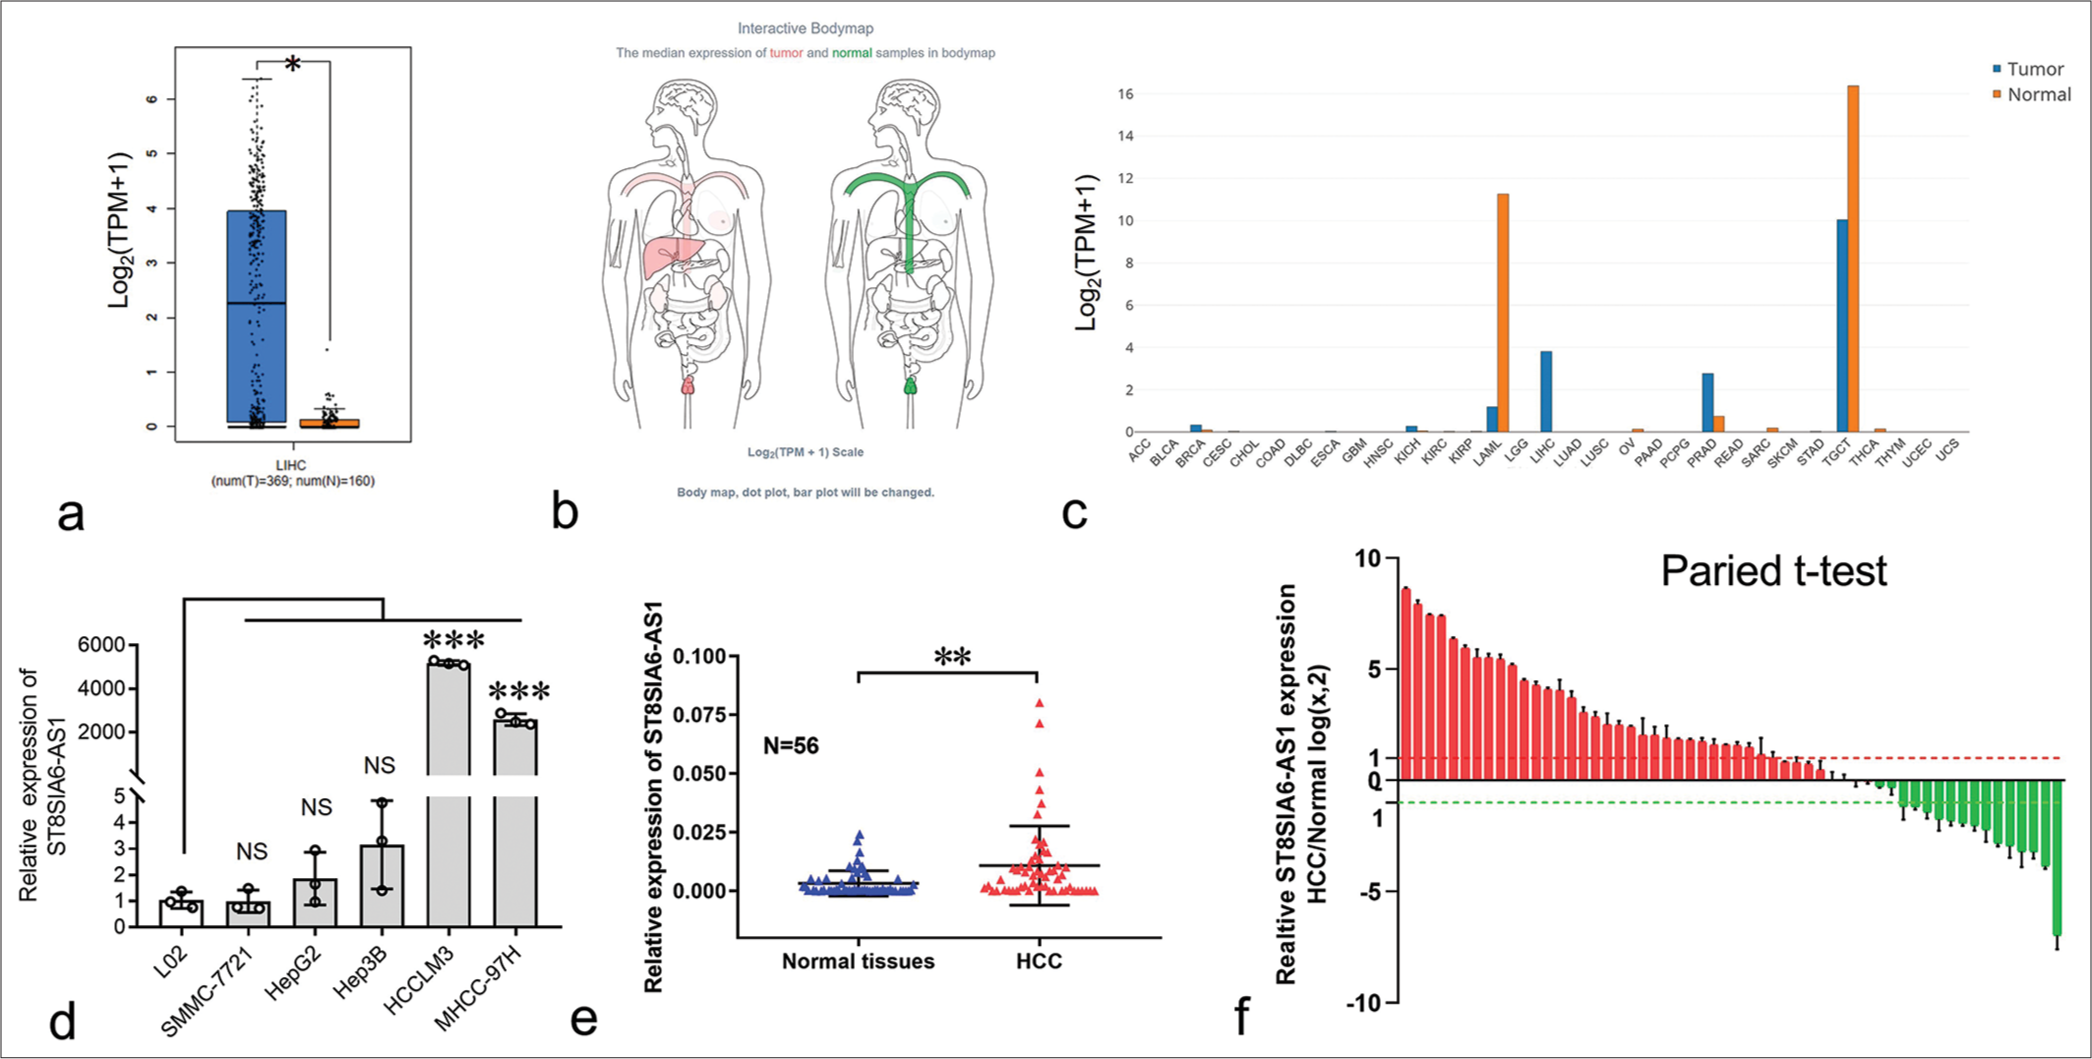
RESULTS ST8SIA6-AS1 was significantly upregulated in HCCTo explore the expression of ST8SIA6-AS1 in HCC, we first analyzed the data obtained from the public database gene expression profiling interactive analysis (GEPIA). ST8SIA6-AS1 expression was significantly upregulated in 369 liver cancer tissues and 160 paracarcinoma tissues (P < 0.05) [Figure 1a]. ST8SIA6-AS1 was limited in normal human tissues, only highly expressed in the testes, prostate, and nerves, and had low expression level in the liver (data were obtained from GEPIA) [Figures 1b, c and and Supplementary Figure 1a]. However, ST8SIA6-AS1 expression was almost specifically upregulated in HCC tissues, indicating that this lncRNA plays an important role in HCC.
Export to PPT
The expression of ST8SIA6-AS1 in the normal liver cell line L02 and several HCC cell lines was measured using qPCR. L02 had the lowest ST8SIA6-AS1 RNA expression among all the analyzed cell lines [Figure 1d]. In addition, the expression of ST8SIA6-AS1 was significantly upregulated in the MHCC-97H and HCCLM3 cells (P < 0.001) [Figure 1d]. Furthermore, we used qPCR to analyze the expression of ST8SIA6-AS1 in 56 in-house pairs of liver cancer and paracarcinoma tissues. Consistent with the results from the public databases, the qPCR results showed that ST8SIA6-AS1 expression was significantly higher in the liver cancer tissues than in the paracarcinoma tissue (P = 0.0018) [Figure 1e]. Pairwise analysis results showed that ST8SIA6-AS1 expression was increased (log2FC > 1), significantly downregulated (log2FC < −1), and unchanged (−1 < log2FC < 1) in 32, 14, and 10 of the 56 pairs of tissues, respectively [Figure 1f]. This result indicated that ST8SIA6-AS1 expression was considerably upregulated in the liver tissues after carcinogenesis. Overall, ST8SIA6-AS1 expression was considerably upregulated in the HCC cells.
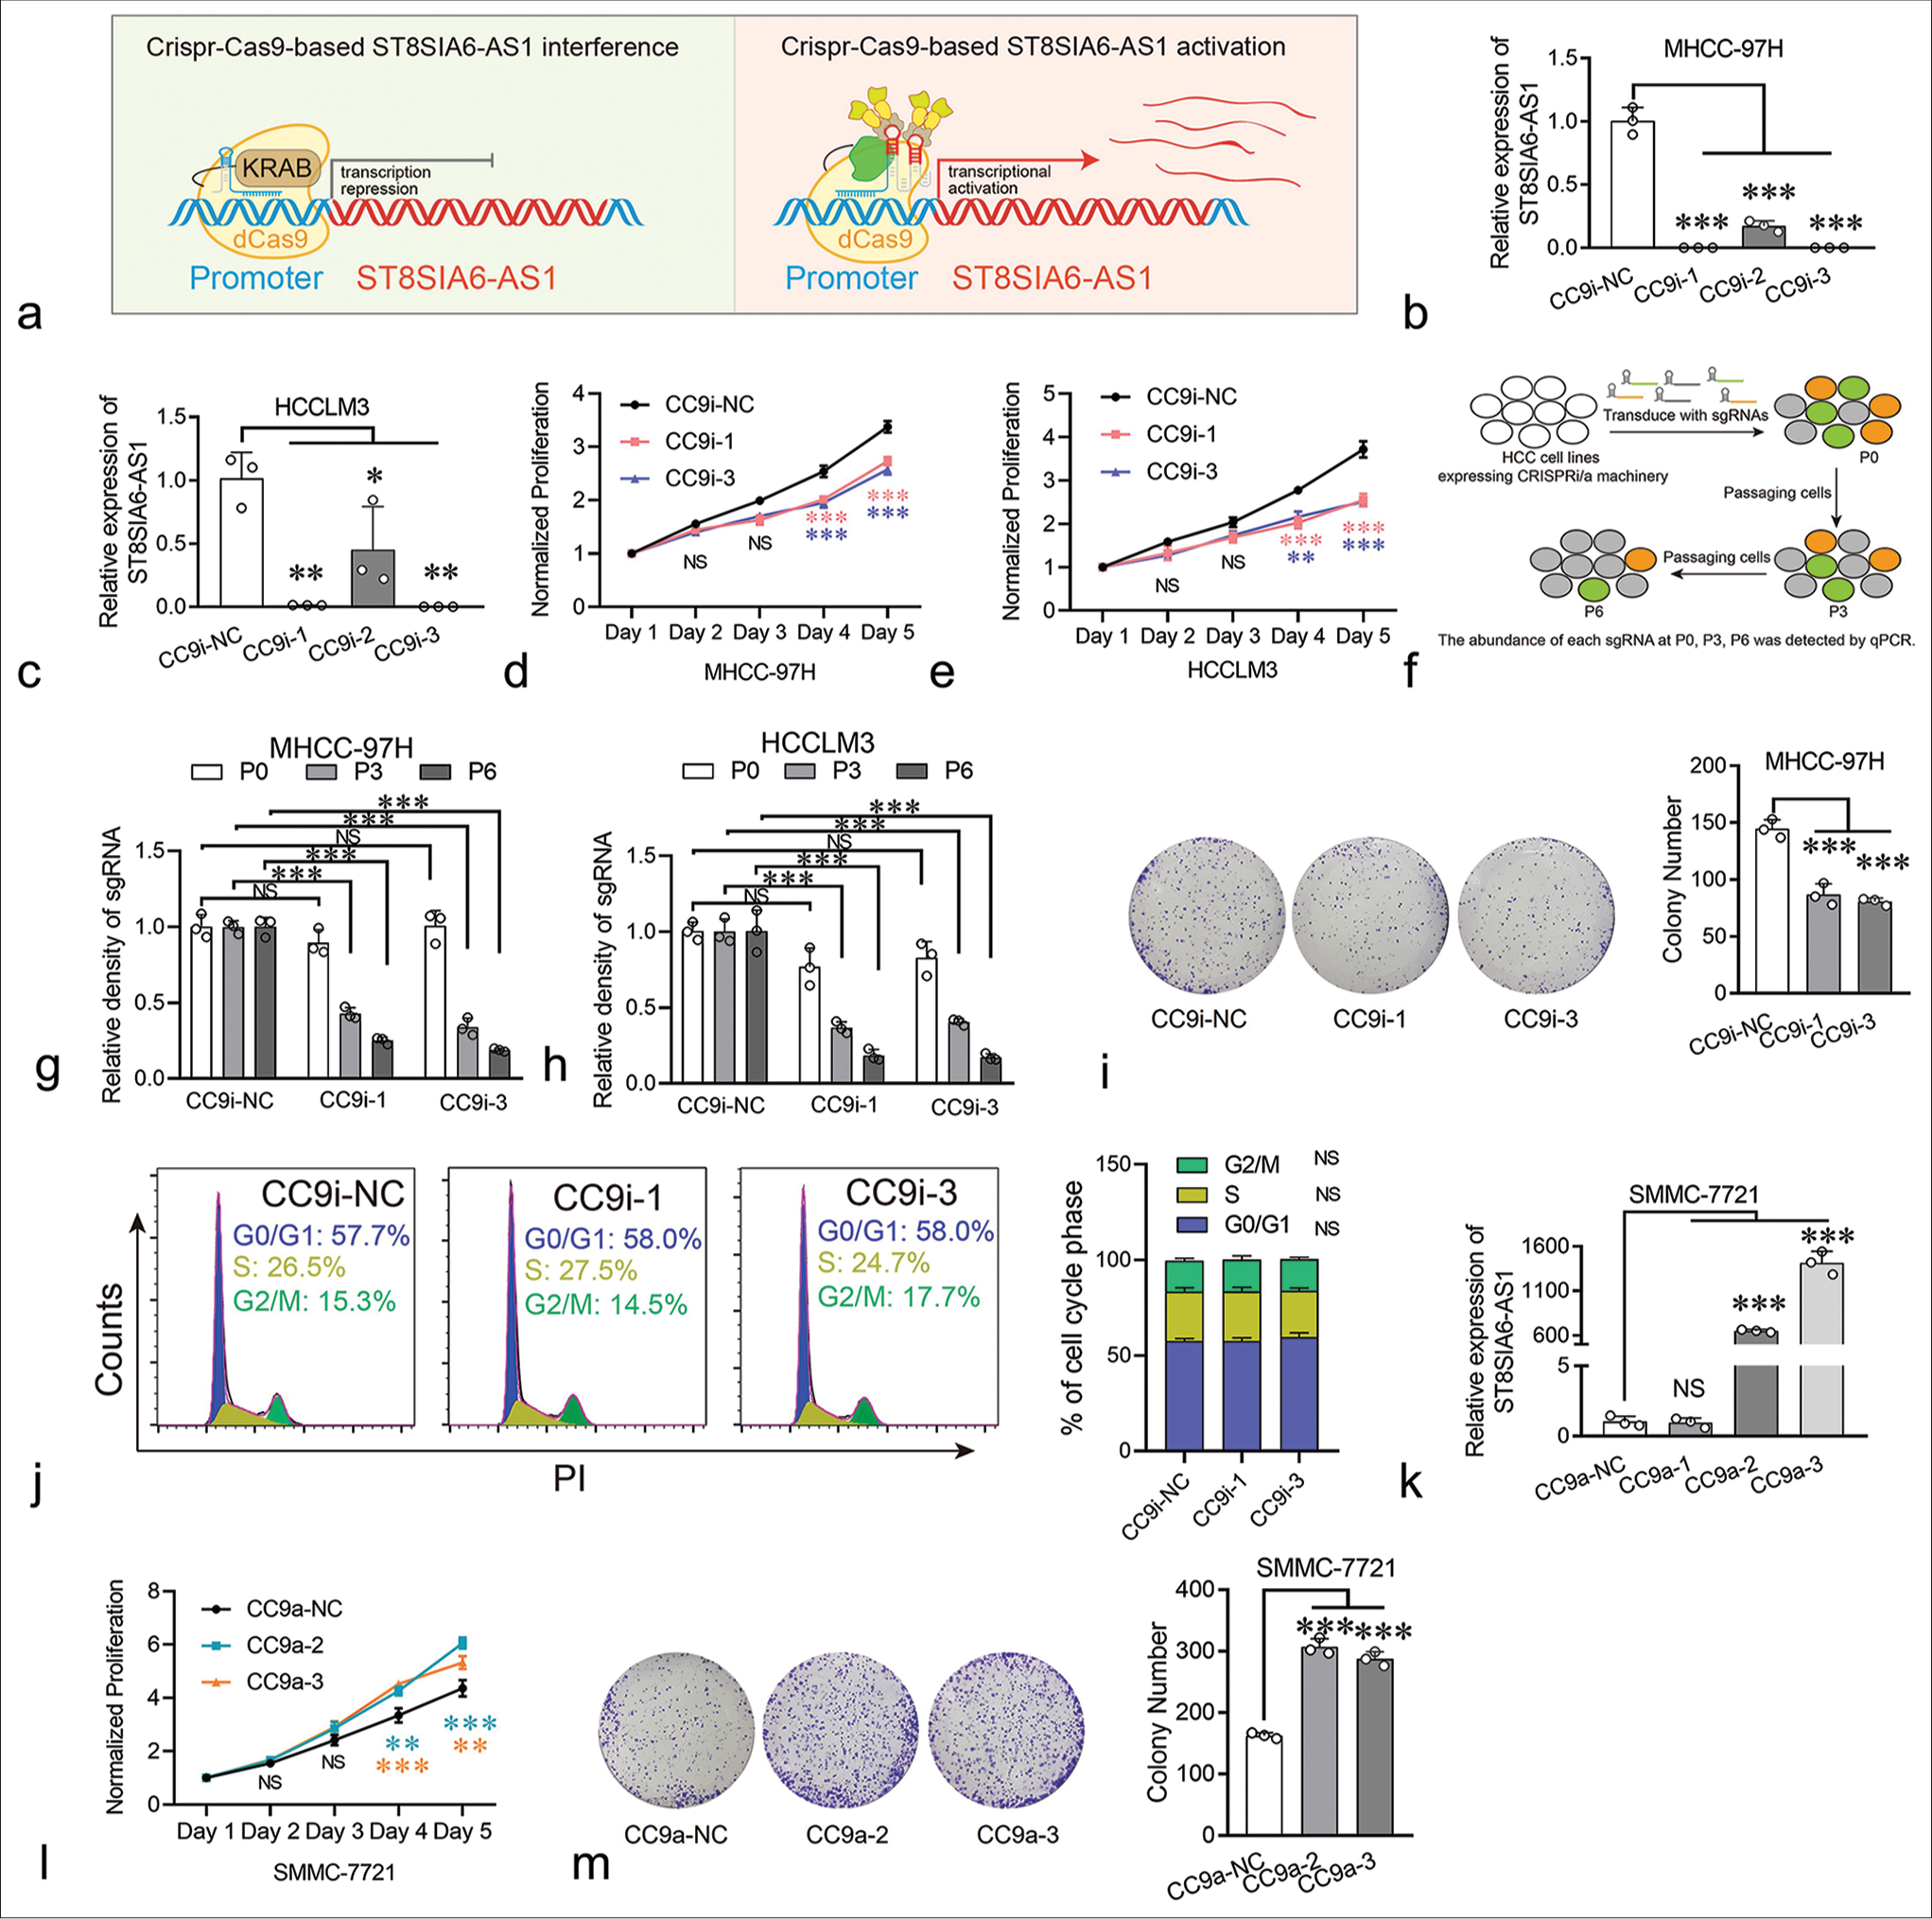
ST8SIA6-AS1 can promote the proliferation of HCC cells in vitroFurthermore, we investigated the biological functions of ST8SIA6-AS1 in HCC. Small interfering RNAs (siRNAs) were used to knock down the expression of ST8SIA6-AS1 in the MHCC-97H and HCCLM3 cells. However, none of the six siRNAs used in our experiment effectively knocked down ST8SIA6-AS1 (<25% of the control group) [Supplementary Figure 1(b)]. Thus, we performed Crispr-Cas9-based gene knockdown and found that two of the three sgRNAs that bind to the ST8SIA6-AS1 promoter region efficiently knocked down the expression of ST8SIA6-AS1 in two different HCC cell lines [Figure 2a-c]. Notably, the knockdown efficiency of CrisprCas9-based gene interference (CC9i)-1 and CC9i-3 was much higher than that of siRNA (99.93% and 99.88% in MHCC-97H [P < 0.001] and 98.71% and 99.84% in HCCLM3 [P = 0.001]) and was close to the gene knockout level. Then, we generated cell proliferation curves to explore the effects of ST8SIA6-AS1 knockdown on cell proliferation. ST8SIA6-AS1 knockdown in the MHCC-97H and HCCLM3 cells effectively inhibited cell growth relative to the cell growth in the control group (cells with scrambled sgRNA) [Figure 2d and e]. To further confirm this result, we conducted a Crispr-Cas9-based cell proliferation competition assay. Briefly, cells with scrambled sgRNA or interference sgRNA were mixed in a 1:1 ratio, co-cultured, and passaged. The relative abundance of each sgRNA was detected during successive cell passages [Figure 2f]. These results show that the abundance of interference sgRNA in the MHCC-97H and HCCLM3 cells decreased with cell culture generation, which indicated that ST8SIA6-AS1 knockdown decreased the proliferation of the cells compared with the vector control [Figure 2g and h]. The result of clone formation assay performed on MHCC-97H cells showed similar proliferation inhibitory effects (P < 0.001) [Figure 2i]. In addition, we investigated the effects of ST8SIA6-AS1 knockdown on cell cycle and apoptosis. It did not significantly affect the cell cycle phase distribution and apoptosis of the cell lines [Figures 2j, Supplementary Figure 2(a) and 2(b)]. In conclusion, these results indicated that ST8SIA6-AS1 knockdown inhibited the proliferation of the HCC cells in vitro.
Export to PPT
Furthermore, the effects of ST8SIA6-AS1 overexpression on the HCC cells were investigated. Traditional ectopic expression techniques driven by strong exogenous promoters can only express one transcript, but the number of transcripts for lncRNAs has not been fully determined. In the RefSeq database, ST8SIA6-AS1 has only one definitive transcript, whereas the LNCipedia database (https://lncipedia.org/) has annotated seven transcripts [Supplementary Table 2]. To prevent experimental bias caused by overexpression of a single transcript, we applied Crispr-Cas9-based transcriptional activation on multiple transcripts simultaneously. Results showed that two of the three sgRNAs upregulated the levels of ST8SIA6-AS1 by factors of 650 and 1415 in the SMMC-7721 cells (P < 0.001) (HCC cells with low basal expression of ST8SIA6-AS1) [Figure 2k]. The overexpression of ST8SIA6-AS1 greatly promoted the proliferation of the HCC cell lines [Figure 2l]. The result of clone formation assay for SMMC-7721 cells showed similar proliferation-promoting effects (P < 0.001) [Figure 2m]. Thus, ST8SIA6-AS1 overexpression markedly enhanced the proliferation of the HCC cell lines in vitro.
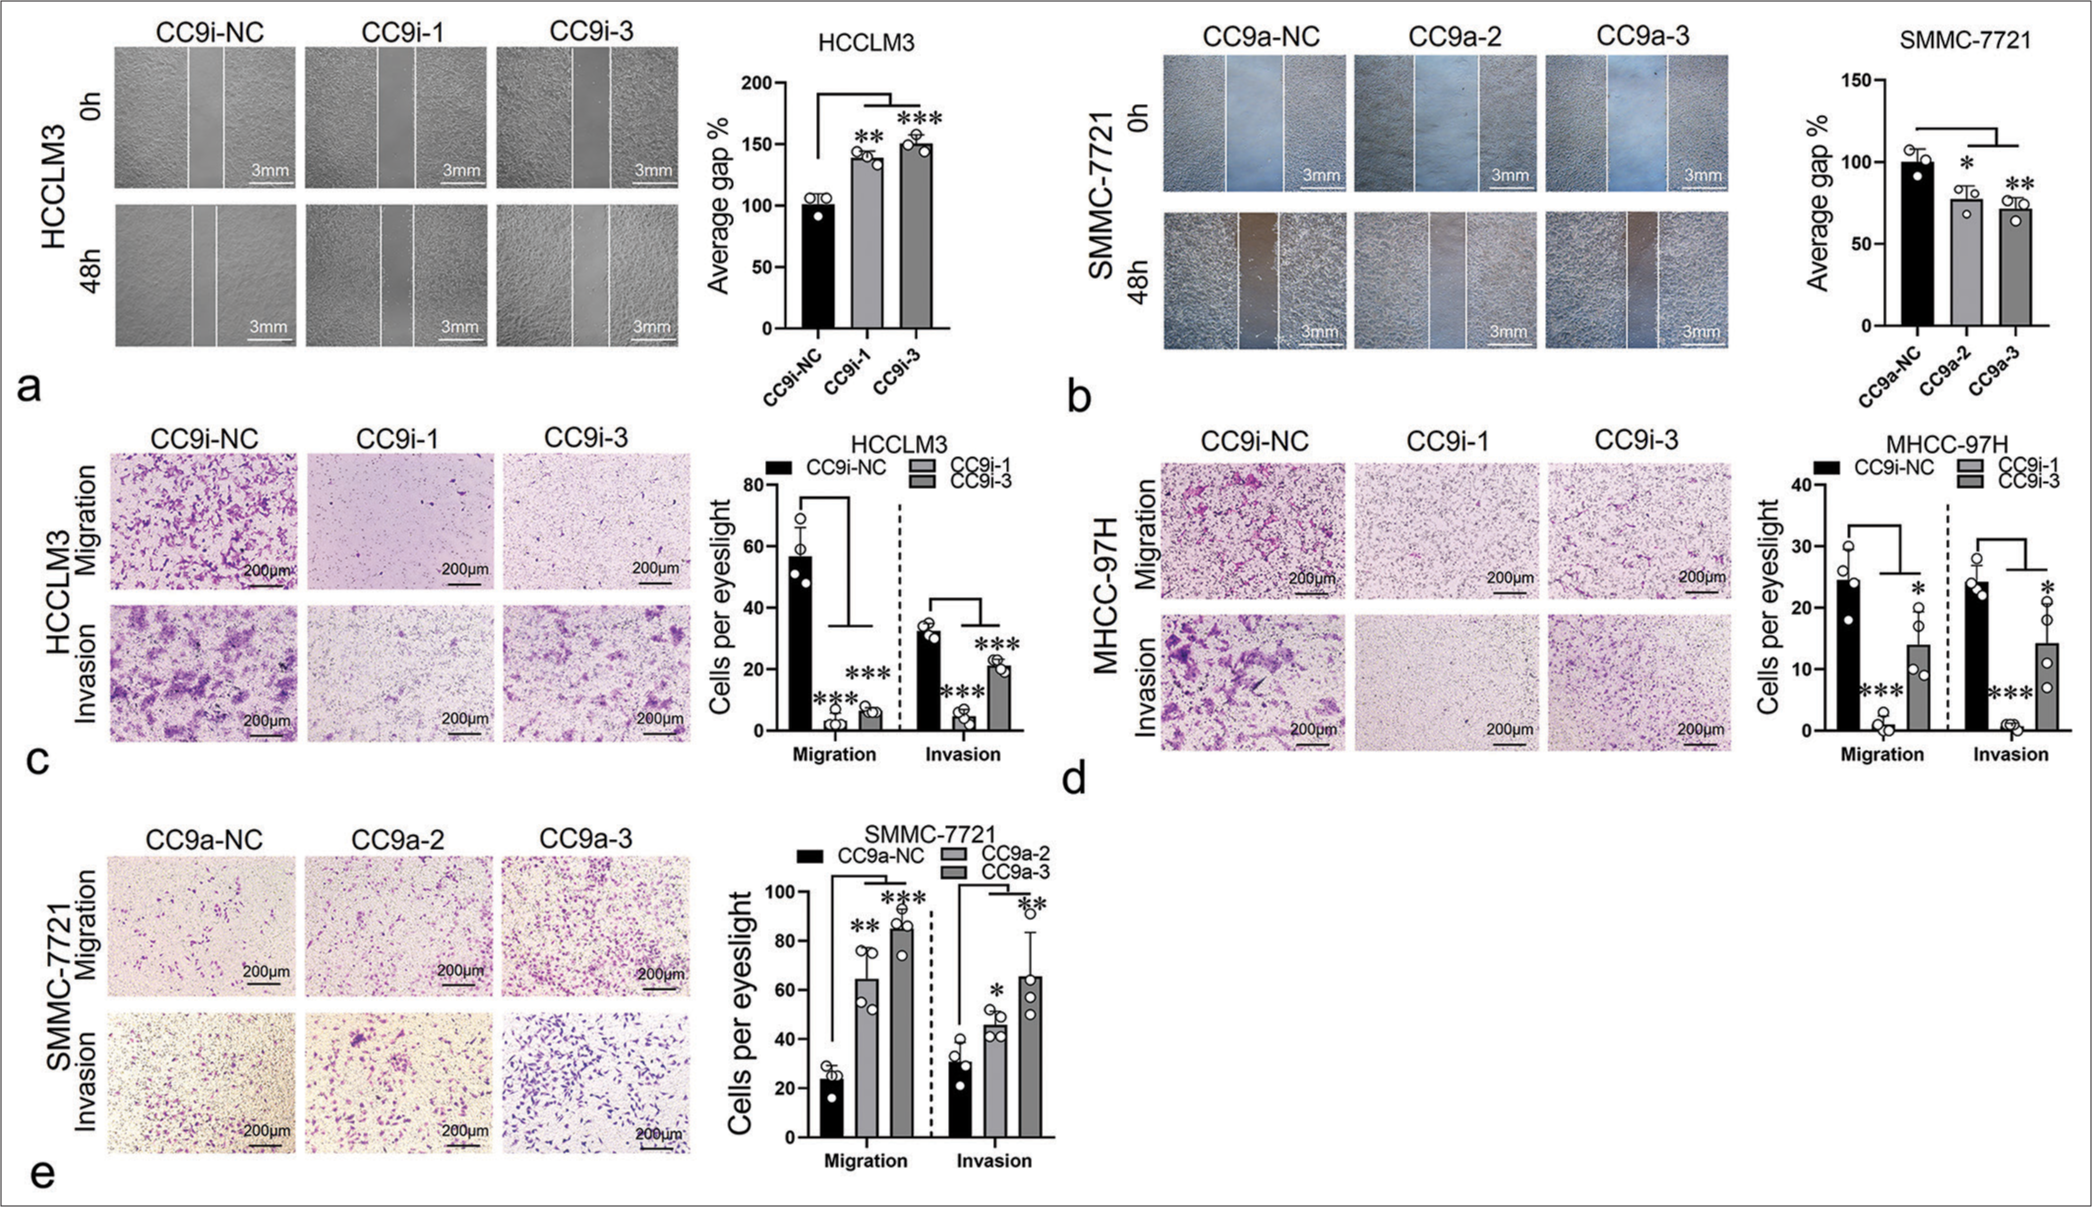
ST8SIA6-AS1 promotes the migration and infiltration of HCC cells in vitroTo evaluate the effect of ST8SIA6-AS1 on the migration and invasion of HCC cells, we performed a wound healing assay. The ST8SIA6-AS1 knockdown cell lines showed considerable reduction in migration rate, and ST8SIA6-AS1 overexpression promoted the migration of the cells [Figure 3a and b]. Transwell assay results validated these findings [Figure 3c-e]. In addition, we evaluated the effect of ST8SIA6-AS1 on the infiltration ability of the HCC cells by assessing the capacity of the cells to cross the Matrigel matrix. The results showed that ST8SIA6-AS1 knockdown considerably reduced the infiltration of the cells, whereas ST8SIA6-AS1 overexpression substantially improved the infiltration of the cells [Figure 3c-e].
Export to PPT
Thus, ST8SIA6-AS1 improved the oncogenic characteristics of various liver cancer cells in vitro, demonstrating its potential role in the pathogenesis of HCC.
ST8SIA6-AS1 knockdown considerably reduces the growth of liver tumor in vivoHere, we illustrated the effects of ST8SIA6-AS1 on the proliferation, migration, and invasion of HCC cell lines in vitro and then elucidated the role of ST8SIA6-AS1 in the formation of liver tumors in vivo. We subcutaneously inoculated HCCLM3 cells with knocked down ST8SIA6-AS1 and control HCCLM3 cells into nude mice (one million cells per mouse). Tumor diameter was measured with a Vernier caliper starting from the seventh day of the experiment, and measurements were performed every 2 days. At the end of the experiment, the mice were euthanized, and tumor diameter and weight were measured [Figure 4a]. The results showed that the tumor volume of the ST8SIA6-AS1 knockdown cells was much smaller than that of the control cells (P = 0.0441) [Figure 4a and b]. We further randomly selected three tumor tissues from the experimental and control groups to detect the expression level of ST8SIA6-AS1 and determined the persistent low level of ST8SIA6-AS1 expression in the experimental groups (P < 0.001) [Figure 4c]. Immunohistochemistry revealed considerably reduced Ki-67 staining in the experimental group, indicating that ST8SIA6-AS1 knockdown reduced the proliferation of the tumor cells [Figure 4d]. Furthermore, we performed orthostatic liver tumor transplantation. These results showed that the reduction of ST8SIA6-AS1 expression markedly decelerated the growth of liver tumors in situ [Figure 4e]. In conclusion, these results demonstrated that ST8SIA6-AS1 promoted the growth of liver tumors in vivo.

Export to PPT
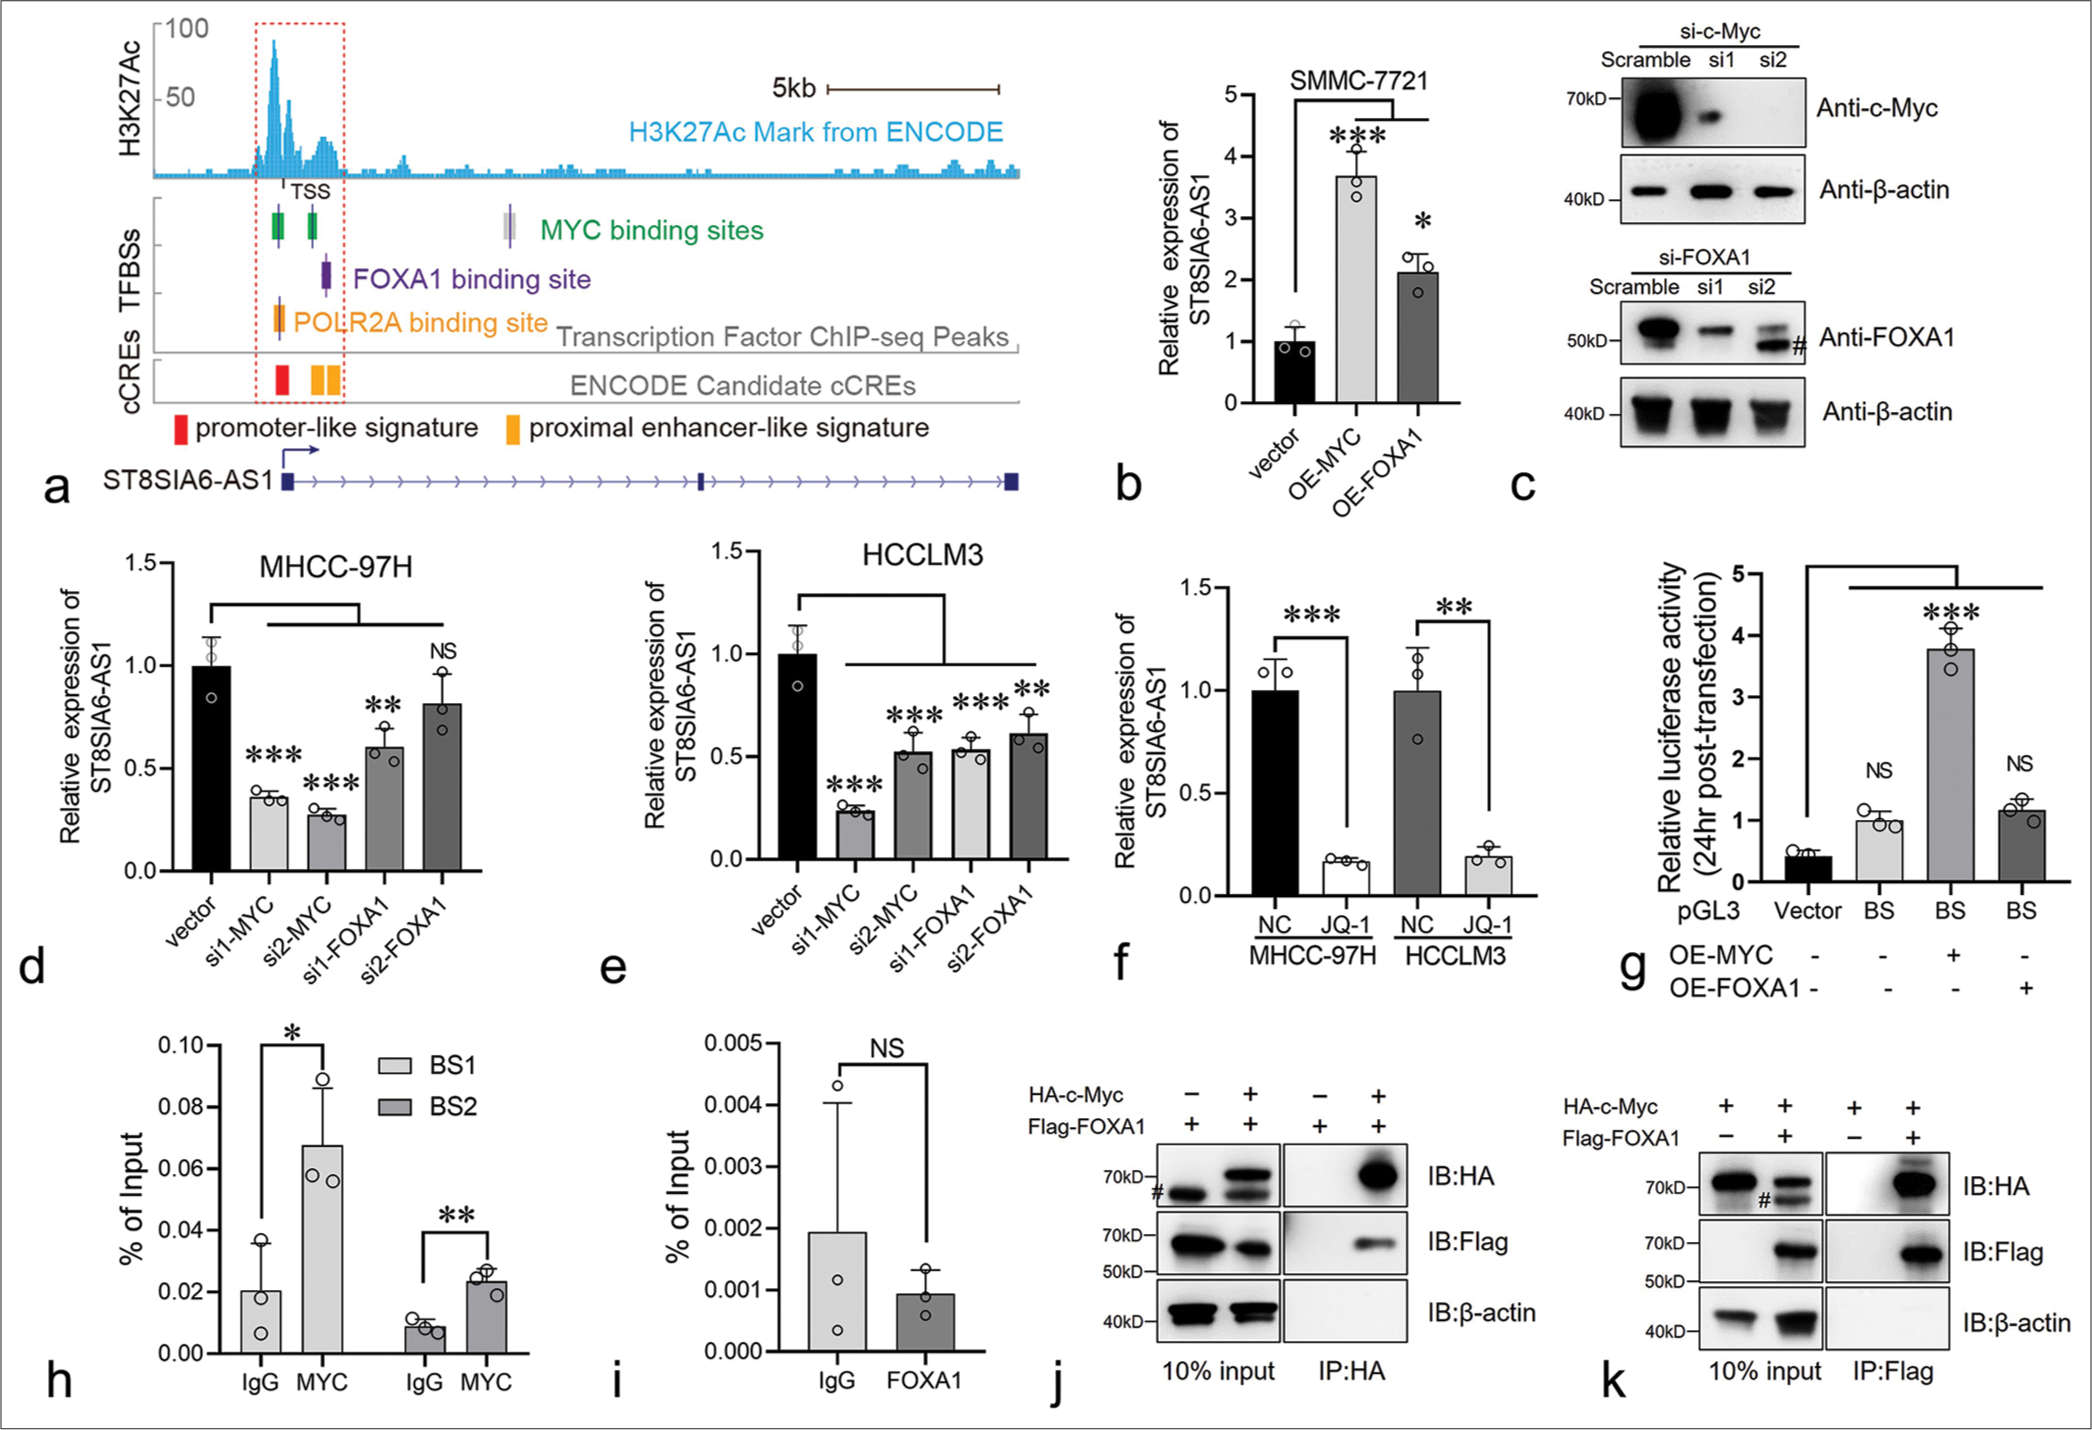
Myc regulates the expression of ST8SIA6-AS1 by binding to its promoter regionST8SIA6-AS1 expression was higher in liver tumors than in normal hepatocytes. We further explored the regulatory mechanism involved. ChIP-seq data from the Encylopedia of DNA Elements (ENCODE) database showed that three transcript factors, namely, Myc, Forkhead box A1 (FOXA1), and POLR2A, potentially bind to the ST8SIA6-AS1 promoter region [Figure 5a]. Myc had two binding sites (−260 bp to +155 bp and +1003 bp to +1312 bp) of the ST8SIA6-AS1 TSS [Figure 5a]. The transcription factors FOXA1 and POLR2A bound to the +1368 bp to +1489 bp and −210 bp to +193 bp restions of the TSS, respectively, indicating that these transcription factors participate in the transcriptional regulation of ST8SIA6-AS1 [Figure 5a]. In addition, overlapping MYC, FOXA1, and POLR2A binding sites, there is a significantly high H3K27 acetylation region at −960 bp to +1803 bp of the ST8SIA6-AS1 TSS, which is generally found near active regulatory elements [Figure 5a].[25] In addition, candidate cis-regulatory elements from the ENCODE mark the TSS region as a promoter-like signature.[26] This region overlaps partially with the binding sites of Myc and FOXA1 [Figure 5a]. These results indicated that the −960 bp to +1803 bp region is the transcriptional regulatory region of ST8SIA6-AS1. Myc is a critical factor in tumorigenesis and is upregulated in various tumors. FOXA1 belonging to the forkhead box family of proteins, which have conserved DNA-binding domains and play important roles in cell proliferation and HCC metastasis.[27] POLR2A RNA polymerase II subunit A is a housekeeping gene and an important component of the transcriptional complex. Therefore, in subsequent experiments, we focused on the regulatory effects of Myc and FOXA1 on ST8SIA6-AS1. We first overexpressed Myc or FOXA1 with pCDNA3.1 in SMMC-7721 cells, and the expression of ST8SIA6-AS1 was measured using qPCR. The overexpression of Myc and FOXA1 significantly increased ST8SIA6-AS1 expression compared with that in the control group (P < 0.001 and P < 0.05, respectively) [Figure 5b]. Furthermore, the knockdown of Myc or FOXA1 by siRNA in the MHCC-97H and HCCLM3 cells considerably reduced ST8SIA6-AS1 expression [Figures 5c-e and Supplementary Figure 3(a)]. Notably, Myc showed a stronger transcriptional regulation effect on ST8SIA6-AS1 than FOXA1 [Figure 5c-e]. In addition, treatment of the MHCC-97H and HCCLM3 cells with the BET bromodomain inhibitor JQ-1, which is a drug reducing Myc expression, significantly downregulated ST8SIA6-AS1 expression (P < 0.001 and P = 0.0028) [Figure 5f]. Luciferase reporter assays were performed to clarify the regulatory relationships described above. We constructed DNA fragments from the −260 bp to +1489 bp region of the ST8SIA6-AS1 TSS onto a pGL3-basic vector and transfected 293T cells simultaneously with an Myc- or FOXA1-loaded pCDNA.1 or pCDNA3.1 vector. The Myc protein significantly enhanced the luciferase signal (P < 0.001), whereas the transfection of FOXA1 did not efficiently enhance the luciferase signal. These results indicated that Myc upregulated the expression of ST8SIA6-AS1 mainly by directly binding to the ST8SIA6-AS1 region [Figure 5g]. To further determine the mode of binding between Myc and the ST8SIA6-AS1 promoter region, we performed a ChIP-qPCR assay. Compared with the control IgG, Myc showed a higher binding ability to the −260 bp to +155 bp and +1003 bp to +1312 bp regions (P = 0.0275 and P = 0.0059, respectively) [Figure 5h]. However, FOXA1 immunoprecipitation cannot effectively enrich the potential binding sites [Figure 5i]. In addition, we performed a co-IP assay to explore whether Myc and FOXA1 physically interact and found that the two proteins bind each other in an overexpression system [Figure 5j and k]. In summary, the transcription factor Myc directly bound to the ST8SIA6-AS1 promoter region at −260 bp to +155 bp and +1003 bp to +1312 bp of the TSS to upregulate the expression of ST8SIA6-AS1.
Comments (0)