
Remember me


A weighted total of 732,405 patients were identified from the first 9 months of 2016–2022, with 4.6%, 6.9%, and 31.1%, and 57.6% coming from very low, low, medium, and high volume hospitals, respectively (Table 1). More frequently (p < 0.001) in lower volume centers patients were residents of the state where the operation was performed, Medicare payers, older, from smaller cities/towns, and of lower income status. Patients at higher volume centers were significantly more female, private insurance payers, from larger cities, and of higher income status. There is no association with Medicaid status and hospital volume.
Table 1 Baseline characteristics, stratified by very low (1–24 cases/year), low (25–49 cases/year), medium (50–124 cases/year), and high volume bariatric centers (125 + cases/year) using the Nationwide Readmissions Database from 2016 to 2022. Kruskal–Wallis and weighted chi-squared tests for three populations used to assess significance across the cohortHospital/Operative FactorsThere were 4090, 744, and 1481, and 1069 very low, low, medium, and high volume hospitals, respectively. Patients from lower volume centers were significantly (p < 0.001) more often at small bed size hospitals, private investment owned hospitals, and metropolitan non-teaching hospitals as well as non-metropolitan hospitals. Patients which had an operation performed at higher volume centers significantly more frequently were at larger bed size centers, private non-profit hospitals, and metropolitan teaching hospitals.
Comorbidities and Healing FactorsVery low volume center patients had higher average Charlson Comorbidity Index values relative to patients with operations performed at higher volume counterparts (very low: 1.0 ± 1.4 vs. low: 0.8 ± 1.1 vs. medium: 0.8 ± 1.1vs. high: 0.8 ± 1.1). Overall, lower volume hospital patients had higher rates of more severe comorbidities which include chronic kidney disease (CKD), coronary heart disease, chronic heart failure (CHF), and peripheral arterial disease. They also had higher rates of type 2 diabetes, obstructive sleep apnea, long-term non-steroidal anti-inflammatory drugs (long-term NSAID), alcohol abuse, and long-term usage of steroids.
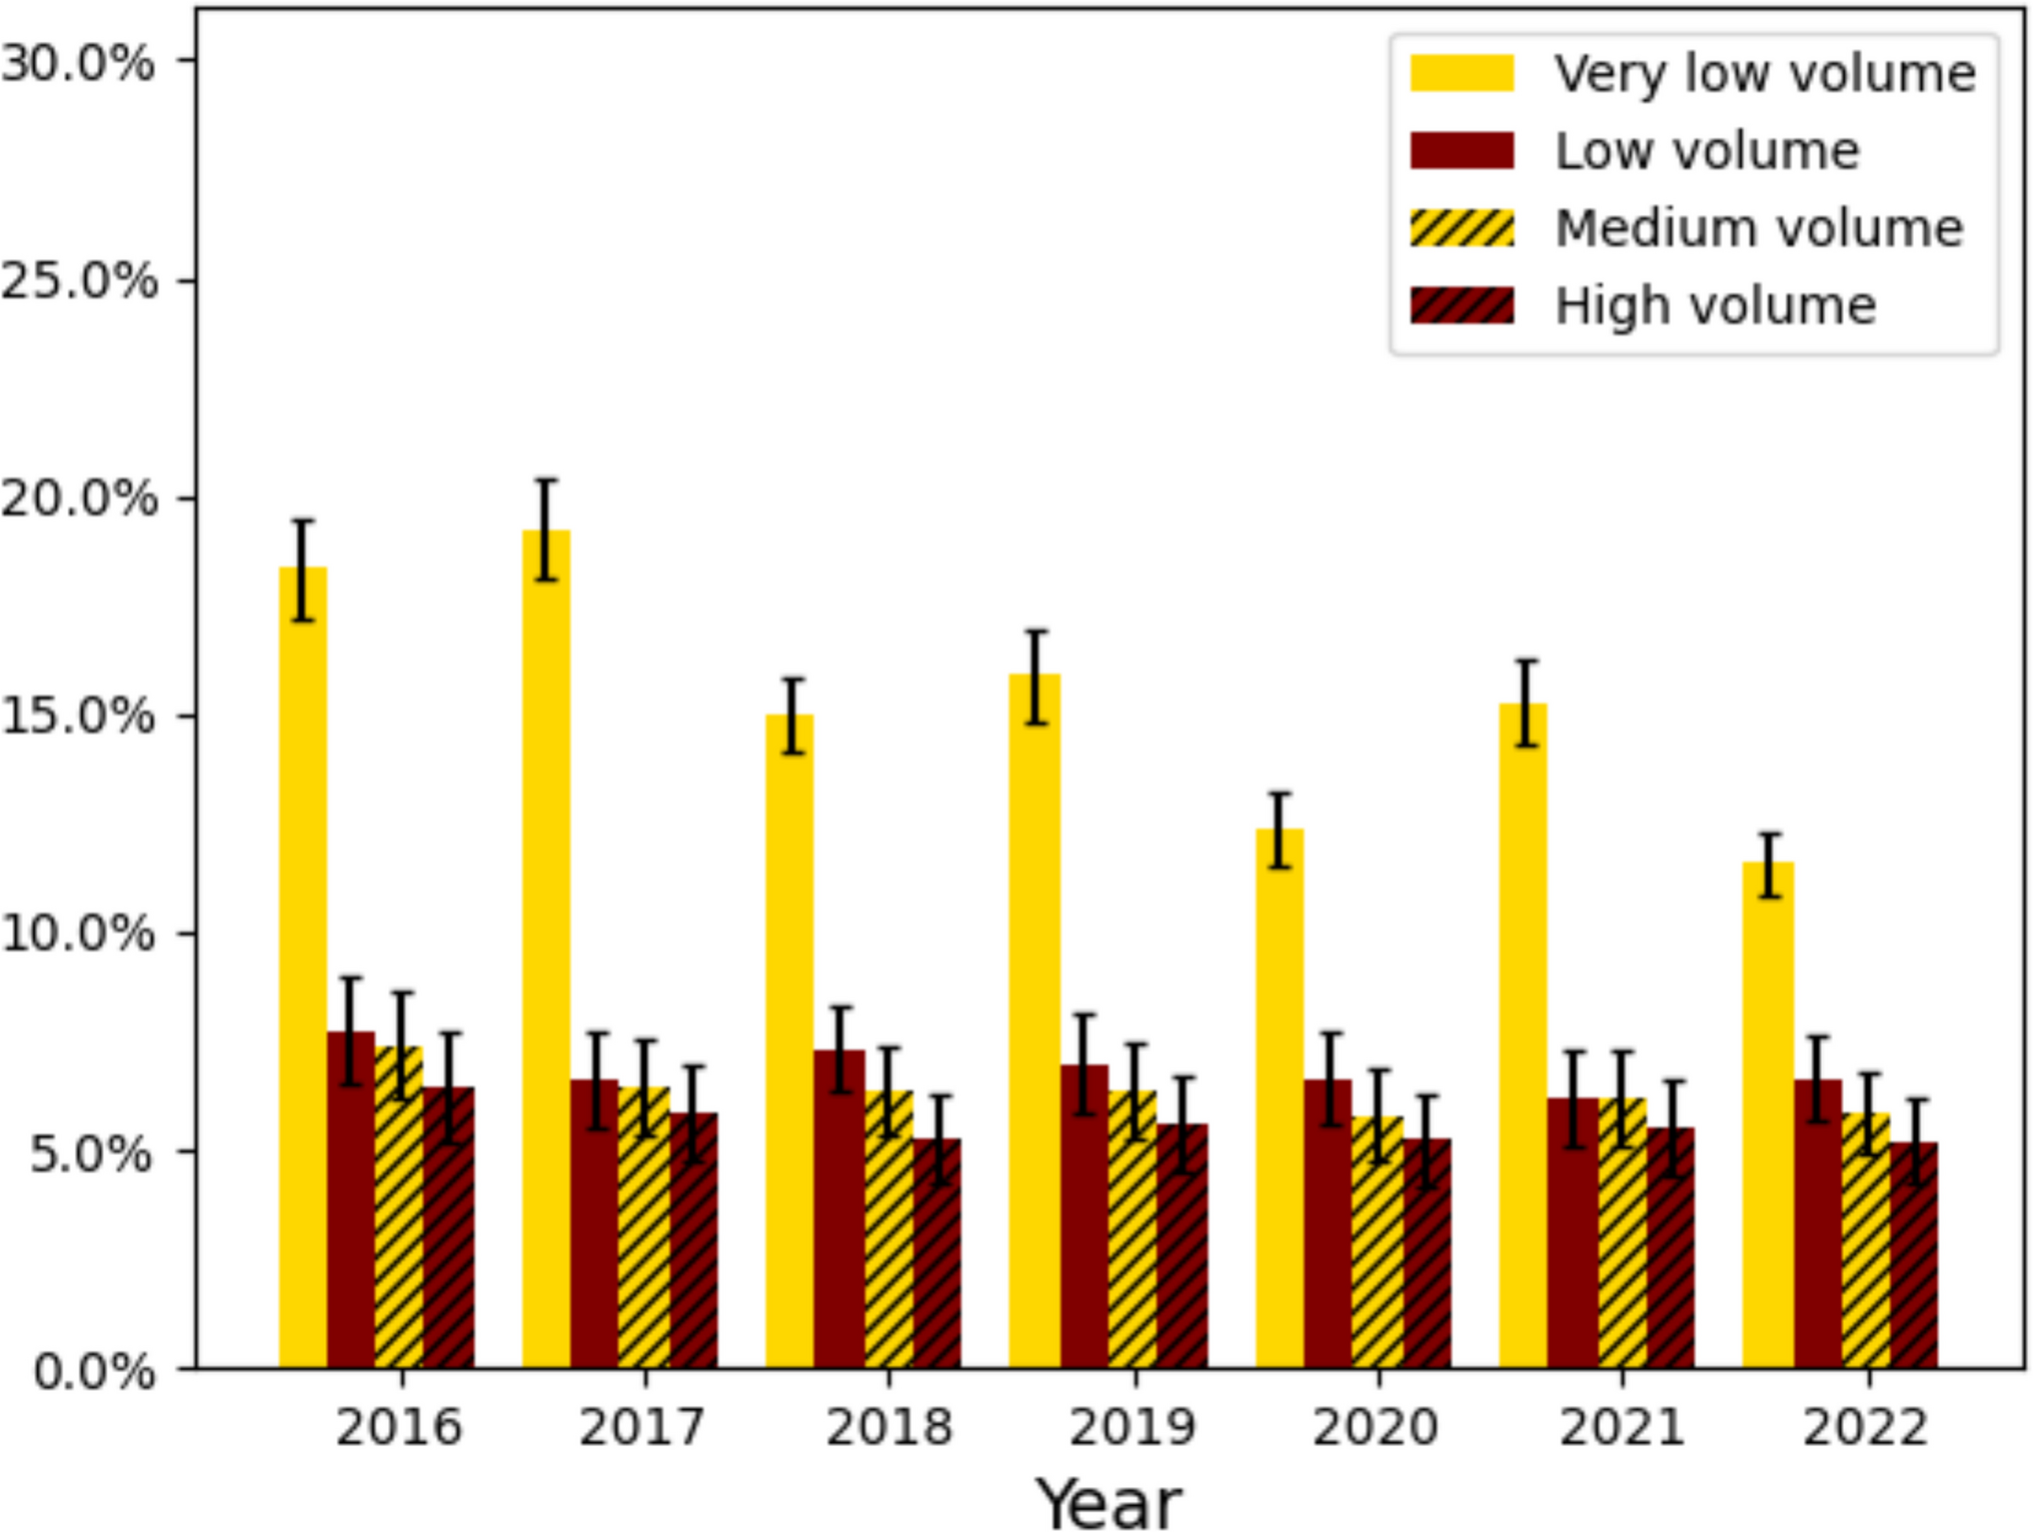
Univariate Outcome AnalysisThere were significant differences in rates of 90-day readmission and morbidity across patients at low, medium, and high volume centers. 90-day readmission rates were 15.4%, 6.9%, 4.1%, and 3.2% across very low, low, medium, and high volume bariatric centers. 90-day morbidity rates were 26.0%, 13.2%, 11.9%, and 10.9%, and across very low, low, medium, and high volume centers (Table 2, Figs. 1 and 2). Overall, the most common complications were electrolyte derangements (very low: 13.1% vs. low: 6.0% vs. medium: 5.2% vs. high: 5.0%), cardiac arrhythmias (very low: 6.0% vs. low: 3.4% vs. medium: 3.1% vs. high: 2.6%), and infections (very low: 5.1% vs. low: 2.1% vs. medium: 1.7% vs. high: 1.3%). Additionally, the total charges were on average lower for higher volume hospitals. Propensity matching analysis on age, sex, and Charlson comorbidity index consistently shows higher rates of adverse events in lower volume groups (Supplementary Table 3).
Table 2 Outcomes stratified by very low (1–24 cases/year), low (25–49 cases/year), medium (50–124 cases/year), and high volume bariatric centers (125 + cases/year) using the Nationwide Readmissions Database from 2016 to 2022. Kruskal–Wallis and weighted chi-squared tests for three populations used to assess significance across the cohortFig. 1
Rates of 90-day readmission stratified by hospital volume in the first 9 months of the Nationwide Readmissions Database from 2016 to 2022 for patients who had a vertical sleeve gastrectomy or Roux-en-Y gastric bypass performed
Fig. 2
Rates of 90-day morbidity stratified by hospital volume in the first 9 months of the Nationwide Readmissions Database from 2016 to 2022 for patients who had a vertical sleeve gastrectomy or Roux-en-Y gastric bypass performed
Multivariable Outcome AnalysisDemographic factors which confer increased risk of 90-day readmission and morbidity were residence status of the state where the operation was performed, low/middle income status, and increased age. Medicaid status, small city/micropolitan area patient residence, small town patient residence, and private insurance each were associated with decreased risk (Tables 3 and 4). Very low volume bariatric centers (90-day readmission: 2.94 [2.83, 3.06], 90-day morbidity: 2.62 [2.53, 2.70]) was the health factor associated with the largest increase in risk of both 90-day readmission and morbidity. Low and medium volume centers also conferred additional risk (low, 90-day readmission: 1.26 [1.21, 1.32], 90-day morbidity: 1.20 [1.16, 1.24], medium, 90-day readmission: 1.13 [1.10, 1.16], 90-day morbidity: 1.07 [1.05, 1.09]). Small bed size was associated with decreased risk of 90-day readmission and morbidity. Of the 7 fixed effects and 1 random effect analyzed, each was significant (Table 5). Very low volume caseload had the highest estimated increase in LOS (1.03 [0.94, 1.11]) and low and medium volume centers having a not statistically significant estimated LOS increase, (low: 0.07 [− 0.05, 0.2], medium: − 0.007 [− 0.009, 0.010). Charlson comorbidity index (0.134 [0.132,0.136]) also increased the estimated LOS. The random effect, unique hospitals, represented a significant source of variation (1.31 [1.27, 1.36]).
Table 3 Logistic regression on dependent variable 90-day readmission NRD 2016–2022 after bariatric surgeryTable 4 Logistic regression on dependent variable 90-day morbidity NRD 2016–2022 after bariatric surgeryTable 5 Linear mixed effects model on dependent variable length of stay NRD 2016–2022 for major bariatric surgery
Comments (0)