Study population and design
The NHANES is a nationally representative, cross-sectional survey of the non-institutionalized US population with publicly available data [11,12,13,14]. NHANES is based on complex, stratified, multistage probability cluster sampling design data and allows for large-scale epidemiological analyses [15, 16]. Each NHANES cycle surveys about n = 5000 participants [13]. All participants provide written informed consent. Additional information regarding the NHANES may be obtained from the official website [11].
Vegetarian status assessment
The vegetarian status was drawn from the NHANES diet behavior and nutrition module [17]. This module included the question “Do you consider yourself to be a vegetarian?” which was used for the initial group assignment. Participants who replied with “Yes” were considered vegetarians, whereas those replying “No” were considered to belong to the general population. Participants who replied with “Don’t know” were not considered for this analysis. Vegetarian status assessment was thus initially based on a self-reported binary question.
Notably, the diet behavior of NHANES vegetarians has been analyzed in the past, and a previous study by Juan et al. suggested that several self-identified NHANES vegetarian reported the consumption of some type of flesh products (meat, poultry, and/or seafood) [18]. Taking these findings into account, we constructed two further subgroups and divided the self-identified vegetarian group in a “lacto-ovo-vegetarian” group and “semi-vegetarian” group. For this, we considered individual food intake data from a 24-h dietary recall. Participants who self-identified as vegetarians and who consumed no meat, poultry, and seafood were considered “lacto-ovo-vegetarians”. Those who self-identified as vegetarians but indicated the consumption of animal flesh in the dietary recall were considered “semi-vegetarians”. Individuals who did not consider themselves vegetarians and who reported the consumption of animal flesh in the 24-h dietary recall were assigned to the general population. We refrained from constructing a fourth group (pesco-vegetarians) in light of the already small sample size and with regard for the need to construct groups for which reliable subpopulation statistics could be computed (see statistical analysis below for details). A vegan group was not built due to the very low number of observations (n < 5).
Primary outcome
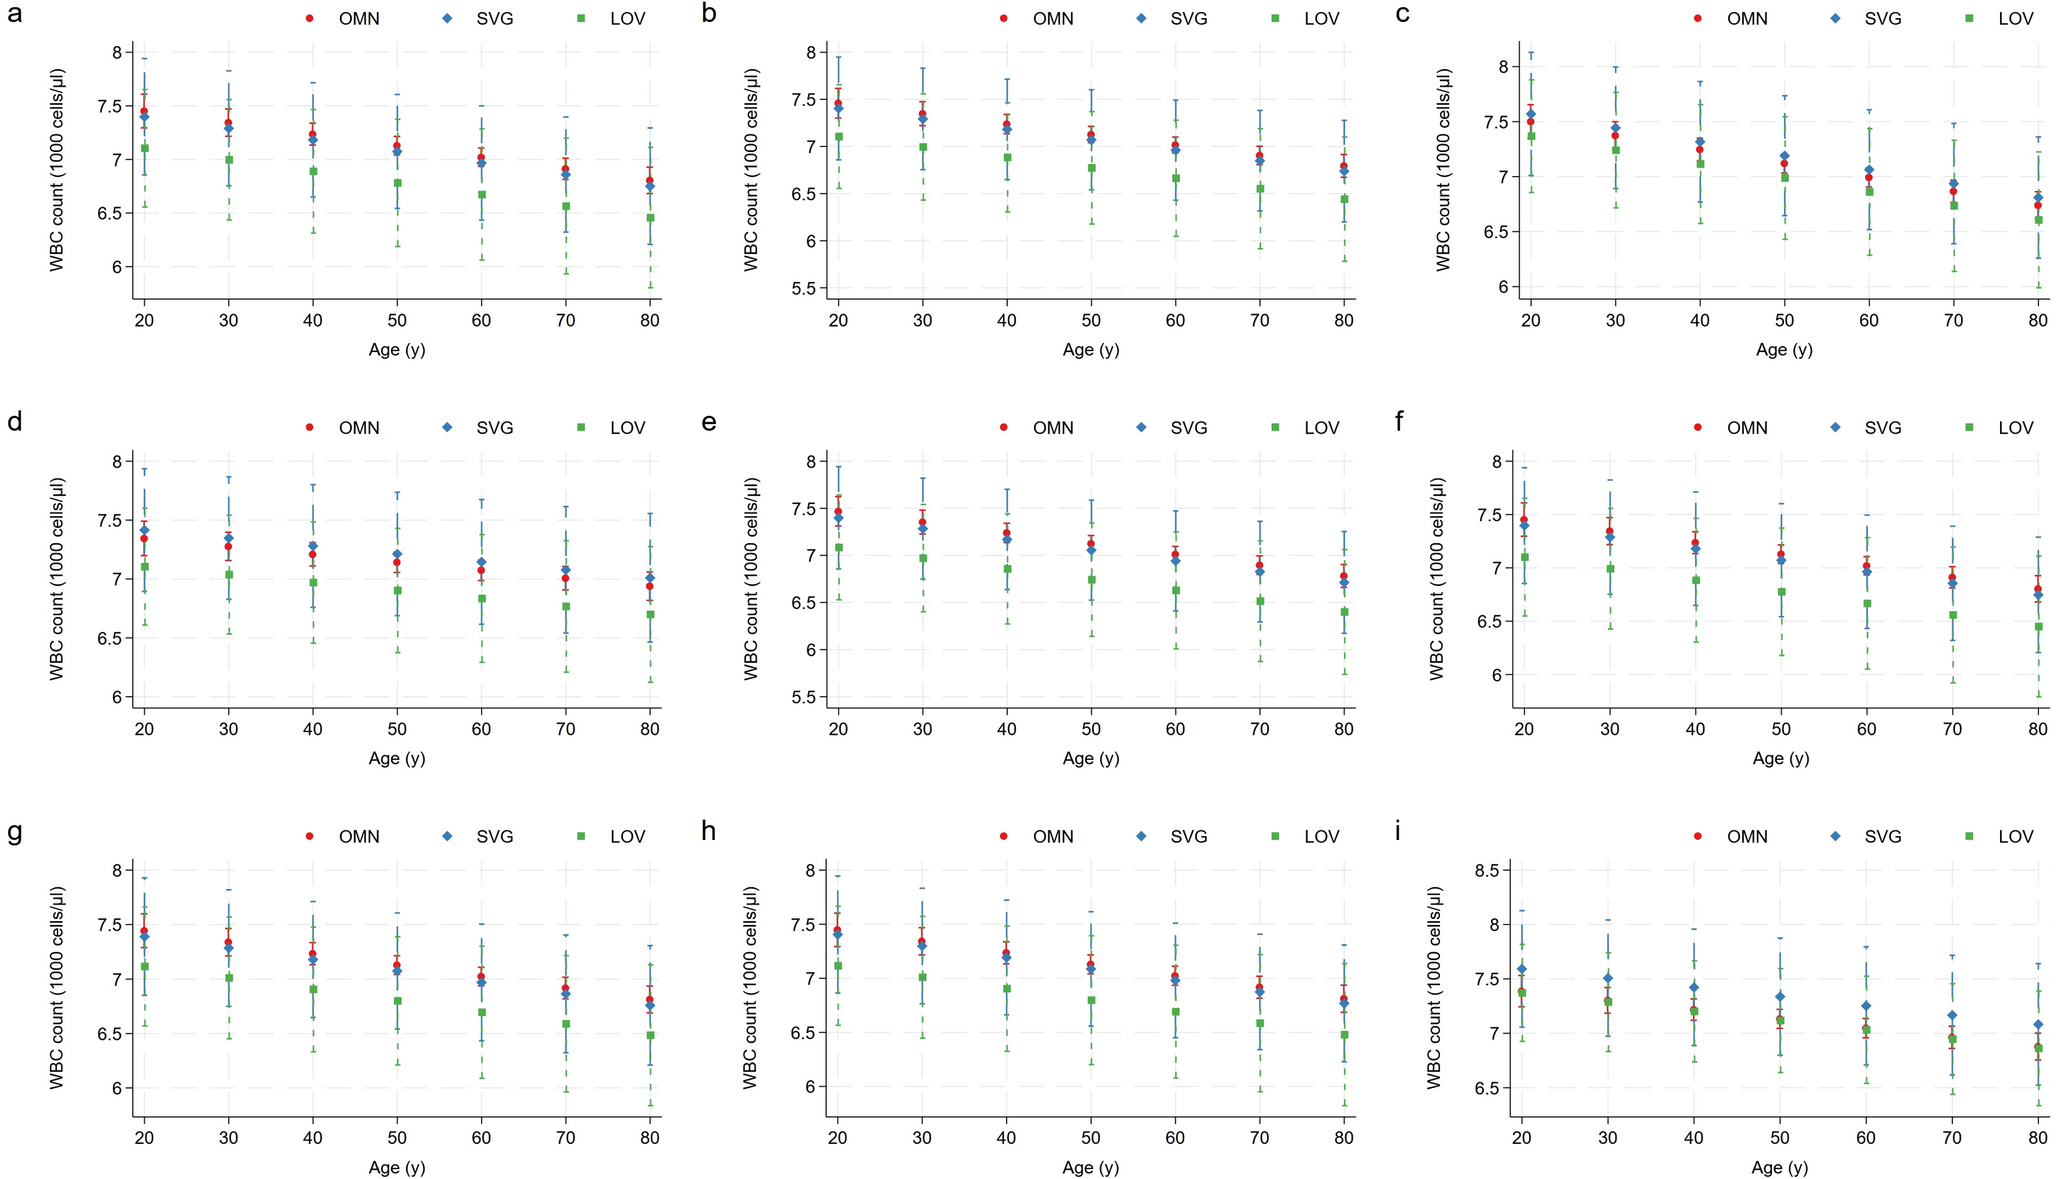
The primary outcome for this epidemiological analysis was the (crude and adjusted) white blood cell count (in 1000 cells/µL) in the vegetarian subgroups in comparison to the general population. Whole blood samples were analyzed in the NHANES mobile examination centers (MEC) [19]. Detailed specimen collection and processing instructions are available from the NHANES Laboratory/Medical Technologists Procedures Manual [20]. In brief, the methods used to derive the complete blood count parameters were based on the Beckman Coulter method of counting and sizing, in combination with an automatic diluting and mixing device for sample processing, and a single beam photometer for hemoglobinometry [19]. The white blood cell differential used the “Volume, Conductivity, and Scatter“ technology. The NHANES emphasized that there were no changes to the lab methods or lab site between the 2007/2008 and the 2009/2010 cycle [19]. White blood cells were selected as the primary outcome for their known association with systemic inflammation [21], and in light of previous studies reporting lower white blood cell levels in US and Polish vegetarians [3, 22].
Secondary outcomes
Secondary outcomes of interest included the platelet count, the neutrophil count and the lymphocyte count. Platelets play an important role in immune-mediated inflammatory diseases [23], and higher platelet levels and lower volumes in vegetarians have been reported previously in British white vegetarians [5]. The aforementioned secondary outcomes were also selected in light of a recent Chinese study that suggested an association between vegetarian status and the neutrophil to lymphocyte ratio [24].
Other whole blood count data of interest
Further to that, we also investigated other complete blood count data including hemoglobin levels and the hematocrit, which were also provided in the NHANES full blood count data set. Notably, marginal predicted values were not estimated for these remaining parameters.
Sociodemographic data and covariates
A large set of sociodemographic variables was included to characterize the study population in great detail, including sex (binary categorical variable: male, female), age (continuous variable), race/ethnicity (categorical variable: Mexican Americans, Other Hispanic, Non-Hispanic White, Non-Hispanic-Black, Other Race), educational level (categorical variable: less than 9th grade, 9–11th grade, high school graduate, some college or associate degree, college graduate or above), and marital status (categorical variable: living with a partner/married, divorced/separated/widowed, never married).
As for the lifestyle factors, we included alcohol intake (binary categorical variable: ≥12 or < 12 drinks per year), smoking status (categorical variable: non-smoker, current smoker, former smoker), physical activity (continuous variable: minutes of sedentary time per day), history of recent head or chest cold (binary categorical variable: yes, no), history of recent flu, pneumonia or ear infection (binary categorical variable: yes, no) and body mass index (presented as a continuous variable and as a categorical variable with 4 categories). Nutrient intakes were obtained based on 24-h dietary recall data [25].
Apart from sociodemographic and lifestyle-related covariates, we also added laboratory markers. Beyond the complete blood count data [19], we also added folate serum concentrations as well as red blood cell folate (nmol/L) and C-reactive protein levels (mg/dl) as all three variables were deemed important with regard to the primary hypothesis of the study.
Inclusion and exclusion criteria
Only NHANES participants with a complete dataset were considered. Participants with missing data on any variable of interest were excluded. In addition to that, we pre-specified the following exclusion criteria: implausible energy intake/dietary data (as defined by an energy intake < 600 or > 5000 kcal/d), severe leukopenia or leukocytosis (as defined by a white blood cell count < 3000 or > 14000 cells/µl), severe lymphopenia or lymphocytosis (as defined by a lymphocyte count < 500 or > 6000 cells/µl), and severe thrombocytopenia or thrombocytosis (as defined by a platelet count < 100000 or > 500000 cells/µl). The rationale behind this approach was twofold: (I) to exclude NHANES participants with known or unknown hematological disorders, and (II) to construct a cohort with healthy individuals with blood count data within the normal range in order to minimize the impact of potential confounders.
Statistical analysis
The statistical analysis was performed in Stata Statistical Software (StataCorp (2015). Statistical Software: Release 14. College Station, TX: StataCorp LP). Visualization was performed in Stata 19 (StataCorp. 2025. Stata Statistical Software: Release 19. College Station, TX: StataCorp LLC). Two consecutive NHANES cycles were merged (2007–2008 and 2009–2010), which both included the ‘vegetarian status’ variable (‘DBQ915’) [17, 26, 27]. NHANES cycles prior to 2007 and after 2010 did not include this particular variable, and were thus not considered. A 4-year weight for medical examination center data was subsequently constructed (wtmec4year = wtmec2year/2), taking into account the NHANES tutorial weighting module and the analytic guidelines [28]. To account for the complex NHANES survey design characteristics and population weights, we performed weighted survey analyses throughout the entire analysis process using Stata’s “svyset” and “svy” commands.
In a second step, we defined the subpopulations to examine by excluding participants with missing data for any variable of interest. No imputation procedures were performed. The statistical analysis was performed in accordance with the recommendations of West, Berglund, and Heeringa for applied survey data analyses [29].
Descriptive statistics were estimated using subpopulation commands. Sociodemographic, anthropometric, laboratory and nutrient intake data were compared between the general population and vegetarians. Subpopulation statistics were additionally computed for lacto-ovo-vegetarians and semi-vegetarians. Data distribution was examined via histograms, box plots and subpopulation summary statistics. To create histograms, we followed the University of California’s “Survey Data Analysis in Stata” tutorial and used the integer part of the sampling weight by creating a frequency weight from the sampling weight [30]. Normally distributed data was described with the mean and corresponding 95%-confidence interval (CI).
For categorical variables, we provided weighted proportions with their 95%-confidence intervals. Prior analyses in NHANES vegetarians already revealed a low number of unweighted observations in the vegetarian subgroup [31,32,33]. All weighted proportions were thus checked for reliability with utmost care [34]. Our approach has been described previously and covered a careful comparison to the 2017 NCHS (National Center for Health Statistics) data presentation standards for proportions [34, 35]. Korn-Graubard CIs, the CI width, the sample size, and the degrees of freedom were considered upon assessing the reliability of a weighted proportion. To assess whether the NCHS criteria were met, we used Ward’s user-written command “kg_nchs” [36].
In a subsequent step, we estimated correlations between blood cell types and various anthropometric/dietary variables in the vegetarian subpopulation as well as their level of significance based on an approach described earlier by Sribney [37].
We then constructed multivariable linear regression models based on an approach by Heeringa et al. [29]. First, we conducted bivariate exploratory analyses beyond the aforementioned correlations and a literature search to identify potential candidate predictors for the outcomes of interest (white blood cells, platelets, lymphocytes and neutrophils). Clinically and/or scientifically relevant predictors with a bivariate relationship of significance p < 0.25 with the outcome variable were included in the initial model. Vegetarian status was included regardless of the level of significance. A basic set of four covariates was included in all models, including age, sex and ethnicity/race and vegetarian status. In subsequent models, additional covariates were individually added to this basic set (energy intake; body mass index; alcohol intake and smoking status; selenium intake; vitamin B12 intake; vitamin A intake; zinc intake). The final model included all previously added covariates together in a singular model. Nine models were constructed for each outcome of interest. The aforementioned covariates purposefully included potential mediators, e.g., smoking, which is less prevalent in vegetarians. Model improvement strategies such as interactions and adding square terms (to investigate potential quadratic relationships) were then tested.
In a subsequent step, we used Stata’s ‘margins’ function to display marginal predicted values of the outcome of interest for each level of the vegetarian status (e.g., non-vegetarian vs semi-vegetarian vs lacto-ovo-vegetarian) at all possible increments of 10 years (from 20 to 80). We then plotted these marginal predicted values including their 95% confidence intervals using Stata’s ‘marginsplot’. The post-estimation command ‘contrasts’ was then used to test linear hypotheses and to form contrasts involving factor variables from all fitted models. Both differences from a reference level (‘r.-operator’ contrasts with non-vegetarians as the reference group) and from the grand mean (‘gw.-operator’, a weighted contrast operator) were tested. Alpha was set to 0.05.
All dietary variables (protein, fat, vitamin A, vitamin B12, zinc, selenium phosphorus, iron and fiber) were then added in a final multivariable regression model to estimate white blood cell counts (and, in separate models, platelet, lymphocyte and neutrophil counts) for the entire sample and for the self-identified vegetarian subsample. All models additionally adjusted for age, sex, race/ethnicity, and smoking status. Jann’s ‘coefplot‘ function was used to plot the regression coefficients of interest [38].


Comments (0)