
Remember me


This study included cell line, tissue, and blood samples to compare the performance of different methylation methods across various sample types. Table 1 presents a general comparison of the different approaches, including the average results of all samples. Generally, the largest DNA inputs are required for ONT. The current DNA input range for WGBS varies from 1 to 500 ng depending on the library preparation method, with traditional pre-bisulfite adapter ligation protocols requiring higher input due to bisulfite-induced degradation, while post-bisulfite adapter tagging (PBAT) protocols minimize DNA loss and enable effective library preparation from as little as one ng of DNA [37]. EM-seq can be performed with a DNA input ranging from 10 to 200 ng. We used 200 ng because testing the effectiveness of low DNA inputs was not our primary interest. Another metric is the turn-around time (TAT), which includes library preparation, sequencing and bioinformatic analyses. The relative TAT for EPIC is significantly lower compared to ONT, WGBS and EM-seq, as the readout takes only approximately 30 min per BeadChip of eight samples, and the bioinformatic pipeline requires fewer resources and is less time-consuming. The library prep, on the other hand, takes two days. Conversely, ONT has the longest TAT because of its longer runtime and the greater number of required resources; consequently, ONT has the longest computing time. Notably, the sequencing coverage between WGBS and EM-seq is comparable, as both methods follow an identical experimental and bioinformatic workflow, differing only in the DNA conversion step. Nanopore sequencing, on the other hand, involves an entirely different chemistry and analysis pipeline, resulting in longer reads and lower sequencing coverage. However, the efficiency of long-read mapping is negatively impacted, as shown in Table 1 (90.8%). Longer reads require a more comprehensive match to align correctly, and if they contain large insertions, deletions, or rearrangements compared with the reference, their alignment can become more challenging. The N1 tier of Google Cloud machines was used throughout all computations. The machines spanned from n1-high CPU-8 to n1-standard-64, depending on the computational needs of each process, to strike a balance between cost and performance. For nanopore basecalling, an Nvidia Tesla T4 graphics processing unit (GPU) accelerator was appended to the virtual machine.
Table 1 Overview of the characteristics of each whole genome and targeted sequencing technologySample and sequencing quality assessmentWe performed quality control of all sequence data generated in this study using the tools mentioned in the Materials and Methods section. The first set of metrics compared between the three whole-genome methods encompasses the quality of raw reads, including base quality and adapter contamination, as well as the effect of trimming on these reads. On average, the libraries generated approximately 1,132.5 million reads for WGBS and 986 million reads for EM-seq across the three samples, with no replicates considered (Table 1). After adapter trimming, quality trimming, and read length filtering, over 91.9% of all reads passed the quality thresholds for WGBS, and 98.9% of all the reads passed the quality thresholds for EM-seq. Generally, the raw base qualities, percentage of reads with adapter contamination, and percentage of bases trimmed are comparable between WGBS and EM-seq. However, this is not applicable for ONT since no filtering steps are performed. Following adapter and quality trimming of the raw reads, except for ONT, the reads were mapped to the human genome (reference genome hg38), and the fraction of aligned read fragments was calculated. WGBS and EM-seq showed optimally aligned reads (99.87% and 99.99%, respectively). ONT constituted a relatively low percentage (90.8%). WGBS and EM-seq, on average, had 9.5% and 7.0% duplicate reads, respectively. For EPIC, the ratio of median intensities was well above 10.5, indicating a good early-quality output. On average, 8.87% of all probes had an arbitrary fluorescence unit (AFU) of ≤ 2000. A total of 3.41% of all probes, on average per sample, had a detection p-value > 0.01. In total, 4,120 probes had a p-value > 0.01 in more than 50% of all samples and were removed from the final probe list. After QC, normalization and filtering of the final β value matrix resulted in 865,455 CpG sites across all samples.
Genomic coverage and annotation of CpG sitesAfter alignment, we assessed the coverage distribution across different genomic regions for each method by mapping the reads to the GRCh38/h38 reference genome and annotating them. WGBS and EM-seq had an average coverage value of 46 × and 41 × , respectively, whereas ONT had an average coverage of 34 × (Table 1). In total, ONT called the most CpG sites at ~ 56 million (for both strands), whereas both WGBS and EM-seq called ~ 54 million CpGs (for both strands), encompassing almost all the CpGs found in the reference human genome, considering both strands [38] (Table 1).
Each method exhibited different genomic coverage (Figure S1). To control for the effect of uneven sequencing depth across the different methods, which is particularly pronounced in WGBS, we downsampled the methylation call sets to a given mean coverage value (Fig. 1), as mentioned in the Materials and Methods. Generally, a minimum of 20 × is considered sufficiently deep to characterize the methylation status of a genomic region accurately. We normalized the methylation call sets to a mean of 29 × coverage per site per strand, as this was the lowest observed coverage, more specifically for the ONT Breast Cancer Cell Line (Figure S1 & S2). This downsampling leads to an expected 14.5 × coverage per strand-specific CpG site, presuming a homogeneous distribution of reads (methylation plots per method calculated on each sample are provided in Figure S5).
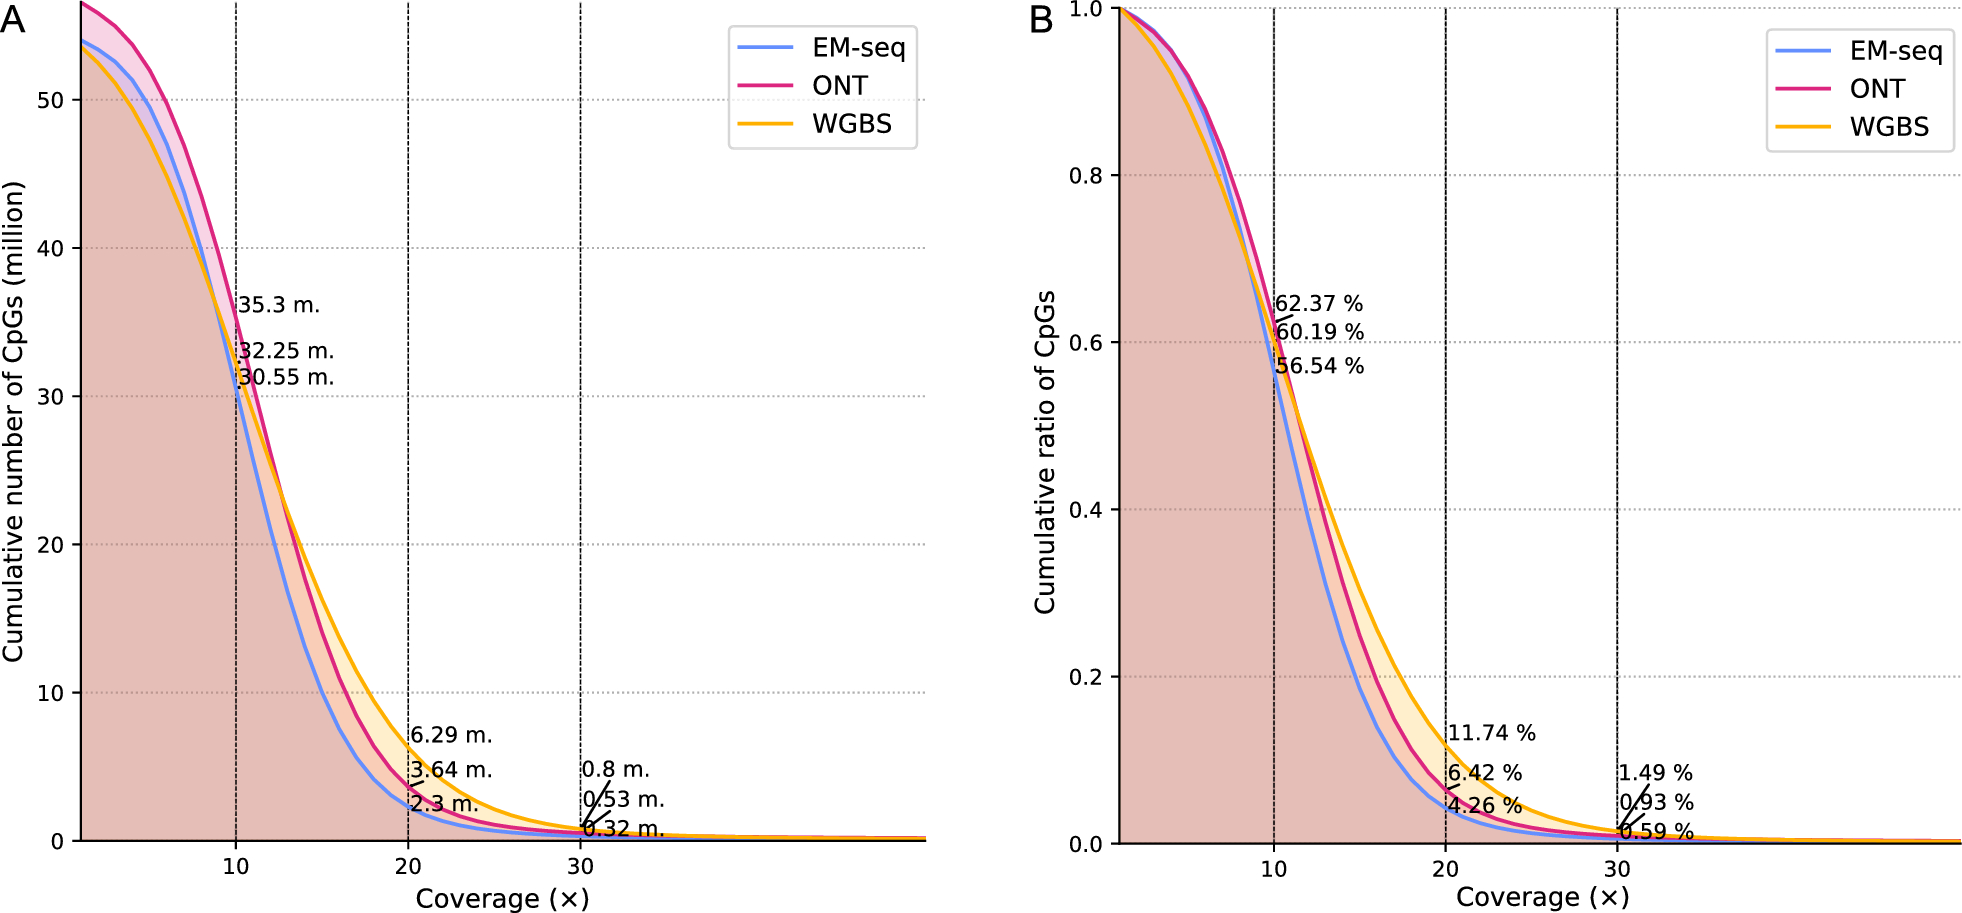
Fig. 1
Empirical cumulative distribution function (ECDF) of CpG reads calculated among the average of all samples. Overall, the cumulative number of CpGs drops with increasing coverage. A Analysis performed after downsampling to 29 × coverage. All methods show a similar trend, with WGBS exhibiting an overall higher relative coverage than ONT and EM-seq. B Analysis performed to show the relative coverage, taking into account the total number of CpGs for each method
We also examined the coverage of CpG islands, CpG shores, CpG shelves, intergenic regions, genes, promoters, 5′ untranslated regions (UTRs), coding sequences (CDs), introns and 3′ UTRs, as well as GC-rich regions (Fig. 2). Overall, WGBS shows a larger spread in overall coverage depth for these regions compared to EM-seq and ONT. This is likely due to the biases introduced during PCR sequencing, which result in differential representation of GC-rich regions. Sequences with high GC content can form secondary structures that are difficult to denature, leading to reduced amplification efficiency compared to sequences with lower GC content [39]. Our experiment involved 13 PCR cycles for WGBS and only 9 PCR cycles for EM-seq. Furthermore, ONT shows higher mean coverage rates for most regions compared to EM-seq and WGBS, with consistent even coverage across all regions. More specifically, at the H19/IGF2 imprinted locus CpG island, only ONT appears suitable for cytosine detection (Fig. 2B). A correlation analysis among the general coverage data across the different methods is shown in Figure S6.
Fig. 2
Violin plot of coverage distribution across different genomic regions. A The coverage is variably distributed in different genomic regions, while ONT appears to cover most of the regions with higher depth than the other methods. B Coverage was observed in specific cancer-related genomic regions. Significance is calculated using one-way ANOVA, indicated with ‘*’ for p = 0.01–0.05, ‘**’ for p = 0.001–0.01, and ‘***’ for p = 0–0.001. It showcases that the assessed methods are significantly different across all considered annotation entities
For a coverage depth greater than 10 × , the total number of CpG sites covered by ONT was 51 million, WGBS covered 44.4 million, EM-seq covered 46.7 million, and EPIC microarrays covered 866 thousand (Figure S3). A total of 5.31 M sites (9.5%) were covered by ONT alone. WGBS and EM-seq detected 622 K (1.1%) and 850 K (1.5%) unique CpG sites, respectively, and even EPIC detected 34.7 K (0.1%) CpG sites that were not captured by the other three methods (Figure S3). A significant overlap is shown between the three whole-genome sequencing methods with 36.2 million common sites. The EPIC microarray results overlapped greatly with those of the other methods, with 722 K sites common to WGBS and 735 K sites common to EM-seq (Figure S3). Interestingly, EPIC has the highest overlap with ONT, with 758 K common CpGs. These results demonstrate that while there is considerable overlap in CpG site detection among the different methods, each method also captures a unique set of CpG sites.
Notably, when intersecting the whole-genome sequencing methods only (Fig. 3), WGBS missed the highest number of sites captured by EM-seq and ONT (5.4 million). Most of these are located in intergenic regions, most likely involving long repetitive regions and tandem repeats (e.g. telomeres). More specifically, WGBS suffers from bisulfite-induced degradation of unmethylated C-rich sequences (e.g., CCCTAA telomeric repeats) [16]. EM-seq and ONT, on the other hand, missed a comparably lower number of sites, at 3.35 and 3.42 million, respectively (Fig. 3).
Fig. 3
Counts and genomic annotations for uniquely missed and covered sites at 10 × coverage. A Sites that have been missed by one method but covered by the others. B Sites that have been covered by one method but missed by the other methods. C Percentage of missed sites in corresponding genomic regions. D Percentage of covered sites in corresponding genomic regions
Among the uniquely covered sites, ONT led with 4.17 million sites, followed by EM-seq with 833 K sites and WGBS with 594 K sites (Fig. 3). Most of the sites are located in intergenic regions that can be easily spanned by long-read sequencing without the need for assembly, thereby capturing more CpGs that may be missed or fragmented by short-read sequencing methods. These results emphasize the extensive genomic coverage provided by ONT compared to EM-seq and WGBS. Although ONT covers intergenic regions extensively, it may also be biased toward regions that are easier to sequence, such as those with fewer repetitive elements or secondary structures. This could explain the higher percentage of missed sites in exons and introns compared to EM-seq and WGBS.
Methylation callingUnlike nanopore sequencing, the bisulfite- and enzyme-based methods distinguish DNA methylation by converting unmethylated cytosines into uracil and thymine during PCR. Therefore, the effective conversion of unmethylated cytosines and the preservation of methylated cytosines determine the accuracy of the methods. WGBS and EM-seq use spike-in controls, such as unmethylated lambda phage DNA and CpG-methylated pUC19 DNA, which aid in determining the effectiveness of the conversion. For pUC19 DNA, NEB claims a CpG methylation conversion efficiency of 96–98%. Our EM-seq analysis demonstrated an efficiency of 99.46% for unmethylated lambda, whereas 97.65% CpG methylation was detected for pUC19. Both values fall within NEB’s range. On the other hand, our WGBS analysis only included unmethylated lambda, with a conversion efficiency of 99.47%, similar to that of EM-seq. Typically, up to 0.5% methylation is detected in unmethylated lambda, indicating an average conversion efficiency of 99.5%.
We assessed the performance of the methods in evaluating methylation calling across different genomic annotations (Fig. 4 and S4), using one-way ANOVA to determine the statistical significance across inter-method variability for each distinct genomic region. Generally, all methods showed higher methylation levels in intergenic regions, gene bodies, coding sequences, and introns and lower methylation levels in CpG islands and promoters, which is consistent with known methylation dynamics (Fig. 4). CpG islands, typically located at gene promoters, usually exhibit relatively low methylation levels, reflecting their active role in gene regulation. However, for the breast cancer cell line, the methylation patterns slightly shifted toward hypermethylation, as opposed to those in colorectal cancer tissue and healthy blood.
Fig. 4
Violin plot showing the methylation value distribution across different genomic regions for each method. Statistical significance is calculated using ANOVA to evaluate inter-method variability within each genomic region, indicated with ‘*’ for p = 0.01–0.05, ‘**’ for p = 0.001–0.01, and ‘***’ for p < 0.001 above the corresponding plot
Correlation analysis of methylation status of CpG sites between methodsWe conducted a correlation analysis among the methylation data to confirm the reliability of methylation calling across the different methods (Fig. 5, S6, S7 and S8). For all samples, very high correlations were observed between the methylation values of EPIC and EM-seq (r = 0.925, Breast Cancer cell line; r = 0.926, Colorectal Cancer tissue; r = 0.935, healthy blood), ONT (r = 0.919, Breast Cancer cell line; r = 0.924, Colorectal Cancer tissue; r = 0.920, healthy blood) and WGBS (r = 0.941, Breast Cancer cell line; r = 0.931, Colorectal Cancer tissue; r = 0.939, healthy blood), respectively (Fig. 5 and S7). EPIC showed a slightly weaker correlation with ONT than EM-seq and WGBS. Interestingly, although only 7,890 CpGs overlap between EPIC and EM-seq (Figure S3), the correlation remains high and similar to that observed between EPIC and WGBS, which share 7,948,614 common CpG sites. This suggests that the Pearson correlation value does not heavily depend on the number of interrogated CpG sites but instead on the consistency of methylation detection across these sites. A few thousand sites might be sufficient to determine a correlation, eliminating the need for millions of sites for correlation analyses. Taken together, these data indicate that methylation calling with ONT and EM-seq produces results comparable to those of WGBS and EPIC. The high correlation underscores their potential as robust methods for analyzing DNA methylation.
Fig. 5
Pairwise correlation in methylation levels between EPIC and other methods, illustrated with density heatmaps and Pearson correlation values for a breast cancer cell line at 10 × coverage. The mean methylation values are displayed on the x- and y-axes, with corresponding distribution histograms shown above the axes. The color intensity is proportional to the correlation value
The density plot (Fig. 6) reveals a bimodal distribution of methylation values, with prominent peaks at the unmethylated (0%) and fully methylated (100%) states. This bimodal pattern is characteristic of DNA methylation data, reflecting regions that are heavily methylated or predominantly unmethylated. The distribution indicates a high level of agreement among EM-seq, WGBS, and ONT in identifying fully unmethylated and methylated CpGs. The EPIC microarray shows a more balanced distribution of methylation values across the scale. This is likely due to the predefined set of probes targeting CpGs, which may include a broader range of methylation levels and result in a less pronounced bimodal distribution.
Fig. 6
Density plot outlining the distribution of methylation values across all methods using the average counts of all samples at 10 × coverage. All methods exhibit the characteristic bimodal methylation distribution, with ONT, EM-seq and WGBS having similar densities. The scale on the x-axis ranges from 0 (no methylation) to 1.0 (100% methylation). EM-seq, WGBS and ONT show a predominance of fully unmethylated and fully methylated cytosines compared to EPIC, where the distribution of methylation values is more balanced along the scale
Agreement between the methodsTo better understand the agreement between the methods in their ability to detect hyper- and hypomethylated CpGs across the entire genome, the profiles of methylated CpGs were visualized by circos heatmaps, as shown in Figure S9. This visualization provides an overview of the methylation patterns at each chromosome. The figure illustrates the concordance between the methods over the entire genome. Specifically, there was a consistent overlap in the identification of hyper- and hypomethylated sites. The agreement in the methylation patterns suggests that when a CpG site is detected as methylated (either hyper- or hypomethylated) by one method, it is generally confirmed by other methods. Conversely, CpGs not detected by one method are typically also undetected by the others, indicating a high level of consistency in the methods’ performance.
Furthermore, to determine the reproducibility of DNA methylation values, the inter-method variability was assessed using Fleiss’ kappa (inter-rater reliability). This metric reflects the degree of agreement between methods, accounting for agreement that would occur by chance. The kappa value was interpreted according to Landis and Koch [40]. Overall, the highest agreement was observed between EM-seq and WGBS (Fig. 7), indicating a strong concordance between methods that use the same sequencing chemistry. Comparisons involving ONT, WGBS and EM-seq showed the second-highest agreement. ONT and EPIC, on the other hand, show the lowest agreement in all samples yet still exhibit a good level of concordance despite employing completely different techniques. All method comparisons fall within the range of 0.65–0.78, indicating a consistent pattern of high concordance among the methods. Moreover, DNA methylation profiles across gene bodies (± 10 kb from TSS to TTS) showed similar trends for all platforms for all samples (Figure S10) suggesting cross-platform concordance in capturing methylation dynamics. This supports the technical comparability of these methods for genome-wide methylation profiling, despite their differing chemistries and resolution.
Fig. 7
Fleiss’ kappa plot showing inter-method agreement analysis. A kappa between 0.01 and 0.20 represents “slight” agreement, a value between 0.21 and 0.40 represents “fair” agreement, a value between 0.41 and 0.60 represents “moderate” agreement, a value between 0.61 and 0.80 represents “substantial” agreement, and a value greater than 0.81 represents “nearly perfect” agreement. All comparisons showed a substantial agreement, with EM-seq and WGBS agreeing the most in paired comparisons, and ONT added to them for the highest agreement in tripled comparisons
Comments (0)