
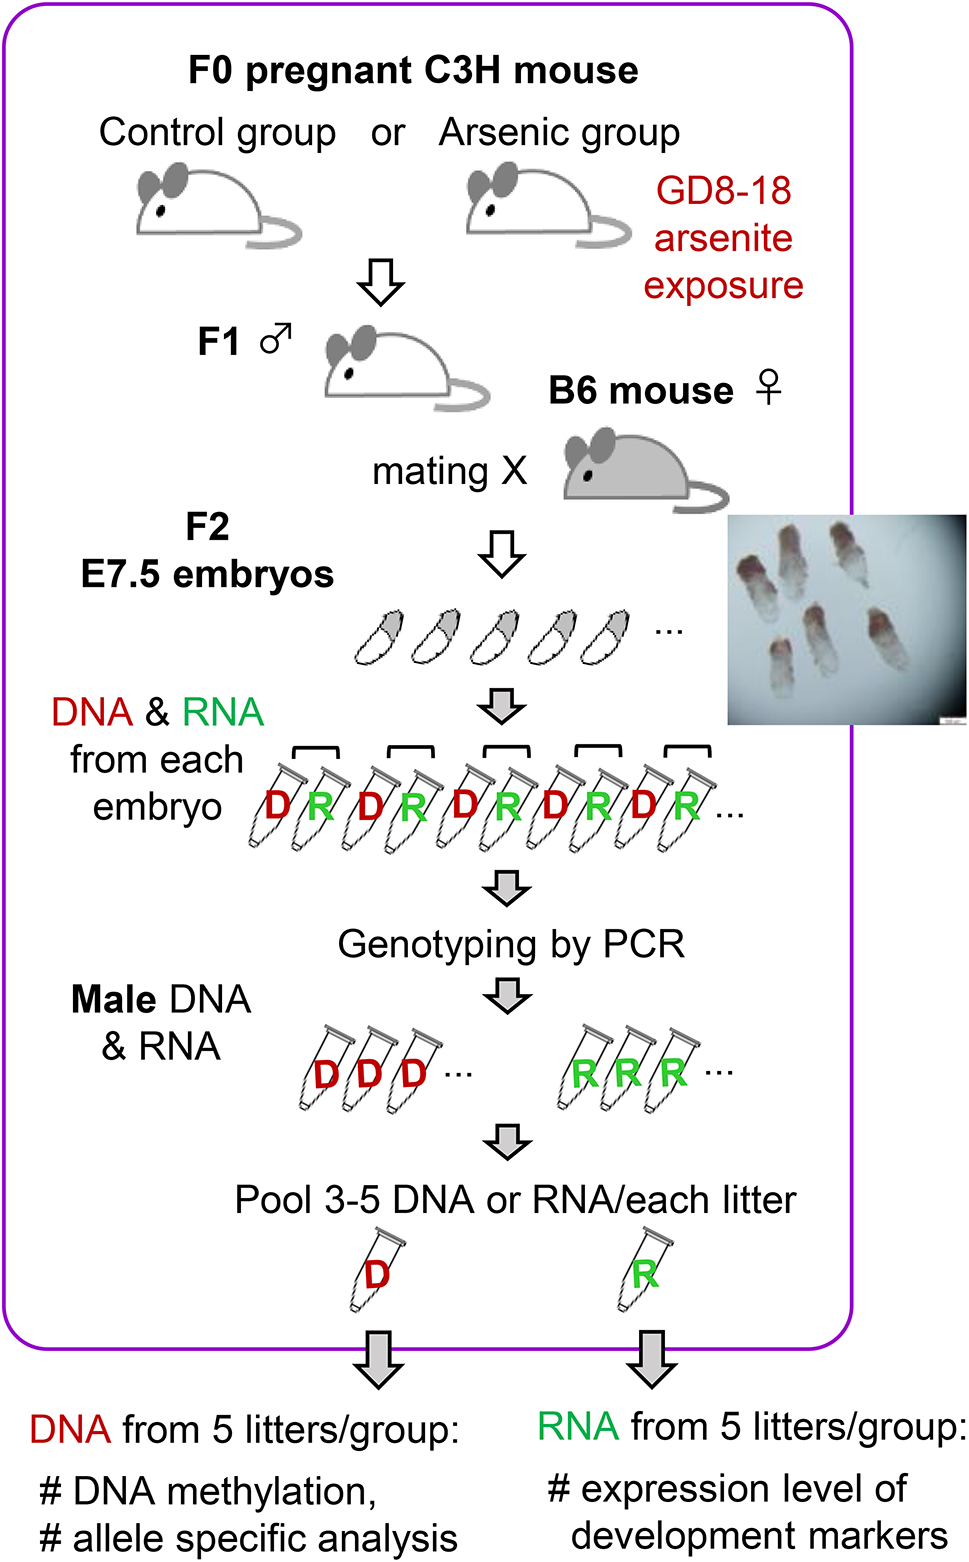
Remember me

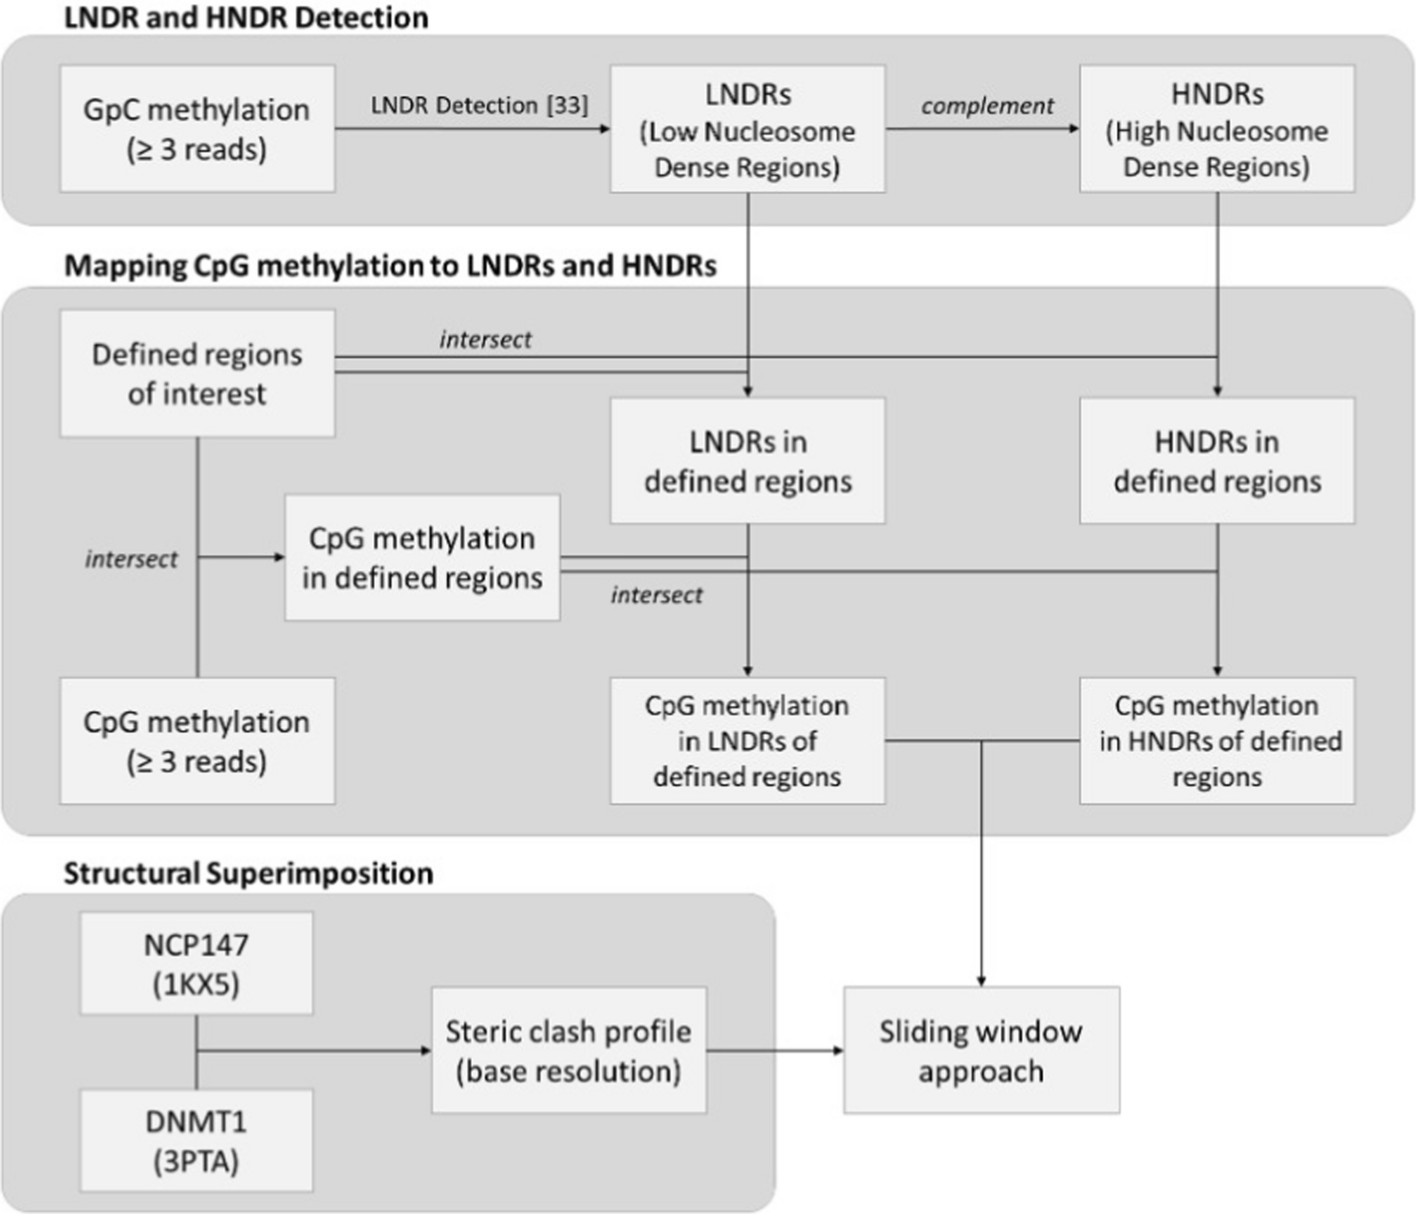


Conducting analysis across chromosomes 1–22, X, and Y, 106,261 promoter regions, 104,611 1st introns (including both start and end positions), and 98,596 2nd introns were identified based on annotations from the human reference genome, GRCh38.p14. Upon processing, cytosines in both GpC and CpG contexts with less than 5 reads of coverage were excluded. The following analysis focuses on transcribed genomic regions and studies how nucleosome architecture and DNA accessibility are connected. Corresponding analyses of non-transcribed regions are presented in the supplemental material and are discussed concisely in the main text.
GpC sites of sufficient read coverage were mapped to four defined genomic regions in order to visualize global nucleosome patterns, as shown in Fig. 4A–D. An elevated 100–[GpC methylation] level corresponds to nucleosome-protected DNA sequences, whereas lower levels indicate a lesser degree of protection. In promoters of transcribed genes, there exists a visible decline in the 100-[GpC methylation] level immediately before the TSS, suggesting a presence of LNDRs. Additionally, a clear nucleosome phasing pattern emerges immediately downstream of the TSS in the promoter region. A similar, yet less defined pattern is observed around the start of the 1st intron, featuring an observable decline around the – 200 bp mark before the start of the 1st intron, with the nucleosome phasing becoming apparent thereafter. Due to the differing dimensions of LNDR stretches between genes, the upstream regions in the 1st intron and promoter exhibit higher average "disorder", resulting in nebulous, less discernable nucleosome phasing, as corroborated by previous results [24]. In contrast, regions at the end of the 1st intron and the start of the 2nd intron reveal a consistent 100-[GpC methylation] level, indicating a general absence of LNDRs in these areas. For comparison, around the promoters of non-expressed genes, 1-GpC methylation levels drop only by approximately 7%, as opposed to 30% for expressed genes; see Figure S1. However, no pattern is visible for the start of the 1st intron.
Figures 4E–H and I–L illustrate distributions of start and end positions from detected HNDRs and LNDRs across all four regions of interest. In the promoter region, most LNDRs arise approximately 200 bp upstream of the TSS and extend to around 100 bp downstream of the TSS, with HNDRs located in complementary positions. This finding aligns with the implications of Fig. 4A and precedent findings [24], supporting the accurate annotation of HNDRs and LNDRs from NOMe-Seq data. A similar pattern is observed around the start of the 1st intron, where most LNDRs originate approximately 400 bp upstream and end at the start of the intron. However, no distinct patterns emerge at the end of the 1st intron and at the start of the 2nd intron, which proves consistent with corresponding average GpC methylation levels shown in Figs. 4C and D.
Fig. 4
To the left, A–D display NOMe–Seq GpC patterns of expressed genes in each of the four regions of interest as average 100–[GpC methylation] levels (percent of unmethylated GpCs). Regions featuring higher nucleosome density than local surroundings (HNDRs) and regions with lower nucleosome density (LNDRs) were derived from the experimental GCH NOMe–Seq data. Middle panels E-H show start/end distributions of respective LNDRs, while to the right, I–L display such values for HNDRs
Fig. 5
CpG methylation pattern for expressed genes in each of the four regions of interest. Experimentally observed CpG patterns (dark grey) are distinct from randomized methylation levels (light grey)
In Fig. 5, the average CpG methylation levels of expressed genes across all four regions can be compared. Methylated CpG positions were identified by assigning the filtered CpG sites to the specified regions, as shown in Fig. 1. In both the promoter regions and the start of the 1st intron, CpG methylation levels decrease as they approach the relative zero position. This reduction is more pronounced for the promoter, from 55% to 15%, than for the start of the 1st intron, from 65% to around 40%. Following this decline towards the TSS, the plot exhibits a small peak at the zero, proceeded by a downstream increase. However, a distinct methylation pattern hallmarks the end of the 1st intron and the start of the 2nd intron. Here, CpG methylation remains constant as it approaches the relative zero position, proceeded by a small jump at the zero position, followed by a slight increase. For comparison, around the promoters of non-expressed genes, CpG methylation levels drop nominally, from around 35% to 25% for the promoters of non-expressed genes, and by approximately 5% for the start of the 1st intron; see figure S2. No pattern is visible for the other two regions of interest.
Structural superimpositionMethylation site classification provides insight into DNA accessibility to proteins: GpC methylation of specific sites reveals areas not protected by nucleosomes or tight-binding proteins [24], while CpG methylation indicates accessibility to DNA methyltransferase. A simple structural in silico approach was implemented such that the X-ray crystallographic structures of a DNMT1-DNA complex were superimposed onto every possible position of DNA wrapped around a histone octamer. Figures 6A and B illustrate two examples of these superimpositions of DNMT for an unpacked DNA-nucleosome complex. In the arrangement shown in Fig. 6A, DNMT1 and the nucleosome exhibit only minor atomic steric overlaps, which could readily be resolved through slight conformational adjustments of the proteins. In contrast, the hypothetical arrangement in Fig. 6B shows significant overlap, such that DNMT1 and the nucleosome "sit" atop each other and generate significant steric effects, rendering this arrangement impossible. Similarly, Figs. 6D and E illustrate two examples of DNMT1 superimposed on the packed DNA-nucleosome complex, with a high overlap and low overlap, respectively. For each aligned nucleosome-DNA position, the extent to which the three-dimensional structure of DNMT1 sterically overlaps with that of the nucleosome was assessed. Figures 6C and F depict the calculated degree of steric clash (%) as an inverse measure of DNA accessibility for each histone octamer-bound DNA position, for the unpacked and packed conformation, respectively. The resulting wave pattern reflects the periodic wrapping of DNA around the nucleosome, closely resembling the aforementioned 10 bp periodicity of CpG methylation levels.
Fig. 6
Estimated degree of steric clashing between DNMT1 and the nucleosome core complex. The top panel depicts superimpositions of DNMT1 with the nucleosome, where DNMT1-bound DNA is mapped to (A) DNA position 3 of the unpacked nucleosome complex, (B) DNA position 8 of the unpacked nucleosome complex, (D) DNA position 61 of the packed nucleosome complex, and (E) DNA position 64 of the packed nucleosome complex. If a DNA binding position is accessible to DNMT1 (i.e. the steric clash is below the critical threshold), the DNA position can be assumed as methylated by DNMT1. In (C) for the unpacked conformation and in (F) for the packed conformation, the y-axis represents the fraction of DNMT1 atoms that sterically overlap with any atom of the nucleosome across different DNA–nucleosome mapping positions, as displayed on the x-axis. In arrangements 3 and 64 of the unpacked and packed conformations, respectively, the DNA can be methylated. In contrast, in arrangements 8 and 61 of the unpacked and packed conformations, the DNA cannot be methylated (C, F). The resulting wave pattern of steric clashes reflects the 10 bp periodicity of double-stranded DNA. The scores for orientations at positions 3, 8, 61, and 64, shown in (A, B, D, and E), respectively, are highlighted by the red circles above. The vertical dashed lines in (C and F) separate the first and second DNA turns around the nucleosome
Correlating methylation levels and structural accessibility modelTo investigate the statistical significance between accessible histone-bound regions and methylated CpG sites, an analysis for both nucleosome conformation models was conducted, examining expressed and non-expressed genes separately, by computing a match-score for every possible sliding window within the regions of interest for both HNDRs and LNDRs. After doing so for both experimental and randomized CpG methylation data, the match scores were compared using p-values derived from a Wilcoxon rank-sum test and effect size, computed by Cohen’s d. Given that the number of CpGs within a sliding window significantly impacts the reliability of the match score, both the effect size and statistical significance were examined as a function of the number of CpGs.
Fig. 7
For 7xib.pdb, matching between methylation data and accessibility scores for HNDR and LNDR regions in expressed promoters. The top two panels show Cohen’s d values, with respect to the number of CpGs in the sliding window, for the packed state in (A) HNDR regions and (B) LNDR regions. Similarly, the bottom two panels show the same analysis for the unpacked state in (C) HNDR regions and (D) LNDR regions
The effect size for experimental and randomized data within HNDRs and LNDRs can be plotted as a function of the number of CpGs within a sliding window across the two nucleosomal packing conditions, as shown for the promoters of expressed genes in Fig. 7. Similar behaviour is observed in other regions; see Supplementary Figures S3-S10. LNDRs are used as a negative control, as it is assumed that these DNA regions are unlikely to be bound by nucleosomes, making all positions equally accessible to DNMTs. Abiding by this hypothesis, a greater effect in HNDRs is expected to be observed in comparison to LNDRs. Cohen’s d values and p-values were calculated across the following ranges: \(m_ \in [0,10,20]\) and \(c_ \in [5,10,20,50]\). Indeed, Cohen’s d values for promoters of expressed genes were clearly more pronounced in HNDR regions (Figs. 7A and C) than in LNDR regions (Figs. 7B and D). Furthermore, stronger effect sizes were detected when HNDR data was mapped to the packed chromatin conformation (Fig. 7C) than for the unpacked chromatin conformation (Fig. 7A). For comparison, Cohen’s d effect sizes were notably lower in the regions of interest for non-expressed genes; see Figures S5-S6 and S9-S10. There, results for HNDR regions were of comparable magnitude to those of LNDR regions. This suggests that neither the unpacked nor packed nucleosome structure fully reflects a representative structural model for genomic regions involving non-expressed genes.
It is observed that Cohen’s d values are highest when \(c_=5\) for expressed genes in both packing conditions, indicating that a CpG position can be methylated if the steric clash between DNMT1 and the nucleosome is below 5%. As the threshold value \(c_\) increases, the effect size decreases; particularly, at high clash values, the effect size can become negative, counterintuitively implying that the matching scores of randomized methylation data were, on average, higher than those of experimental methylation levels. Additionally, the impact of the parameter \(m_ \in [0,10,20]\) on the effect size was less significant than that of \(c_\). Notably, the effect becomes more pronounced when 10 or more CpGs are present in the sliding window. Beyond \(c_=20\), the quantity of datapoints quickly decreases, signifying that Cohen’s d values cannot be reliably computed in this regime; see rightmost panels of Fig. S3-S10. As a result, the Cohen’s d values were calculated for \(c_=5\) and \(m_=0\) for sliding windows containing 10–20 CpGs, as shown in Table 1.
Table 1 Cohen’s d values for HNDRs and LNDRs for \(c_=5\) and \(m_=0\) for sliding windows containing 10 to 20 CpGs, based on accessibilities from 7XIB.pdbAs reflected in Table 1, HNDRs consistently exhibit a stronger effect compared to LNDRs in expressed genes, signifying that in HNDRs of actively transcribed regions, where nucleosomes are present, the DNA methylation pattern aligns with the structural accessibility of DNMT1 around a nucleosome. This difference of effect size across conformations is greatest at the promoter and at the start of the 1st intron, indicating higher concurrence of methylation and DNMT1 accessibility in these regions. This effect is more pronounced in the packed nucleosome complex, suggesting that methylation in HNDRs aligns more closely with the structural accessibility of the packed conformation. In contrast, in LNDR regions for expressed genes, where nucleosomes are assumed to be absent, DNA is more accessible to DNMT1, implying that the DNA methylation pattern does not necessarily correspond to the structural accessibility of DNMT1 around a nucleosome, as reflected by the low Cohen’s d values.
In the regions near the end of the 1st intron and the start of the 2nd intron, łarger effect is observed in both LNDR and HNDR regions; this is likely attributed to the finding that, unlike promoters and the start of the 1st intron whereby some nucleosome patterns are evident, no such patterns are observed (see Figs. 4C and D). In these regions, the average GpC methylation is consistently low, indicating a lack of LNDRs. Additionally, the detected LNDRs are dispersed across these regions (Figs. 4G and H) and do not show pronounced peaks near exon-intron boundaries, with respect to the start of the 1st intron and the TSS. For non-expressed genes with parameters \(c_=5\) and \(m_=0\) (Figures S1 and S2), slightly higher effect sizes were derived in the packed conformation when compared to the unpacked conformation; larger effect size is shown for HNDRs in promoters and the start of the 1st intron, while larger effect for LNDRs is observed at the end of the 1st intron and at the start of the 2nd intron.
Figure S11, as well as Table S3, show significant p-values and Cohen’s d values obtained with PDB structure 3PTA, which features a DNMT1 enzyme bound to a DNA stretch with non-flipped out bases. The trends of these results are highly similar to those obtained using PDB structure 7XIB. Yet, the Cohen’s d values are somewhat smaller when derived from structure 3PTA.
Limitations and implicationsNotably, our study possesses clear limitations in terms of the structural superposition approach used. One of the atomic models employed in this study, a telomeric trinucleosome, is a specialized structure, the relevance of which to general chromatin organization is uncertain. This structure was intended to be representative of a more tightly packed chromosomal state than that of the single-nucleosome structure. Furthermore, the structural superimposition approach simply placed two rigid molecular complexes atop each other. This technique does not allow for intramolecular conformational changes that are often termed induced fit effects. In future work, one may extend this workflow by relaxing superimposed conformations via additional molecular modeling techniques, such as energy minimization or molecular dynamics simulations.
Additionally, steric hindrance is but one factor influencing DNMT1 access to DNA. Steric effects manifested most strongly at the start of the first exon, suggesting high relevance of precise methylation marks at this promoter position, concurring with the current view of transcriptional regulation. The lower correlation observed between nucleosome positioning and DNA methylation at the end of the first intron and at the start of the second intron may reflect that nucleosome positioning is not as precise in these regions, which is also in accordance with the current paradigm. Beyond DNA accessibility, DNMT1 activity is likely modulated by recruitment via specific histone marks, such as H4K20me3 [41] and H3K9me3 [42], via H3Ub2 [43], and by further processes, including dynamic nucleosome sliding, DNMT1 conformational plasticity, chromatin remodeling, histone exchange, and the action of histone chaperones. These processes may collectively modulate steric effects on DNA methylation and influence transient DNA accessibility, potentially differing across genomic regions.
One may question how low GpC methylation levels may impact Cohen’s d: if GpC methylation levels are consistently low, distinguishing between HNDR and LNDR regions becomes unclear. Our approach focuses on the analysis of CpG levels in HNDR regions; if HNDR regions are “diluted” by additional false-positive LNDR regions, this would limit the ability of our approach to detect nucleosome phasing patterns and effects of the 10-bp periodicity of DNA, such as the preferred CpG methylation in outward-facing positions, resulting in less significant Cohen’s d values. In LNDR regions, our analysis still identified statistically significant results in the same direction as HNDR regions, however with smaller Cohen’s d values; see Supplement. Hence, it is believed that analyzing data with low GpC levels will not lead to erroneous detection of false effects, but would rather lower the significance of existing methylation patterns.
In principle, the activity of DNMT1 is tightly linked to the cell cycle. If there exists a timepoint during the cell cycle at which DNMT1 could freely methylate DNA unbound from nucleosomes, it appears unlikely as to why this would result in a pronounced 10-bp phasing pattern at the promoter and start of the 1st intron. Caron et al. [44] studied proliferation of human B cells into plasma cells and determined that this proliferation was linked to a slight decrease in DNA methylation levels, followed by a committal step in which an S phase-synchronized differentiation switch was associated with extensive DNA demethylation, as well as local acquisition of 5-hydroxymethylcytosine at enhancers and plasma cell-specific genes. Only marginal effect was attributed to cell cycle shifts, with stronger DNA methylation changes upon differentiation. Vandiver et al. [45] analyzed dermal fibroblasts in the G0, G1, and G2 phases and detected no global changes or large-scale hypomethylated blocks in any of the examined cell cycle phases. These findings argue against the relevance of cell-cycle dependent effects on the detected phasing effects of DNA methylation.
Comparing the data to the current understanding of chromatin structure, it has been observed in both H. sapiens and A. thaliana that nucleosomal DNA displays a 10-bp periodicity of methylated CpG sites, validating the periodicity observed in Figs. 6C and F. [22, 23, 46] Notably, some region-specific methylation patterns are implied in exon-intron boundaries. [47] The observed deficit in LNDRs near exon-intron boundaries matches findings indicating that exons possess higher degrees of methylation than introns, as well as increased nucleosome occupancy. [22, 23, 48, 49] Within an expressed gene, methylation "context" is needed: methylation at promoters impedes transcription and is implied in long-term silencing, whereas methylation within the gene body may elongate transcription and influence splicing. [50] Thus, in expressed regions, lower GpC and CpG methylation at the promoter and a greater presence of LNDRs before the TSS facilitate active transcription. Moreover, observed methylation patterns downstream of the promoter may play a regulatory role. Upon transcription, RNA Polymerase II preferentially binds to exons; nucleosome positioning at exon-intron boundaries may regulate RNA Polymerase II efficiency, enhancing splicing accuracy of upstream introns and mitigating exon skipping. [22] Differential DNA methylation within genes may drive exon definition and alternative promoter usage. [51]
Determining whether the observed correlations between accessibility and methylation are cell-type-specific or conserved across tissues or species, Salhab et al. [52] compared the DNA methylation landscape of primary human hepatocytes (PHH) to liver cancer tissue and hepatocellular carcinoma cell lines (HepaRG and HepG2). Notably, the methylome of primary liver cancer retained a pattern of partially methylated domains (PMDs) highly similar to primary cells. PMDs in cancer tissue display a mild, yet clearly reduced level of methylation. However, in cancer cell lines, the DNA methylation in PHH-specific PMDs is strongly decreased. In particular, the most significant changes were observed in gene-poor regions, whereas in gene-rich regions, DNA methylation and expression levels remained correlated. It is plausible that the nucleosome phasing pattern identified at promoters and at the start of the 1st intron are quite general in human cell types. The connection between DNA accessibility and methylation patterns should be generalizable for human cell types, and possibly for other mammalian species.
Moreover, the workflow introduced in this study can potentially be used in combination with other methodologies (e.g. ATAC-Seq), as well as with data on other DNA-binding proteins, such as pioneer transcription factors.
Comments (0)