
Remember me
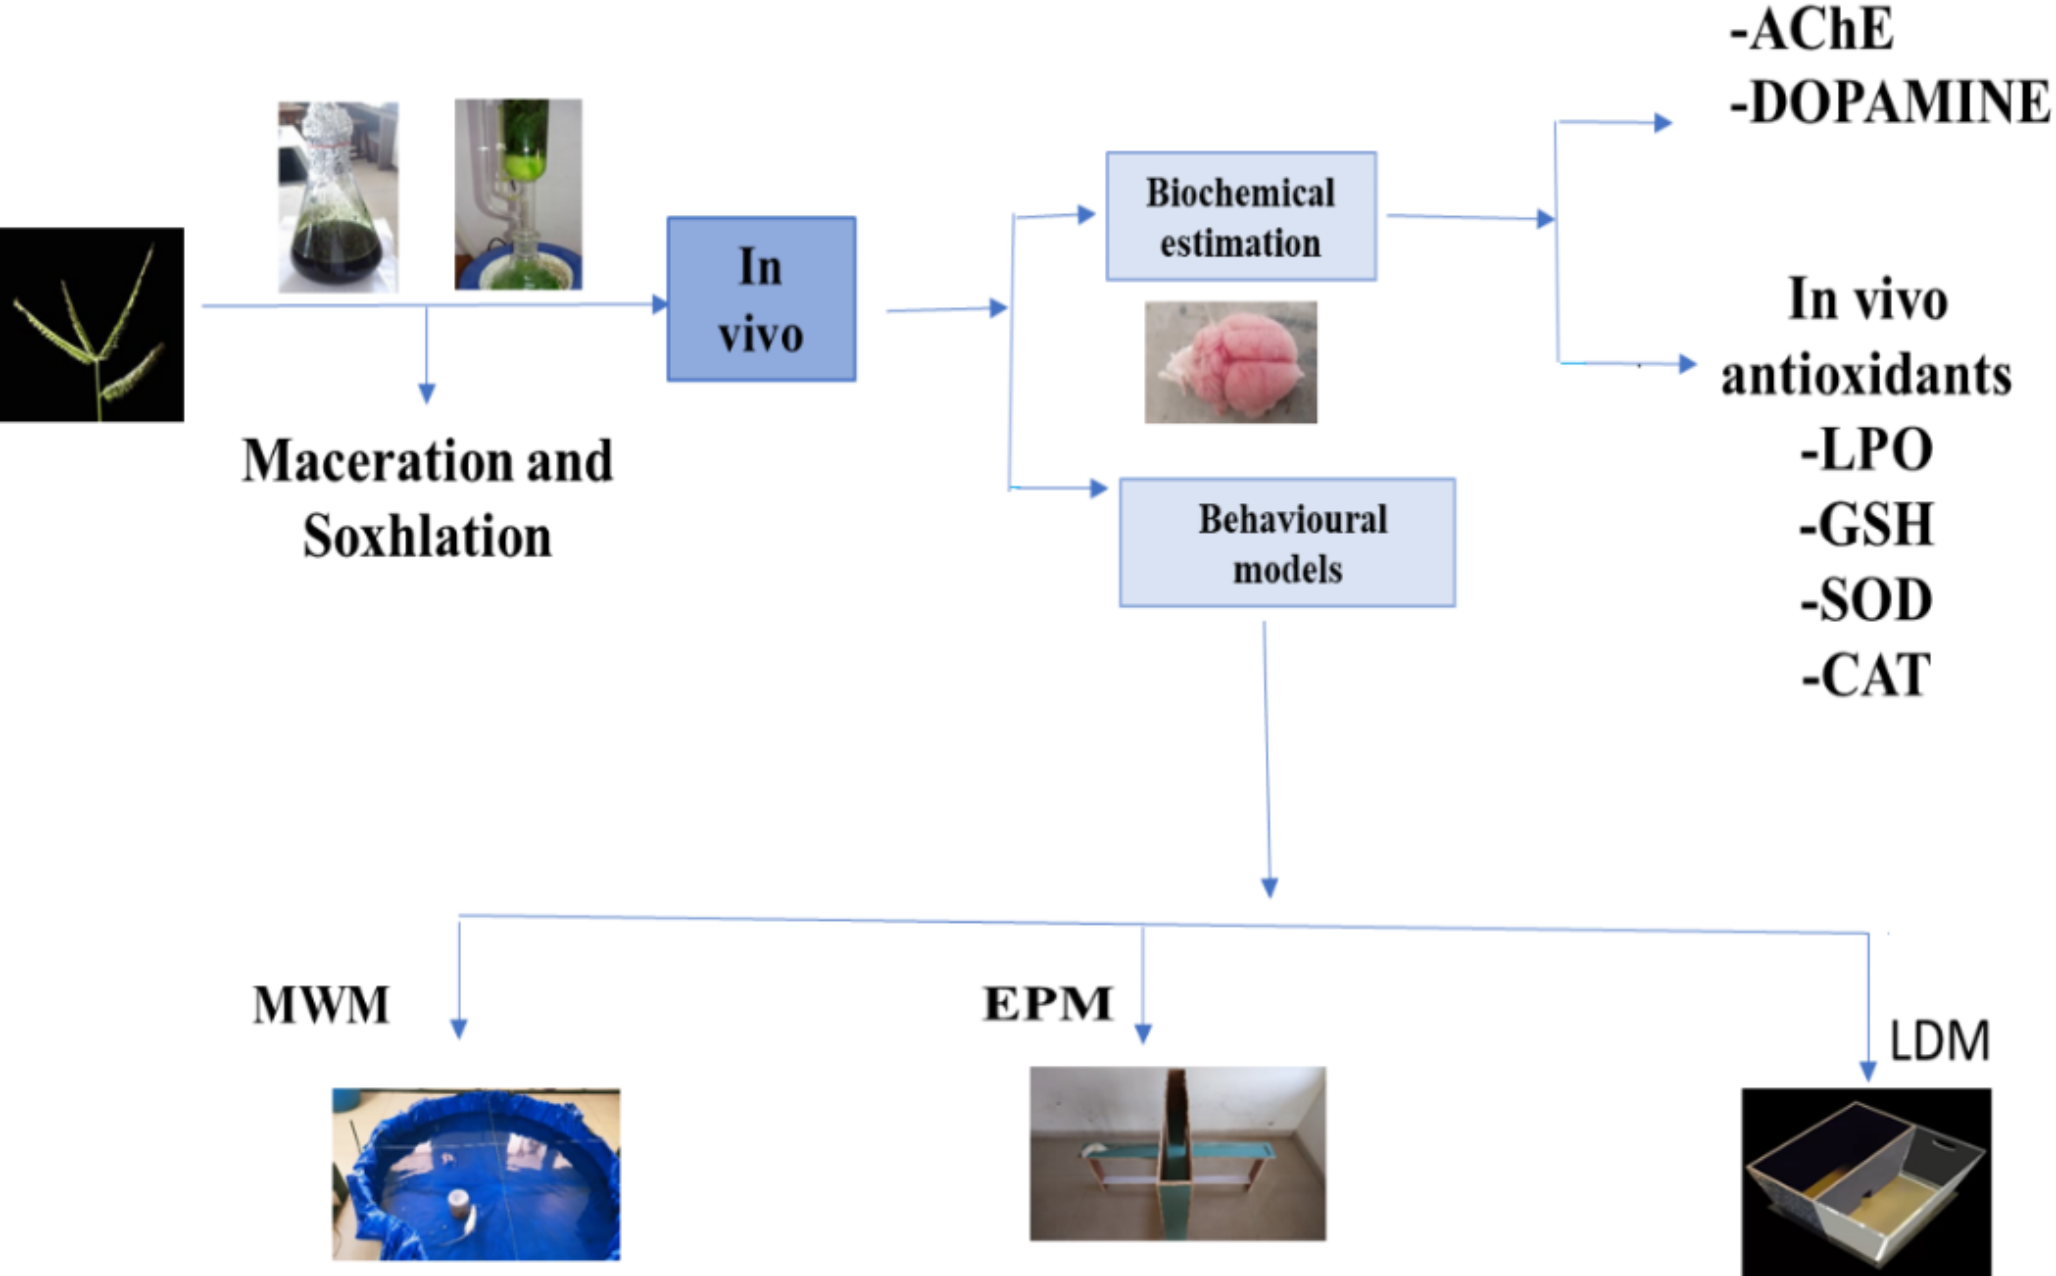

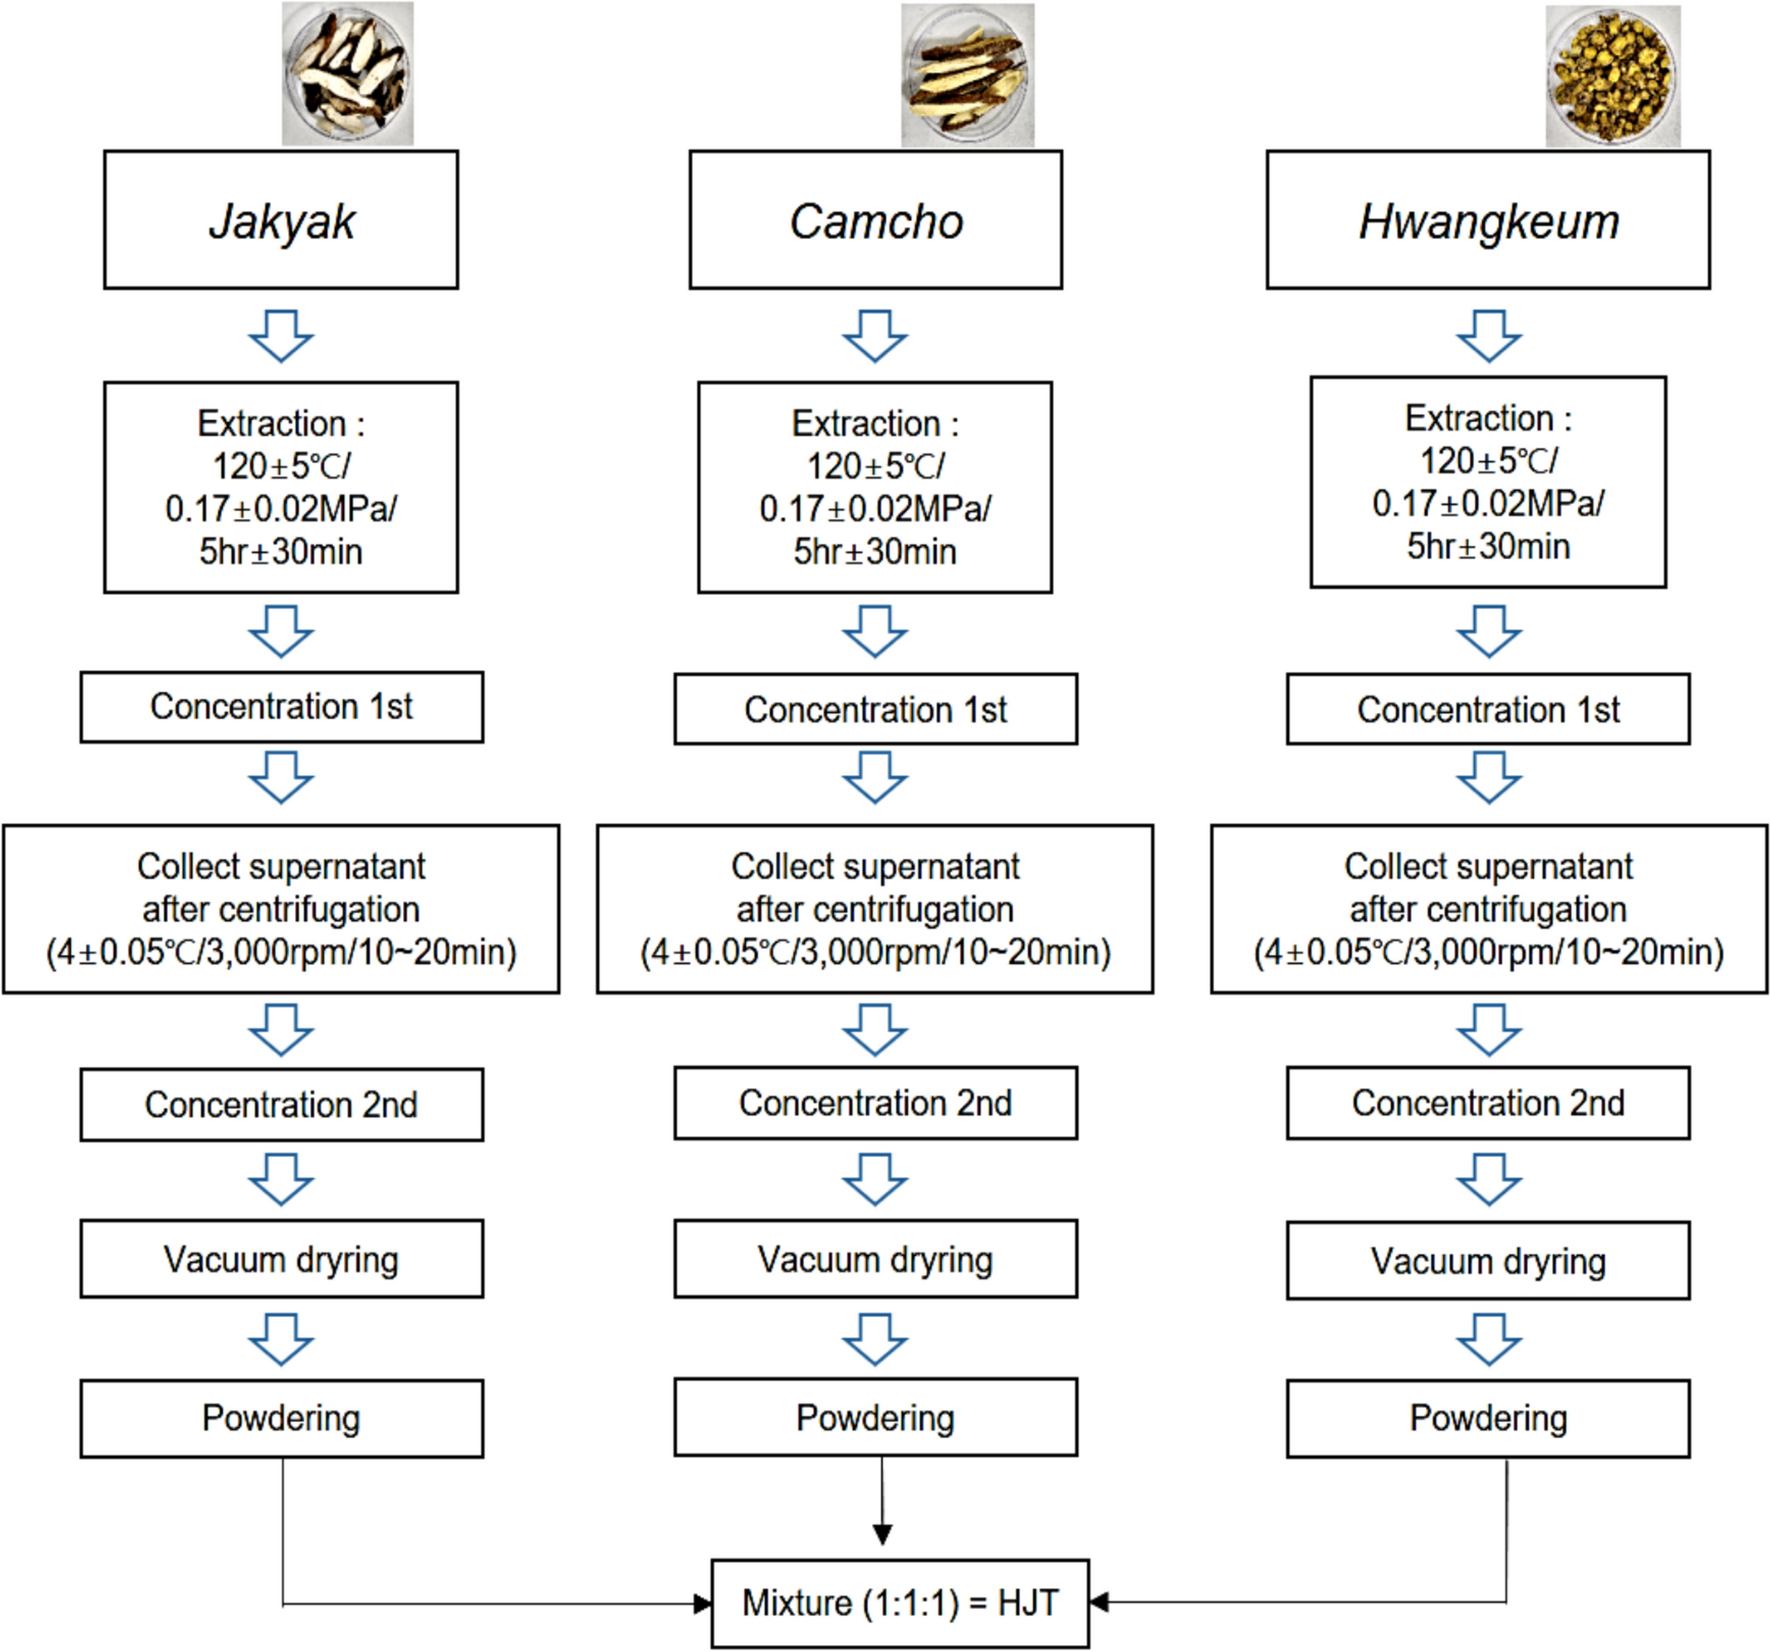


Jakyak (Paeonia Lectiflora, Korea), camcho (Glycyrrhizae radix, China), and Hwangkeum (Scutellaria baicalensis, China) were used. The herbal materials were purchased from Bonchowon (Yeongcheon, Korea). Each herbal powder was extracted with water, concentrated, and vacuum-dried. The ratio formulation of HJT according to Donguibogam was used and the resulting mixture was dissolved in solvents (DMSO or water) for in vivo and in vitro experiments (Fig. 1). In a previous paper, we identified marker compounds contents of HJT through the HPLC method (Youn et al. 2023). It was confirmed that HJT contains the marker compounds contents of Jakyak (Paeonia Lectiflora), camcho (Glycyrrhizae radix), and Hwangkeum (Scutellaria baicalensis).
Fig. 1
Hwangkeumjakyak-tang (HJT) manufacturing process
2-diphenyl-1-picrylhydrazyl (DPPH) and 2,2′-azinobis-(3-ethylbenzothiazoline-6-sulfonic acid) (ABTS) radical scavenging activity assayDPPH and ABTS radical scavenging activity assays were performed, as previously described (Yang et al. 2022). Briefly, for the DPPH assay, 200 μL of each concentration sample and 800 μL of 0.5 mM DPPH reagent were mixed, vortexed, and allowed to react in the dark for 15 min. The absorbance was measured at 517 nm using a Biotek Synergy HT multi-detection microplate reader (BioTek, Charlotte, VT, USA). Each sample was analyzed thrice to obtain an average value, and ascorbic acid was used as a positive control. For the ABTS radical scavenging activity assay, 7 mM ABTS (2,2'-azino-bis [3-ethylbenzothiazoline-6-sulfonic acid] diammonium salt) was mixed with an equal volume of 2.45 mM potassium persulfate, and the mixture was allowed to react in the dark for 18 h to form the ABTS radical. The ABTS radical solution was diluted with distilled water, and the absorbance value at 730 nm was adjusted to 0.90 ± 0.02. A total of 200 μL for each concentration sample. Then, 1000 μL of ABTS radical solution was mixed with the sample, vortexed, and allowed to react in the dark for 15 min. Absorbance was measured at 730 nm using a Biotek Synergy HT multi-detection microplate reader (BioTek). The radical scavenging activity of each solution was calculated using the following equation and expressed as a percentage: radical scavenging activity (%) = (Abscontrol–Abssample)/Abscontrol × 100, where Abscontrol is the absorbance of the MeOH control and Abssample is the absorbance in the presence of HJT.
Total phenol and flavonoid contentsTotal polyphenol content (TPC) and total flavonoid content (TFC) assays were performed as previously described (Lee et al. 2023). Briefly, 500 μL of 1 mg/mL sample, 500 μL of 0.2 M Folin-Ciocalteu's phenol reagent, and 500 μL of 2% sodium carbonate were mixed, vortexed, and allowed to react in the dark for 30 min. Absorbance was measured at 750 nm using a Biotek Synergy HT multi-detection microplate reader. TPC was expressed as mg/g of gallic acid equivalent (GAE) based on the calibration curve using the following equation: y = 8.4755x + 0.1105, R2 = 0.9779, where x is the absorbance and y is the GAE (mg/g).
For the TFC assay, 500 μL of 1 mg/mL sample, 100 μL of 10% aluminum chloride, 100 μL of 1 M potassium acetate, 1.5 mL of MeOH, and 2.8 mL of distilled water were mixed, vortexed, and allowed to react in the dark for 40 min. Absorbance was measured at 415 nm using a Biotek Synergy HT multi-detection microplate reader. TFC was expressed as mg/g of quercetin equivalent (QUE) based on the calibration curve using the following equation: y = 3.1736x + 0.0397, R2 = 0.9998, where x is the absorbance and y is QUE (mg/g).
High-performance liquid chromatography (HPLC)HJT was quantitatively analyzed using HPLC–DAD (SPD-20A, SHIMADZU Co., Japan). Ten standards (gallic acid, catechin, (-)-epicatechin, vanillic acid, naringin, ethyl gallate, p-coumaric acid, ferulic acid, benzoic acid, quercetin, naringenin, kaempferol, and 4-hydroxybenzoic acid) were selected for the experiment, and the HPLC analysis conditions were as follows—column: Shimpack GIS-ODS (C18, 4.6 × 250 mm, 5.0 μm; Shimadzu Co., Kyoto, Japan); flow rate: 0.7 mL/min; temperature: 30 ℃; injection volume: 20 μL; and UV detector wavelength: 280 nm. For the mobile phases, 0.1% acetic acid in water (solvent A) and 0.1% acetic acid in methanol (solvent B) were used. The gradient conditions of the mobile phase were 0 min: B (10%), 0–5 min: B (10%), 5–15 min: B (40%), 15–45 min: B (60%), 45–55 min: B (80%), 55–60 min: B (100%), 60–65 min: B (10%), and 65–70 min: B (10%). The injection volume was 20 μL. All samples used for analysis were filtered with a 0.45 µm filter.
Phenolic compounds identified in HJT quantified using LC–MS/MSLiquid chromatography-mass spectrometry (LC–MS/MS) analysis was performed using an AB SCIEX 4000 Q Trap LC/MS/MS System (Shimadzu LC 20A System, Kyoto, Japan). Water (in 0.1% formic acid, solvent A) was used as the mobile phase under the analysis conditions, whereas acetonitrile (in 0.1% formic acid, solvent B) was used under isocratic conditions (35% B). Using Turbo Ion Spray, the analytical conditions of MS/MS were examined in both negative and positive modes.
Cell cultureHepG2 cells, obtained from American Type Culture Collection (Manassas, VA, USA), were maintained in Dulbecco’s modified Eagle medium containing 50 U/m; penicillin/streptomycin and 10% fetal bovine serum at 37 °C under 5% CO2 in a humidified atmosphere.
Plasmid construction and luciferase assayThe NQO1–ARE luciferase construct was constructed using a PCR-based method as previously reported (Yang et al. 2020a, b). To assess transactivation by HJT, NQO1-ARE luciferase activity was measured in the lysates of HepG2 cells transfected with the NQO1-ARE luciferase construct and exposed to HJT for 12 h. Firefly luciferase activity was measured using the Luciferase Assay Reagent II (Promega, Madison, WI, USA) according to the manufacturer's instructions.
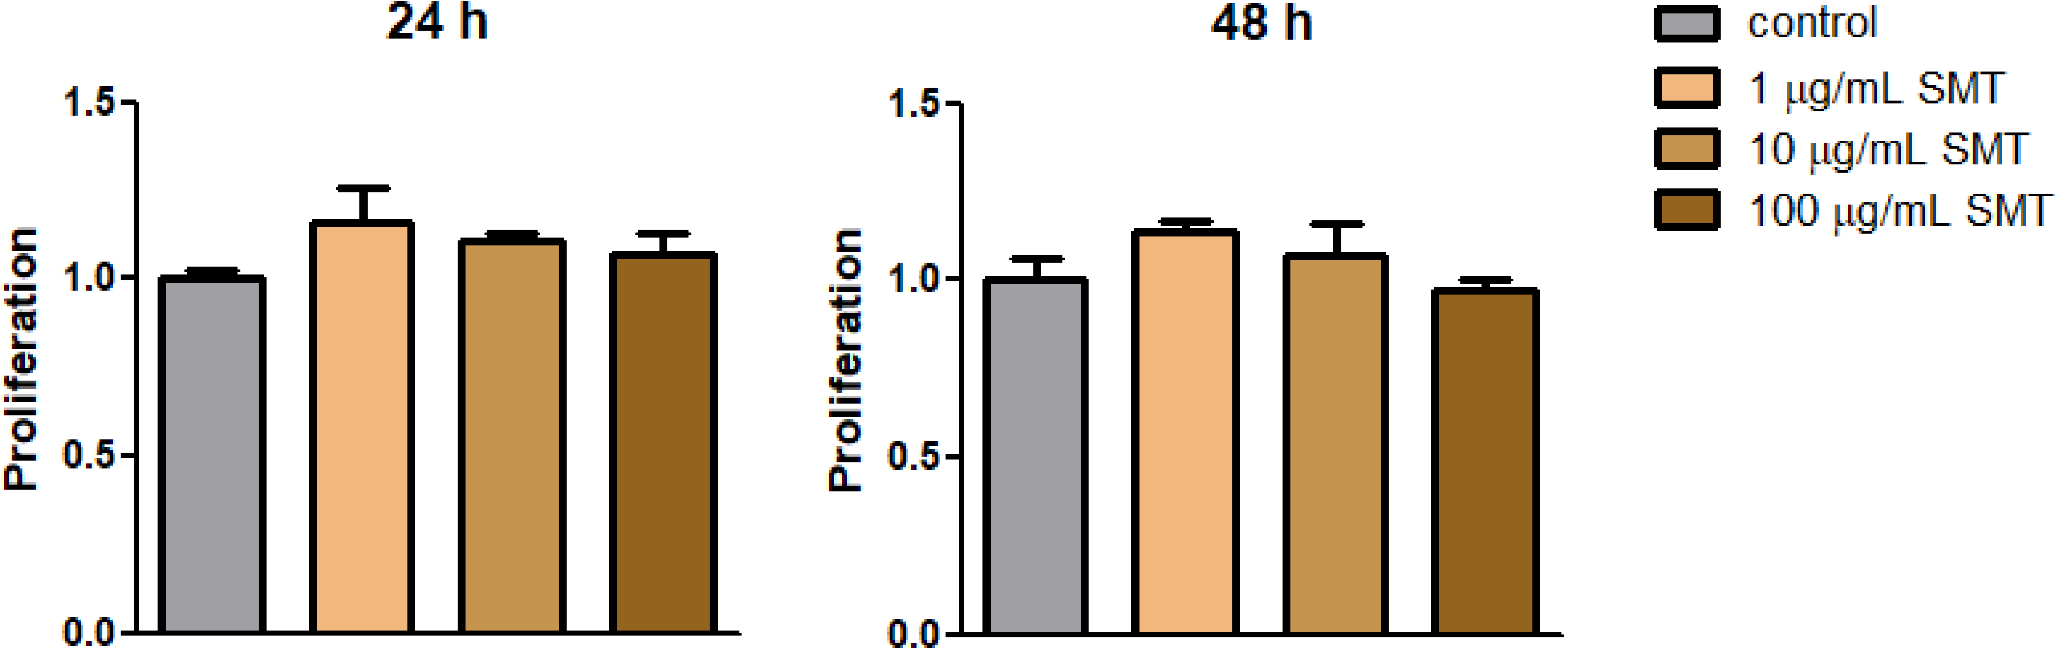
MTT assayTo measure cell viability, cells were plated in 48-well plates and treated for 24 h. Viable cells were then stained using 0.2 mg/mL MTT for 4 h. The MTT assay kit was purchased from Sigma-Aldrich (St. Louis, MO, USA). The media were then removed, and formazan crystals produced in the wells were dissolved using 200 μL dimethyl sulfoxide. The absorbance at 540 nm was measured using a microplate reader (Spectramax; Molecular Devices, San Jose, CA, USA). Cell viability was calculated relative to the untreated control as follows: viability (% control) = 100 × (absorbance of the treated sample)/(absorbance of the control).
Measurement of ROS generationDiacetyldichlorofluorescein (DCFH-DA) was purchased from Sigma-Aldrich. After treatment with 500 µM tert-butyl hydroperoxide (t-BHP) for 3 h, HepG2 cells were stained with 10 µM DCFH-DA for 30 min at 37 °C. H2O2 generation was determined by measuring the fluorescence intensity of dichlorofluorescein using a fluorescence microscope (Zeiss, Jena, Germany) or fluorescence microplate reader (Jemini; Molecular Devices) with excitation and emission wavelengths of 485 and 530 nm, respectively.
Immunoblot analysisProtein extraction, subcellular fractionation, sodium dodecyl sulfate–polyacrylamide gel electrophoresis, and immunoblotting were performed as described previously (Cho et al. 2021). Briefly, the samples were separated using 7.5% polyacrylamide gel and transferred onto a nitrocellulose membrane. The membrane was incubated with the indicated primary antibodies, followed by horseradish peroxidase-conjugated secondary antibodies. The immunoreactive proteins were visualized using an ECL chemiluminescence detection kit (Amersham Biosciences, Buckinghamshire, UK). The following antibodies were used in the experiment: Antibodies against Nrf2, phospho-Nrf2, Bcl-xL, and PARP were purchased from Santa Cruz Biotechnology (Santa Cruz, CA, USA). Antibodies against NQO1, lamin A/C, and caspase-3 were obtained from Cell Signaling Technology (Danvers, MA, USA). GCL and Bad antibodies were obtained from Abcam (Cambridge, UK) and BD Biosciences (Franklin Lakes, NJ, USA), respectively. Equal protein loading and the integrity of subcellular fractionation were verified by β-actin expression in immunoblots.
Animals and treatmentMale ICR mice (6 weeks old) were provided by Oriental Bio (Sung-nam, Korea) and acclimatized for 1 week. Mice (N = 10/group) were housed at 20 ± 2 °C with 12 h light/dark cycles and relative humidity of 50 ± 5% under filtered, pathogen-free air, with food (Purina, Korea) and water available ad libitum. HJT (100–300 mg/kg) was orally administered to mice for 7 days. Before euthanasia, liver injury was induced by intraperitoneal injection of APAP (300 mg/kg) for 24 h. Fasting or malnutrition is considered as a risk factor for acetaminophen-induced hepatotoxicity (Kalsi et al. 2011). So, before acetaminophen administration, we fasted mice for 12 h.
Blood chemistry, histopathology, and immunohistochemistryPlasma alanine aminotransferase (ALT) and aspartate aminotransferase (AST) levels in mice serum were measured using commercial kits (Asan Pharmaceutical, Seoul, Korea). Liver tissue samples were fixed in 10% neutral buffered formalin, embedded in paraffin wax, and cut into 3 μm thick sections, which were stained with H&E for routine examination. To evaluate histopathological changes, the stained tissue samples were examined under a light microscope (Zeiss). An arbitrary scope was applied to each microscopic field viewed at magnifications of × 40–200. At least five fields were scored per liver section to obtain mean values. The expression and localization of 4-HNE in the liver were detected using immunohistochemical staining. Briefly, deparaffinized tissue sections were incubated with monoclonal anti-4-HNE antibody (R&D Systems, Minneapolis, MN, USA). Stained sections were examined using a Motic Easyscan Digital Slide Scanner (Motic, Hong Kong, China). The staining intensity in five randomly selected microscopic fields was quantified using ImageJ software (NIH, Bethesda, MD, USA).
Determination of reduced GSH content in cells and the liverThe GSH content in the cells was quantified using a commercial GSH determination kit (Cayman Chemical, Ann Arbor, MI, USA) as previously described (Cho et al. 2022). Briefly, HepG2 cells were plated in 6-well dishes and treated with HJT for 12 h and then lysed in a buffer containing 5% metaphosphoric acid to precipitate proteins. The cell lysates were centrifuged at 10,000× g for 10 min, and the supernatants were used to measure GSH concentrations according to the manufacturer's instructions. The absorbance was measured at 410 nm using a microplate reader.
Glutathione content in the liver tissue was quantified using a commercially available GSH determination kit (BIOXYTECH GSH-400; Oxis International, Portland, OR, USA) as previously described34.
Fecal microbiome analysisFecal samples were collected on the final day of the experiment. The AccuFAST automation system (AccuGene Inc., Incheon, Korea) was used to extract DNA from the samples according to the manufacturer's instructions. The V3-V4 hypervariable region of the 16S rRNA gene was amplified for microbial community analysis. Quality control and analysis of microbiome sequencing data were performed using the Quantitative Insights into Microbial Ecology (QIIME2) pipeline. Amplicon sequence variants were classified using the SILVA database (version 138). The α-diversity (Shannon, Simpson, and ACE) and β-diversity (unweighted UniFrac) were analyzed according to the QIIME. Microbial composition graphs were constructed using the R software package. The α-diversity plots were created using GraphPad Prism 8 (GraphPad Software, Inc., San Diego, CA, USA), and principal coordinate analysis (PCoA) plots were created using the free Plotly Make Chart program (https://chart-studio.plotl y.com/create/#/). The sequencing reads were deposited in the short-read archive of NCBI under the accession number PRJNA989272.
Metabolite analysisThe sample preparation protocol for gas chromatography (GC)/MS analysis was conducted as follows. 300 μL of methanol (methanol:water [7:3]) was added to 100 μL of serum or freeze-dried fecal sample (100 mg) and then vigorously extracted. After centrifugation, the supernatant was dried, methoxylated, and trimethylsilylated. To minimize systematic variation, all samples were detected in random order. For detection, the derived sample (600 μL) was injected into a Rtx-5MS fused silica capillary column (30 m × 0.25 mm ID; J&W Scientific, Folsom, CA, USA) using a split model (1:10) in a Shimadzu QP2020 GC/MS system (Shimadzu). The initial temperature of the GC oven was programmed at 60 °C for 1 min, then increased to 300 °C at a rate of 10 °C/min and maintained for 10 min. The MS was operated in full-scan mode in the m/z range of 50–600. The injector, ion source, and transfer-line temperatures were maintained at 250, 230, and 280 °C, respectively. The ionization energy in electron impact ionization (EI) mode was set at 70 eV. The GC/MS data were pre-processed using the XCMS software (https://xcmsonline.scripps.edu) for noise reduction, baseline correction, and alignment. The peak intensities of the obtained features were normalized against an internal standard (methyl stearate) before performing the multivariate analyses. For multivariate analyses, the GC/MS data files were imported into SIMCA-P 15.0 software (Umetrics, Umea, Sweden). Statistical analyses were performed using GraphPad Prism version 6. The metabolites were identified by comparing their mass spectra with those of NIST 14.0.
Statistical analysisOne-way analysis of variance was used to assess the statistical significance of differences between treatment groups. The Newman–Keul test was used to determine the significance of differences between the means of multiple groups. Results are expressed as mean ± S.E.
Comments (0)