
Remember me
All animal procedures were approved by the Stanford University Administrative Panel on Laboratory Animal Care and the Institutional Animal Care and Use Committee (IACUC; 34760) in accordance with American Veterinary Medical Association guidelines and the International Association for the Study of Pain. All mice were housed 2–5 per cage maintained on a 12-hour light/dark cycle in a temperature-controlled environment (temperature: 68–74 °F; humidity: 30–70%) with ad libitum access to food and water. Young male and female mice used were 11–16 weeks old, wild-type C57BL/6J mice (The Jackson Laboratory, stock no. 00664). Aged male and female mice used were 20–24 months-old, wild-type C57BL/6JN mice (NIA Aged Rodent Colony). We did not note any sex differences in the expression of senescence markers and, therefore, combined male and female DRG throughout all analyses. Aged mice were pre-screened for abnormal masses and cataracts and were included in the study only if they appeared healthy.
Human samplesUse of human postmortem DRG received human subjects exemption from the Stanford University Institutional Review Board. Human postmortem DRG were obtained in collaboration with Donor Network West. Human lumbar L4 DRG tissues were obtained from two young female donors (age 32 years and 33 years) and two aged donors, one male and one female (both age 65 years). All patients died from stroke or head trauma.
SNITo perform SNI surgery60, mice were anesthetized with isoflurane, and a small incision was made over the left thigh. Blunt dissection was performed through the biceps femoris muscle to expose the sciatic nerve and its three branches (common peroneal, tibial and sural nerves). The common peroneal and tibial nerves were then ligated using an 5-0 nylon suture (Ethilon, ref. no. 1668G), and these nerves were then axotomized using small-sized spring scissors. The sural nerve was left intact (the ‘spared nerve’). The incision was closed with surgical staples. After surgery, mice were monitored for the study period, which varies from 1 day to 16 weeks depending on the timepoint of interest. Controls used for qPCR experiments were sham surgery in which an incision was made followed by opening of muscle to reveal the nerve, without touching the nerve, followed by closure.
Senolytic administrationABT263 (Navitoclax) (MedChemExpress, catalogue number HY-10087) was dissolved in 60% Phosol40PG, 30% PEG400 and 10% ethanol (EtOH) at a concentration of 12.5 mg ml−1 using brief water bath sonication and vortexing. Young and aged mice were briefly anesthetized with isoflurane before they were dosed by oral gavage at 100 mg kg−1 daily for 5 days, with a 2-day rest period, followed by a second 5-day daily dosing.
qPCRWhole DRG were collected, homogenized using a 1-ml glass homogenizer (PYREX, catalogue number 7724-1) and placed in TRIzol reagent (Invitrogen, cat. no., 15596018). RNA was isolated using miRNeasy Mini kit (Qiagen, cat. no. 217004). The concentration and purity of RNA samples were determined using a NanoDrop 2000 (Thermo Fisher Scientific). RNA was reverse transcribed using a SuperScript VILO cDNA Synthesis Kit (cat. no. 11754-050). qPCR analysis was performed with PowerUp SYBR Green Master Mix (Thermo Fisher Scientific, cat. no. A25741) and run on an Applied Biosystems 7900HT or on an Applied Biosystems StepOnePlus. Appropriate no-reverse-transcriptase and no-template controls were used for each 384-well PCR reaction. The cycle conditions were as follows: 50 °C for 2 minutes, 95 °C for 2 minutes and then 40 cycles of 15 seconds at 95 °C and 1 minute at 60 °C. Dissociation analysis was performed at the end of each run to ensure specificity. qPCR primers used included: p21 F: 5′-GTGAGGAGGAGCATGAATGGA-3′, R: 5′-GCACCTTTTATTCTGCTGGCAA-3′; p16 F: 5′-GTGTGCATGACGTGCGG-3′, R: 5′-CACCTGAATCGGGGTACGAC-3′; p53 (Trp53) F: 5′-TCATCCCTCCCCTTTTCTGTC-3′, R: 5′-ATGGCGGGAAGTAGACTGGC-3′; Il6 F: 5′-GCTACCAAACTGGATATAATCAGGA-3′, R: 5′-CCAGGTAGCTATGGTACTCCAGAA-3′; Ccl2 F: 5′-AGCACCAGCCAACTCTCACT-3′, R: 5′-CGTTAACTGCATCTGGCTGA-3′; ms-Tnfα (Qiagen, PPM03113G); ms-Il1β (Qiagen, PPM03109F); housekeeping: Tuba1a F: 5′-GTGCATCTCCATCCATGTTG-3′, R: 5′-GTGGGTTCCAGGTCTACGAA-3′. Relative quantification of gene expression was performed using the \(2^}_T}\) method61.
Tissue preparationMice were anesthetized using pentobarbital (Vortech Pharmaceuticals, NDC 0298-9373-68, 150 mg kg−1 in 0.9% saline) and transcardially perfused with 5 ml of 1× PBS followed by 30 ml of 10% formalin solution (Thermo Fisher Scientific). Lumbar DRG tissues were dissected and placed temporarily in RNAlater solution at room temperature (Thermo Fisher Scientific) and then frozen in O.C.T. Compound (Sakura Finetek, catalogue number 4583) on dry ice and stored at −80 °C. Mouse DRG was sectioned at 14 µm and mounted onto SuperFrost Plus glass slides, dried for 1 hour and stored at −80 °C. Human lumbar DRG were obtained from organ donors who were de-identified before collection. Extracted tissues were flash frozen immediately on dry ice and stored in screw cap 15-ml conical tubes and stored at −80 °C. DRG were slowly embedded in O.C.T. on dry ice and sectioned at 20 µm onto SuperFrost Plus glass slides and stored at −80 °C.
Fluorescent in situ hybridizationFluorescent in situ hybridization using an RNAscope Multiplex V2 Kit (ACDBio, catalogue number 323100) was performed to detect the RNA of senescence markers, cytokine and DRG neuronal markers (p21 (Cdkn1a), p16 (Cdkn2a), IL6 and Tprv1). In brief, DRG tissues were isolated and processed as described above. DRG sections (14 µm) were mounted on glass slides and dried for 1 hour at room temperature and stored at −80 °C. On day 1 of RNAscope, slides were submerged in 10% formalin and incubated for 20 minutes at 4 °C. Slides were washed (1× PBS) and dehydrated (EtOH) as described in the ACD RNAscope user manual (UM 323100). Sections were incubated for 10 minutes in RNAscope hydrogen peroxide solution, washed in Millipore water and incubated in RNAscope Protease IV for 1 minute (human) or 5 minutes (mouse) at room temperature. Slides were incubated with appropriate RNAscope probes (mouse probes: Mm-IL6-C1, catalogue number 315891, Mm-Cdkn1a-C2, cat. no. 408551-C2, Mm-Cdkn2a-C3, cat. no. 411011-C3, Mm-Cdkn2a-tv2-C2, cat. no. 447491, Mm-Trpv1, cat. nos. 313331-C1 and 313331-C3; human probes: Hs-TRPV1-C1, cat. no. 415381, Hs-CDKN2A-C2, cat. no. 310181-C2, Hs-CDKN1A-C3, cat. no. 311401) at 40 °C in a Hybez II oven (ACDBio) for 2 hours and stored overnight in 5× SSC buffer at room temperature. On day 2, slides were incubated in Amp1, Amp2 and/or Amp3 solutions followed by HRP-C1, HRP-C2 and/or HRP-C3 as appropriate. In each round, TSA Vivid dye reagents (1:1,000; ACDBio, TSA Vivid 520 catalogue number 323271, TSA Vivid 570 catalogue number 323272, TSA Vivid 650 cat. no. 323273) and HRP blocker were used. Negative control probes (ACDBio, catalogue number 321838) were used to assess background levels of RNAscope signal.
ImmunohistochemistryFor immunohistochemistry performed immediately after RNAscope protocol (dual labeling), slides were first washed in 1× PBS and blocked (10% normal donkey serum, 0.3% Triton-X 100, in PBS) for 1 hour at room temperature. Slides were incubated with rabbit anti-ATF3 (1:200; Novus Bio, catalogue number NBP1-85816) in 1% blocking solution in 1× PBS at 4 °C overnight. Slides were washed three times in 1× PBS for 5 minutes each, incubated with Alexa Fluor secondary antibodies (1:1,000; donkey anti-rabbit-A488, Life Technologies, cat. no. A21206) and mounted with Fluoromount G with DAPI (Thermo Fisher Scientific, cat. no. 00-4959-52).
For CC3 immunostaining, mice were transcardially perfused as described, and DRG tissues were extracted and frozen in O.C.T. Slides were then blocked (5% normal donkey serum, 0.3% Triton-X 100, in PBS) for 1 hour at room temperature. Rabbit CC3 primary antibody (1:200; Cell Signaling Technology, catalogue number 9661) was incubated overnight at 4 °C. Slides were incubated with secondary antibody (1:1,000; donkey anti-rabbit Alexa Fluor 555, Life Technologies, catalogue number A31572) for 2 hours in the dark, washed and mounted with Fluoromount G with DAPI. Primary antibody controls (no-primary conditions) were used throughout to validate immuno-positive signal.
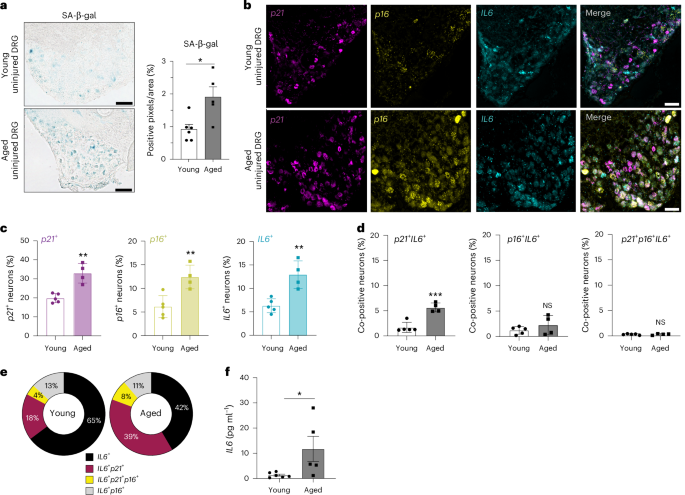
SA-β-gal activity assayMice were perfused with cold 1× PBS. L3–L5 DRG were extracted and mounted onto O.C.T. DRG were sectioned at 14 µm onto glass slides. Slides were removed from the freezer, and 1× of fixative solution provided by Senescence β-Galactosidase Staining Kit (Cell Signaling Technology, catalogue number 9860S) was added to the slides for 15 minutes. Slides were rinsed in PBS, and a wax barrier was drawn around the sections. Fresh β-Galactosidase Staining Solution at pH 6.1 was added to the slides and incubated at 37 °C for 22 hours. β-Galactosidase Staining Solution was removed, and slides were rinsed twice in PBS and twice in distilled water before mounting and imaging. Fiji version 2.9.0 software was used to outline the area of the DRG, and the percentage of positive SA-β-gal pixels in the area was acquired and normalized to area. Sections5,6,7,8,9,10 were analyzed per mouse.
Neuron diameter analysisFluorescent TIFF images taken from RNAscope experiments that labeled p21, p16, IL6 RNA and DAPI were used to measure diameters of neurons in both mouse and human DRG. Cells were then categorized according to their co-expression of markers p21, p16 or IL6. Using Fiji version 2.9.0 software, the scale (µm) was appropriately set based on objective used in image. The longest end-to-end cell diameters, with the line centered through each neuron using the ‘line segment tool’. The line was measured using ‘Measure’ as an output in µm unit.
ELISA assayOne-milliliter syringes were coated with heparin and used to withdraw approximately 0.8 ml of blood from anesthetized mice. Blood was centrifuged (1-ml tubes) at 2,000g at 4 °C for 10 minutes. The supernatant was removed, aliquoted and stored at −80 °C. IL6 plasma concentration levels were measured using an IL6 ELISA kit (Thermo Fisher Scientific, catalogue number KMC0061). Samples were tested in duplicate and diluted 1:2. The final concentration was corrected for the dilution factor. A VersaMax tunable microplate reader (Molecular Devices) was used to calculate optical density (OD) values at 450 nm. Data were analyzed with Boster Bio’s 5PL regression model and subtracting the blank well’s OD value from the sample’s OD values (https://www.bosterbio.com/biology-research-tools/elisa-data-analysis-online).
DRG neuron dissociation and cultureLumbar L3–6 DRG were excised from aged mice (24 months) after transcardial perfusion with 3 ml of 1× PBS (Corning, ref. no. 21-031-CV). DRG were placed into DMEM media supplemented with 10% FBS and penicillin–streptomycin (10 U ml−1/10 µg ml−1; Thermo Fisher Scientific, catalogue number 15070063) on ice during collection. DRG were then washed with HBSS and placed in 3 ml of warmed Dispase II (2.5 mg ml−1)/Collagenase A (1.25 mg ml−1) and incubated at 37 °C shaking (200 r.p.m.) for 30 minutes (Sigma-Aldrich, catalogue number 10103578001, catalogue number D4693-1G). DRG were then washed with 5 ml of HBSS and placed in 1 ml of neurobasal media (Thermo Fisher Scientific, cat no. 10888022) supplemented with 5% FBS (Sigma-Aldrich, cat. no. F4135-500ML), 1× GlutaMAX (Gibco, cat. no. 35050061), 1× B-27 supplement (Thermo Fisher Scientific, cat. no. 10889038) and penicillin–streptomycin. DRG were then triturated approximately 4–6 times with a P1000 pipette, followed by a series of four fire-polished glass pipettes of decreasing bore size. Dissociated cells were filtered through a 40-µm sterile mesh filter. Cells were spun at 300g for 4 minutes and resuspended in supplemented neurobasal media without FBS for subsequent culture. Twenty-four-well culture plates containing sterilized glass coverslips were pre-coated with 1/30th mixture of Geltrex LDEV-Free Reduced Growth Factor Basement Membrane Matrix (Thermo Fisher Scientific, catalogue number A1413202) with neurobasal media and incubated for 2 hours at 37 °C. Coverslips were rinsed with neurobasal media and left to dry in the culture hood for 1 hour. Cells were plated in 1 ml of supplemented neurobasal media without FBS. Coverslips were collected for electrophysiology recordings 48 hours after plating.
ElectrophysiologyFor ex vivo recording preparations, all extracellular solutions in contact with live tissue were bubbled with a 95% O2/5% CO2 gas. Animals were deeply anesthetized with a ketamine/xylazine bolus and transcardially perfused with a sucrose-based dissection solution (containing in mM: 250 sucrose, 2.5 KCl, 25 NaHCO3, 1 NaH2PO4, 6 MgCl2, 0.5 CaCl2 and 25 glucose). The vertebral column was removed and placed in dissection solution. The DRG were removed and stripped of epineurium. The tissue was transferred to collagenase (1 mg ml−1 in dissection solution) to incubate for 30 minutes at 35 °C to digest the perineurium. Recordings were performed in a chamber (RC-26GLP; Warner Instruments) within an upright microscope (Nikon Eclipse FN1) and secured with a platinum wire-based anchor, and tissue was constantly perfused with artificial cerebrospinal fluid (aCSF; composition in mM: 125 NaCl, 2.5 KCl, 25 NaHCO3, 1.0 NaH2PO4, 1.0 MgCl2, 2.0 CaCl2 and 25 glucose). For in vitro (culture) preparations, coverslips were pre-incubated with either IL6 (50 ng ml−1 with carrier, prepared from 100 μg ml−1 stock solution in 0.1% BSA; R&D Systems, catalogue number 406-ML) or control media (with 0.00005% BSA) for 1 hour before recording, and aCSF containing the same concentration of either IL6 or control BSA was applied (29−32 °C). Coverslips were discarded 1 hour after transfer to the recording chamber. Patch pipettes were pulled (P-97; Sutter Instruments) from single-filament borosilicate glass capillaries (1.5 mm OD, 1.1 mm ID; Sutter Instruments) with resistances from 5 MΩ to 8 MΩ and filled with internal patch solution as follows (in mM): 120 potassium gluconate, 20 KCl, 165 2 MgCl2, 2 Na2ATP, 0.5 NaGTP, 20 HEPES, 0.5 EGTA, pH adjusted to 7.2–7.3 with KOH. Signals were amplified (Multiclamp 700B; Molecular Devices), digitized (Digidata 1440A; Molecular Devices), filtered with a 4-kHz Bessel and sampled at 10 kHz (pClamp 10.6 software; Molecular Devices). Liquid junction potentials (−14 mV) were corrected for (JPCalc software, P. Barry, University of New South Wales, Sydney, Australia; modified for Molecular Devices). In current clamp, depolarizing current steps were applied from resting membrane potential to determine excitability parameters. After recordings, images were taken of the neuron to estimate size (the average of two separate diameter measurements), and the cytoplasm was aspirated into the patch pipette for subsequent PCR. PCR was performed using primers for p16 (Mm.PT.58.42804808; Integrated DNA Technologies (IDT)), p21 (Mm.PT.58.5884610; IDT), IL6 (Mm.PT.58.10005566; IDT), GFAP (to determine glia presence in sample; Mm01253033_m1; Thermo Fisher Scientific) and Tubb3 (to confirm that neuronal tissue was sampled; Mm.PT.58.32393592; IDT) in combination with TaqMan Gene Expression Master Mix (Thermo Fisher Scientific, catalogue number 4369016). Samples were then subjected to real-time PCR with the same primers and the SuperScript III One-Step RT–PCR System with Platinum Taq DNA Polymerase (Thermo Fisher Scientific, catalogue number 12574018). UMAP (Python implementation from https://github.com/lmcinnes/umap) was performed to integrate and connect the high-dimensional neuronal parameters33 in low-dimensional 2D space. Training was performed using the train_test_split function from scikit-learn over 1,000 epochs. UMAP hyperparameters were as follows: number of neighbors = 5, minimum distance = 0.815, local connectivity = 2, random state = 42. Clusters were then estimated via HDBSCAN (Python implementation from https://github.com/scikit-learn-contrib/hdbscan/blob/master/docs/index.rst) with the following parameters: minimum cluster size = 4, cluster selection epsilon = 9, cluster selection method = ‘eom’ or Excess of Mass. Parameters were normalized for heatmap visualization using the following equation: (p − min(p)) / (max(p) − min(p)), where p is a vector containing all measurements of a given parameter.
Mechanical nociception assaysTo evaluate mechanical reflexive hypersensitivity, we used a logarithmically increasing set of eight von Frey filaments (Stoelting), ranging in gram force from 0.007 g to 6.0 g. These were applied perpendicular to the plantar hindpaw with sufficient force to cause a slight bending of the filament. A positive response was characterized as a rapid withdrawal of the paw away from the stimulus filament within 4 seconds. Using the up-down statistical method62, the 50% withdrawal mechanical threshold scores were calculated for each mouse and then averaged across the experimental groups.
UnweightingAn incapacitance device (IITC Life Science) was used to measure hindpaw unweighting. Mice were placed in the plexiglass apparatus with a ramp with the hindpaws resting on separate metal scale plates. Measurements were taken when the hindpaws were supporting the weight of the mouse with forepaws on the ramp. Each measurement was 4–6 seconds, and six consecutive measurements were taken at 60-second intervals. Six readings were averaged to calculate the bilateral hindpaw weight-bearing values. The calculation of weight bearing on the injured hindlimb was as follows: 2 × (L) / (L + R) × 100 to get percent weight bearing on injured (L, left) hindlimb.
Imaging/image analysisAll imaging was performed using a Keyence BZ-X810 fluorescence microscope (Keyence Corporation) using a ×40 objective (mouse DRG) or a ×20 objective (human DRG). Eight to 12 DRG sections were imaged per mouse and 3–5 DRG sections per human sample. Images were saved as stitched/full focus TIFF files using Keyence BZ-X800 Analyzer version 1.1.1.8. Fiji 2.9.0 was used for subsequent image processing and analysis. All images were similarly adjusted for brightness and contrast (across the entire image) per experiment, with no additional alterations made to the image. Lipofuscin signal was defined by strong autofluorescence signal across all channels (488 nm, 550 nm and 647 nm).
Quantification and statistical analysisMeasurements of cohort sizes were determined based on historical data from our laboratory using a power analysis to provide greater than 80% power to discover 25% differences with P < 0.05 between groups to require a minimum of four animals per group for all behavioral outcomes and two animals per group for RNAscope analyses. All experiments were randomized by cage and performed by a blinded researcher. Researchers remained blinded throughout histological, biochemical, electrophysiological and behavioral assessments. Groups were unblinded at the end of each experiment before statistical analysis. All data are expressed as the mean values ± s.e.m. Data distribution was assumed to be normal, but this was not formally tested. Data were collected using Excel version 2108. Statistical analysis was performed using GraphPad Prism version 10.0.2, Python or R, as described in Methods. Data were analyzed using two-tailed Student’s t-test or Mann–Whitney tests, depending on the normality of the distribution, as indicated in the main text or figure captions, as appropriate. Combinations of male and female mice, young or aged, were used throughout the study. No data were excluded from analyses. In some cases, the different sections of the same DRG from the same mouse was used to detect multiple senescence markers for RNAscope analyses. DAPI nuclear stain was used to determine glial–neuronal boundary to carefully associate RNAscope puncta with neuronal cell bodies. For mouse DRG, neurons expressing RNA were quantified per probe set as: IL6+ >5 puncta; p16+ >10 puncta; p21+ >20 puncta; Trpv1+ >20 puncta. Human DRG neuron cutoffs for positive counted cells were as follows: IL6 >10 puncta, p16 >15 puncta, p21 >20 puncta, Trpv1 >20 puncta. Experimenter was blinded to age/sex/timepoint per experiment during RNAscope quantification. All counts were conducted assessing more than 800 total DRG neurons per experiment per biological replicate. No experiment presented in this study failed to replicate.
Transcriptomic analysis of existing datasetsSingle-nucleus and single-cell RNA-seq datasets were acquired from the sources described below. Transcriptomic data were processed in Python 3.10 using scanpy-1.10.1, anndata-0.10.7, numpy-1.26.4, scipy-1.11.4, pandas-2.2.2 and statsmodels-0.14.2 software packages. Differential gene expression significance was calculated using the Wilcoxon rank-sum test. P values were false discovery rate (FDR) corrected using the Benjamini–Hochberg method. A gene is considered differentially expressed if the log2 fold change (FC) is greater than |0.6| and the adjusted P value is less than 0.05. To detect senescent cell populations, discrete counts and percentages of senescent cells were calculated using several binary signatures as described in each figure. A cell was only considered positive for a signature if it contained a nonzero expression of all positive genes in the signature and zero expression of all negative genes in the signature. For example, a cell would be considered positive for the signature CDKN2A+LMNB1−TOP2A− if it had nonzero expression of CDKN2A and zero expression of LMNB1 and TOP2A. For SenMayo gene set scoring, single-cell and single-nucleus data were log1p transformed, centered and scaled around the gene mean and variance, respectively, using scanpy. To address differences in basal expression in SenMayo genes between cell types and highlight the changes in SenMayo scoring for each cell type, the same scaling was performed for each annotated cell type from Renthal et al.27 independently. Scoring performed on the North et al.38 bulk RNA-seq data was also scaled in the same manner but across the dataset. Gene set scoring was performed using the scanpy score genes method63. Scores were assessed for individual cells. Displayed heatmaps show the mean gene set score per annotated subtype and model timepoint.
For analysis of Renthal et al.27, we downloaded post-quality control (QC) raw count matrices from Gene Expression Omnibus (GEO) accession GSE154659 (158,785 nuclei). In addition to their pre-processing, we removed a small number of probable doublets using the ‘scrublet’ tool from the scanpy library (294 nuclei), leaving us with 158,758 nuclei. We restricted our analysis to the nuclei from the C57 mouse SpNT model and naive samples. This left us with 16,895 neuronal nuclei and 11,957 nonneuronal nuclei. For consistency, we used the cell type annotations provided by Renthal et al. Raw count data were normalized to counts per 10,000 for analysis.
For analysis of Wang et al.28, we aligned raw count matrices from GEO accession GSE155622 (114,243 cells). Our QC process removed 11,595 cells that had fewer than 500 unique molecular identifiers (UMIs) or fewer than 500 unique genes detected in a cell, had greater than 25% of UMIs from mitochondrial genes, had greater than 10% of UMIs from MALAT1 or were determined likely to be a doublet. After QC, we had 102,648 cells left for analysis. For consistency, we are using the cell type annotations provided by Wang et al. Raw count data were normalized to counts per 10,000 for analysis.
For analysis of Yu et al.37, we aligned raw count matrices from GEO accession GSE249746 (1,136 cells). Consistent with the Smart-Seq2 protocol, somewhat higher mitochondrial gene count ratios were observed, but we chose not to remove any cells from the analysis. Raw count data were normalized to counts per 10,000 for analysis.
For analysis of North et al.38 (https://apps.utdallas.edu/bbs/painneurosciencelab/sensoryomics/hdrgclinical/), bulk RNA-seq data in transcripts per million (TPM) and sample metadata were parsed from Supplementary Files 1 and 2 in the associated article. No additional normalization or post-processing was performed.
Reporting summaryFurther information on research design is available in the Nature Portfolio Reporting Summary linked to this article.
Comments (0)